Composite Faces of Study Of Us
The average face of 13,823 people, split by how they answered the survey. October 2026.
Each face below is a composite: hundreds or thousands of real Study Of Us members' photos, lined up by their features and averaged into one face. The people in each pair answered a survey question in opposite ways. On the left are the people at one end of the question, on the right the people at the other.
Within each pair, both sides were weighted to the same mix of ages and ethnicities, so a difference isn't just one side being older or less white. Under each figure is the question exactly as it was asked, and which answers went on each side. A figure marked * shows a difference that held up when we split the data in half at random and compared. † marks a weaker one, and anything unmarked could be chance. Press blink to flip between the two faces in place, which makes small differences easier to catch.
A composite shows the average, not what any one person looks like. Some differences come from how people take photos (angle, lighting, makeup, glasses) as much as from their faces.
Exaggeration: · · · The page opens at ×5; pick actual to see the real averages. Exaggeration pushes each pair apart from its midpoint, so whatever differs is easier to see. It magnifies chance differences just as much as real ones.
Plate I. Childhood and background
 No
 Yes
 No
 Yes
 Lower-middle class or poorer
 Upper-middle class or richer
 Lower-middle class or poorer
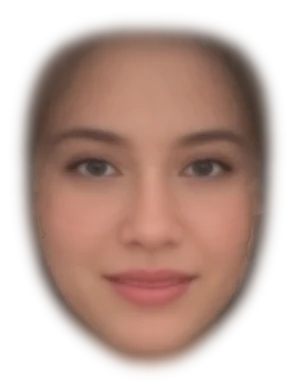 Upper-middle class or richer
* The difference shows up again in random halves of the data (beats all 1,000 shuffles). † Weaker: beats 99% of shuffles. Unmarked rows could be chance.
Plate II. Sex and dating
 0 to 4
 10 or more
 0 to 4
 10 or more
 Vanilla or a little kinky
 Pretty or extremely kinky
 Vanilla or a little kinky
 Pretty or extremely kinky
 Straight
 Leaning straight, bi or gay
 Straight
 Leaning straight, bi or gay
 Once a month or less
 Several times a week or more
 Once a month or less
 Several times a week or more
 No
 Yes
 No
 Yes
 Disagree or strongly disagree
 Agree or strongly agree
 Disagree or strongly disagree
 Agree or strongly agree
* The difference shows up again in random halves of the data (beats all 1,000 shuffles). † Weaker: beats 99% of shuffles. Unmarked rows could be chance.
Plate III. Mind, politics and belief
 Centre or right (average)
 Moderately left or more (average)
 Centre or right (average)
 Moderately left or more (average)
 Somewhat to totally disagree
 Somewhat to totally agree
 Somewhat to totally disagree
 Somewhat to totally agree
 Disagrees with both
 Agrees with both
 Disagrees with both
 Agrees with both
 Didn't tick Borderline
 Ticked Borderline
 Slightly to strongly disagree
 Slightly to strongly agree
 Slightly to strongly disagree
 Slightly to strongly agree
 Less attractive than average
 More attractive than average
 Less attractive than average
 More attractive than average
* The difference shows up again in random halves of the data (beats all 1,000 shuffles). † Weaker: beats 99% of shuffles. Unmarked rows could be chance.
Plate IV. Gender identity
 Man (cis)
 Nonbinary / other (AMAB)
 Woman (cis)
 Nonbinary / other (AFAB)
 Man (cis)
 Man (trans)
 Woman (cis)
 Woman (trans)
* The difference shows up again in random halves of the data (beats all 1,000 shuffles). † Weaker: beats 99% of shuffles. Unmarked rows could be chance.
Plate V. Body and life
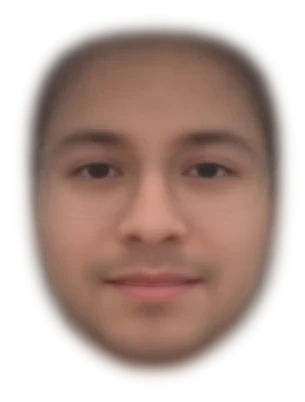 Short
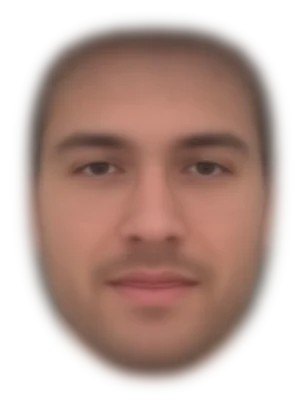 Tall
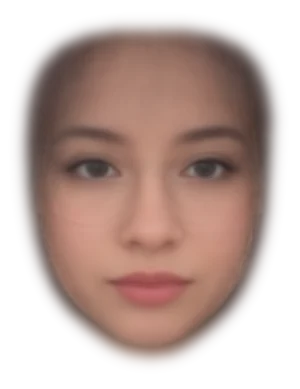 Short
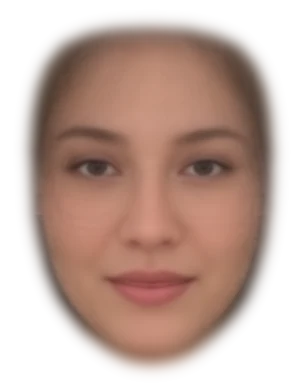 Tall
 Under 22
 27 or over
 Under 22
 27 or over
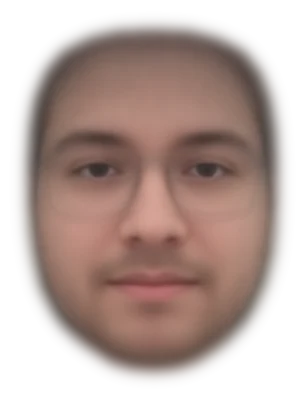 Not really
 Moderately or more
 Not really
 Moderately or more
 High school or less
 Bachelors or more
 High school or less
 Bachelors or more
 Under $50k, net worth $0 or less
 $100k+, net worth $100k+
 Under $50k, net worth $0 or less
 $100k+, net worth $100k+
* The difference shows up again in random halves of the data (beats all 1,000 shuffles). † Weaker: beats 99% of shuffles. Unmarked rows could be chance.
Plate VI. Personality, drive and mood
 Bottom third
 Top third
 Bottom third
 Top third
 Bottom third
 Top third
 Bottom third
 Top third
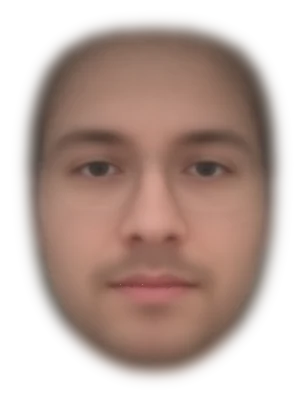 Somewhat to totally disagree
 Somewhat to totally agree
 Somewhat to totally disagree
 Somewhat to totally agree
 Not horny at all
 Moderately or real horny
 Not horny at all
 Moderately or real horny
* The difference shows up again in random halves of the data (beats all 1,000 shuffles). † Weaker: beats 99% of shuffles. Unmarked rows could be chance.
Notes on method
Who. 13,823 Study Of Us members with an approved photo: 10,450 cis men from the men's faces and 3,373 cis women from the women's faces. The gender-identity plate adds 343 nonbinary people assigned male at birth and 330 assigned female at birth, 229 trans men and 707 trans women, each from the faces they were rated with. Everyone was 18 or older in the photo they're represented by.
One photo per person. People who submitted many photos count once. We used each person's clearest photo: facing the camera first, then the sharpest. Anyone whose photos were all turned well away from the camera was left out (women were allowed slightly more turn, since there are fewer of them).
Making a composite. Every photo gets 478 facial landmarks (Google's MediaPipe face model). Faces are lined up on those landmarks, warped to the group's average face shape, then averaged pixel by pixel. Hair and background are faded out.
The two sides. Each figure compares two ranges of answers to one question; the caption says exactly which answers are on each side. Answers in between are left out.
Personality scores. The Big Five and HEXACO figures use the three short items Study Of Us asks for each trait, quoted under each figure. One item in each set is reverse-scored, as the Study Of Us app scores them, and the three are averaged. Each figure compares roughly the bottom third of scores with the top third, set separately for men and women.
Weighting. Everyone with an answer on either side is included, and N counts all of them. People were sorted into cells by age band (18–21, 22–25, 26–29, 30–34, 35–39, 40–49, 50+) and ethnicity (white, Hispanic, South Asian, East Asian, Black, other, not given), then weighted so the left and right sides have the same mix of cells. A cell only one side has is left out. A pair is shown only when each side has at least 60 people.
Does it hold up? For each pair we split both sides in half at random and measured the left-minus-right difference in each half, separately for face shape (landmark positions) and for skin and texture (pixel colours). If the difference is real, the two halves agree. We did this 300 times and compared the agreement with 1,000 runs where the left/right labels were shuffled within each age and ethnicity cell. * means it beat all 1,000 shuffles on shape or texture; † means it beat 99% of them. With 103 rows tested, expect one or two † by luck.
Left out. Questions where neither the men's nor the women's faces showed a difference that held up aren't shown: spanked as a kid, sexual upbringing, birth order, age at first sex, dominant or submissive, monogamous or polyamorous, has hired a sex worker, religion, attachment style, worried about AI killing everyone, has kids, relationship status, openness (Big Five), conscientiousness (Big Five), agreeableness (Big Five), neuroticism (Big Five), honesty-humility (HEXACO), emotionality (HEXACO), agreeableness (HEXACO), conscientiousness (HEXACO), openness (HEXACO), finds the supernatural plausible, needs to feel in control, officially tested IQ, shame about porn, baby fever, mood PMS symptoms, on hormonal birth control and ovulating right now.
Exaggeration. The ×2, ×3 and ×5 settings push each pair's two faces apart from their midpoint, by two, three or five times the real gap, in shape and in colour. That makes a small real difference visible, but it magnifies chance differences just as much, so check the marks first.
Limits. These are people who chose to submit a photo to be rated, mostly selfies, and every answer is self-reported. Nothing here is a single person's photo, and a composite of 60 or more people can't be traced back to anyone in it.