TL;DRFive headlines
- One in eight people overall (12.3%) answer above "No" — but the vast majority of that is "Yes, slightly." Clear, severe admissions ("significantly"/"extremely") run ~2% in both sexes.
- The abuse→abuser cycle is real but weak. Childhood sexual-abuse victims admit perpetration at roughly 1.6–1.8× the odds of non-victims in both sexes, surviving controls. But in absolute terms, about four in five victims of either sex answer "No."
- Among victims, the "normalized abuse" profile predicts perpetration — abuse that happened regularly, involved rewards, and was treated positively by others. Abuse that caused high distress at the time predicts less admission. Violent coercion: no unique signal.
- Admission rises steeply with age, and it's entirely exposure. Controlling lifetime partner count, the age gradient vanishes (OR 1.28 → 0.96 per SD). No evidence younger cohorts are less (or more) forthcoming.
- Women admit at over half the male rate — far closer to parity than victimization reports or criminal-justice statistics would suggest, with the gap concentrated at the mildest level.
THE QUESTIONWhat was actually asked — and what it can't tell you
rapist; we keep that name only when referring to the variable.)What it captures: the respondent's own retrospective perception that a partner did not want a sexual experience, and that they knew it at the time. The "slightly → extremely" scale is left to interpretation — it plausibly spans everything from pressing on through ambivalence or a partner's reluctant going-along, up to assault. It does not ask when it happened, how often, with whom, or whether the respondent considers it wrongdoing.
What it cannot capture: perpetration the respondent didn't perceive or won't report (a floor on all numbers here — see § base-rate honesty); the victim's side of the same event; legal categories. A "Yes, slightly" is not a rape confession, and treating it as one would misread the data. Symmetrically, a "No" is not proof of nothing. Every number below is "% answering above No," shortened to admission.
HOW MANYOne in seven men, one in twelve women
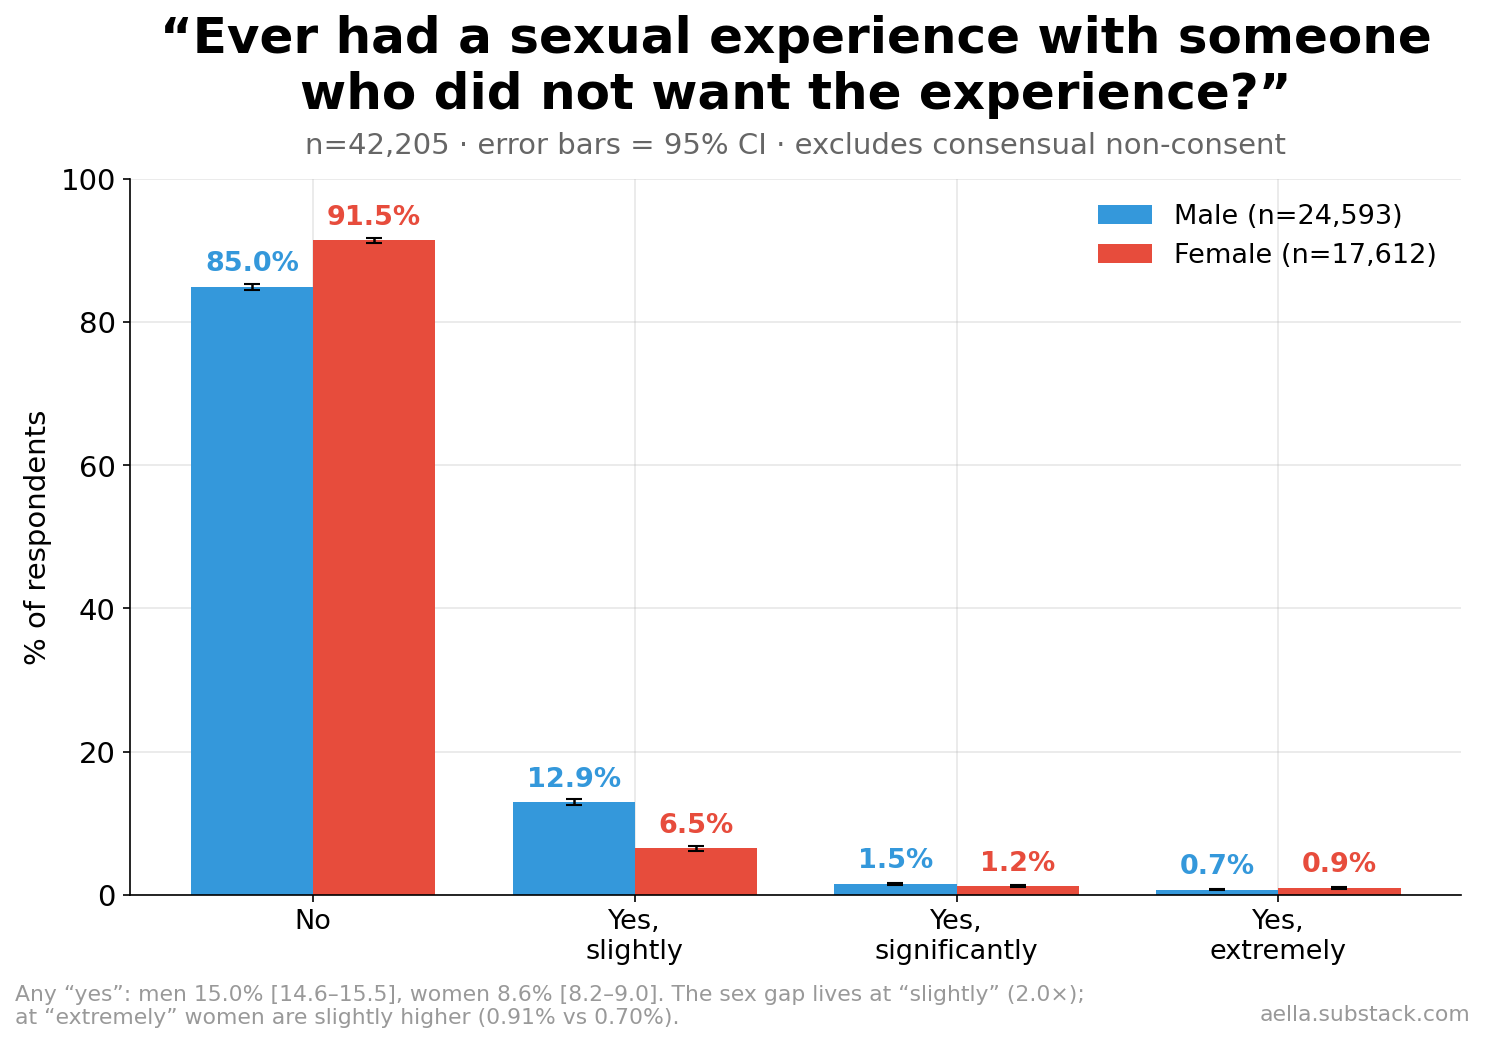
Men: 15.0% [14.6–15.5] answer above "No" (12.9% slightly, 1.5% significantly, 0.7% extremely). Women: 8.6% [8.2–9.0] (6.5% / 1.2% / 0.9%). The structure of the sex difference is the interesting part: at "slightly" men are 2.0× women, at "significantly" 1.25×, and at "extremely" women are nominally higher (0.91% vs 0.70%, ratio 0.77×). The classic male-perpetration gap, in self-report, is a gap in mild, ambiguous experiences; the small severe tail is sex-balanced in this sample.
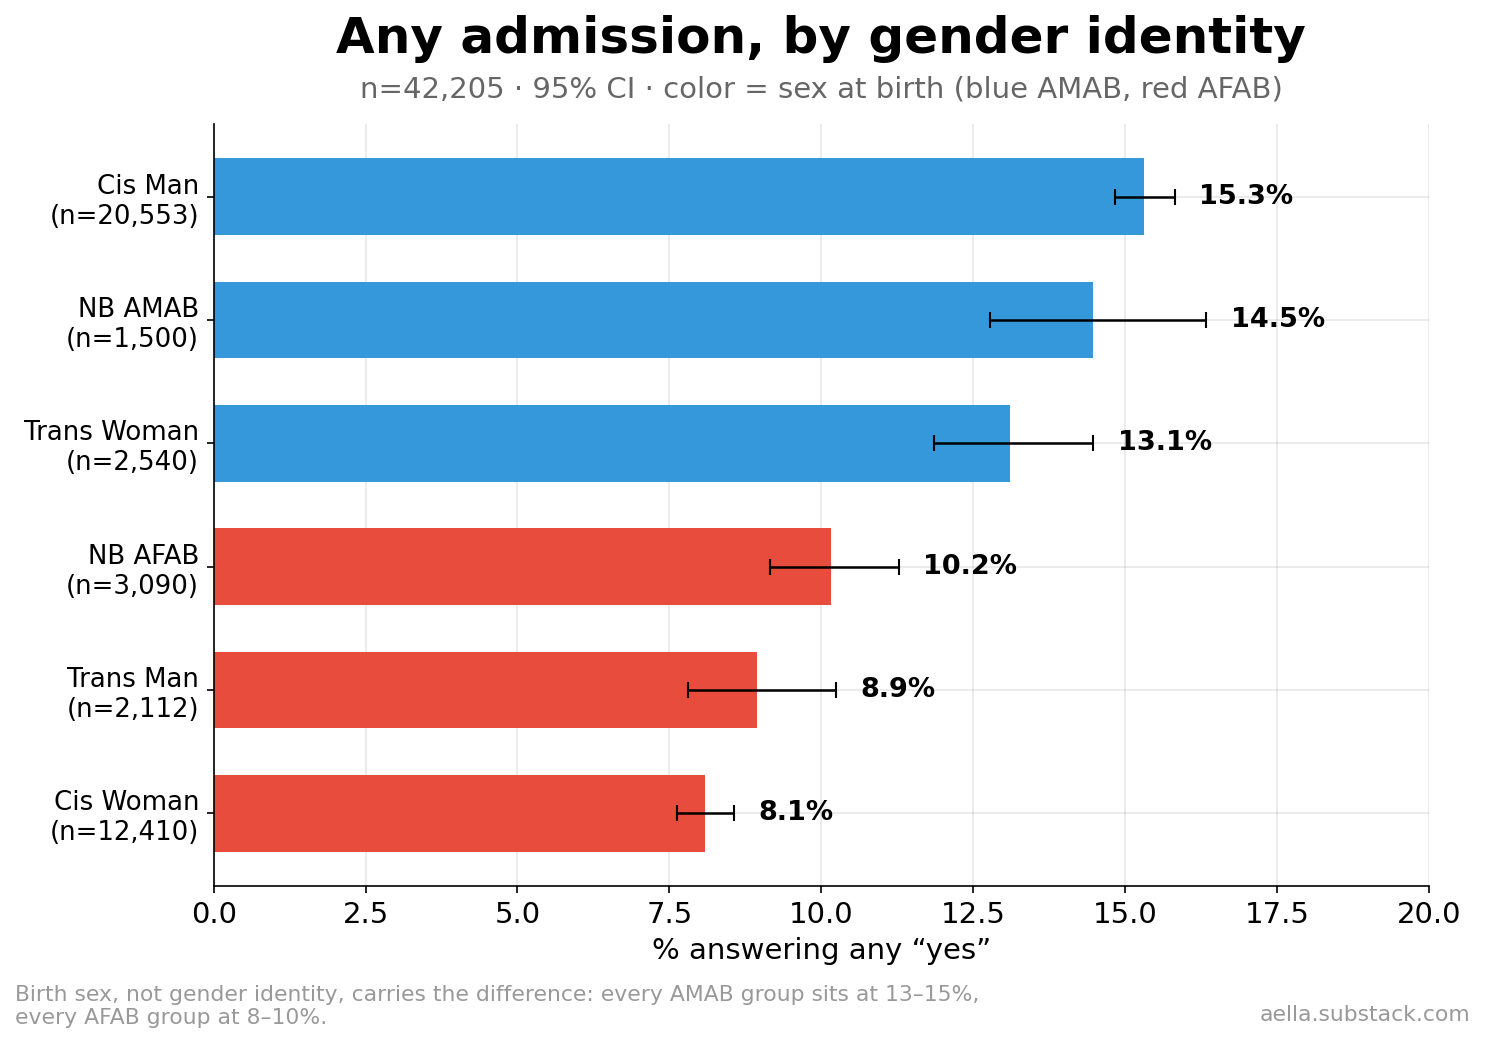
Split by gender identity, the variable behaves like a birth-sex trait, not an identity trait: every AMAB group (cis men 15.3%, nonbinary AMAB 14.5%, trans women 13.1%) sits above every AFAB group (NB AFAB 10.2%, trans men 8.9%, cis women 8.1%). All analyses below therefore split or control on sex at birth.
AGEThe age gradient is exposure, not candor
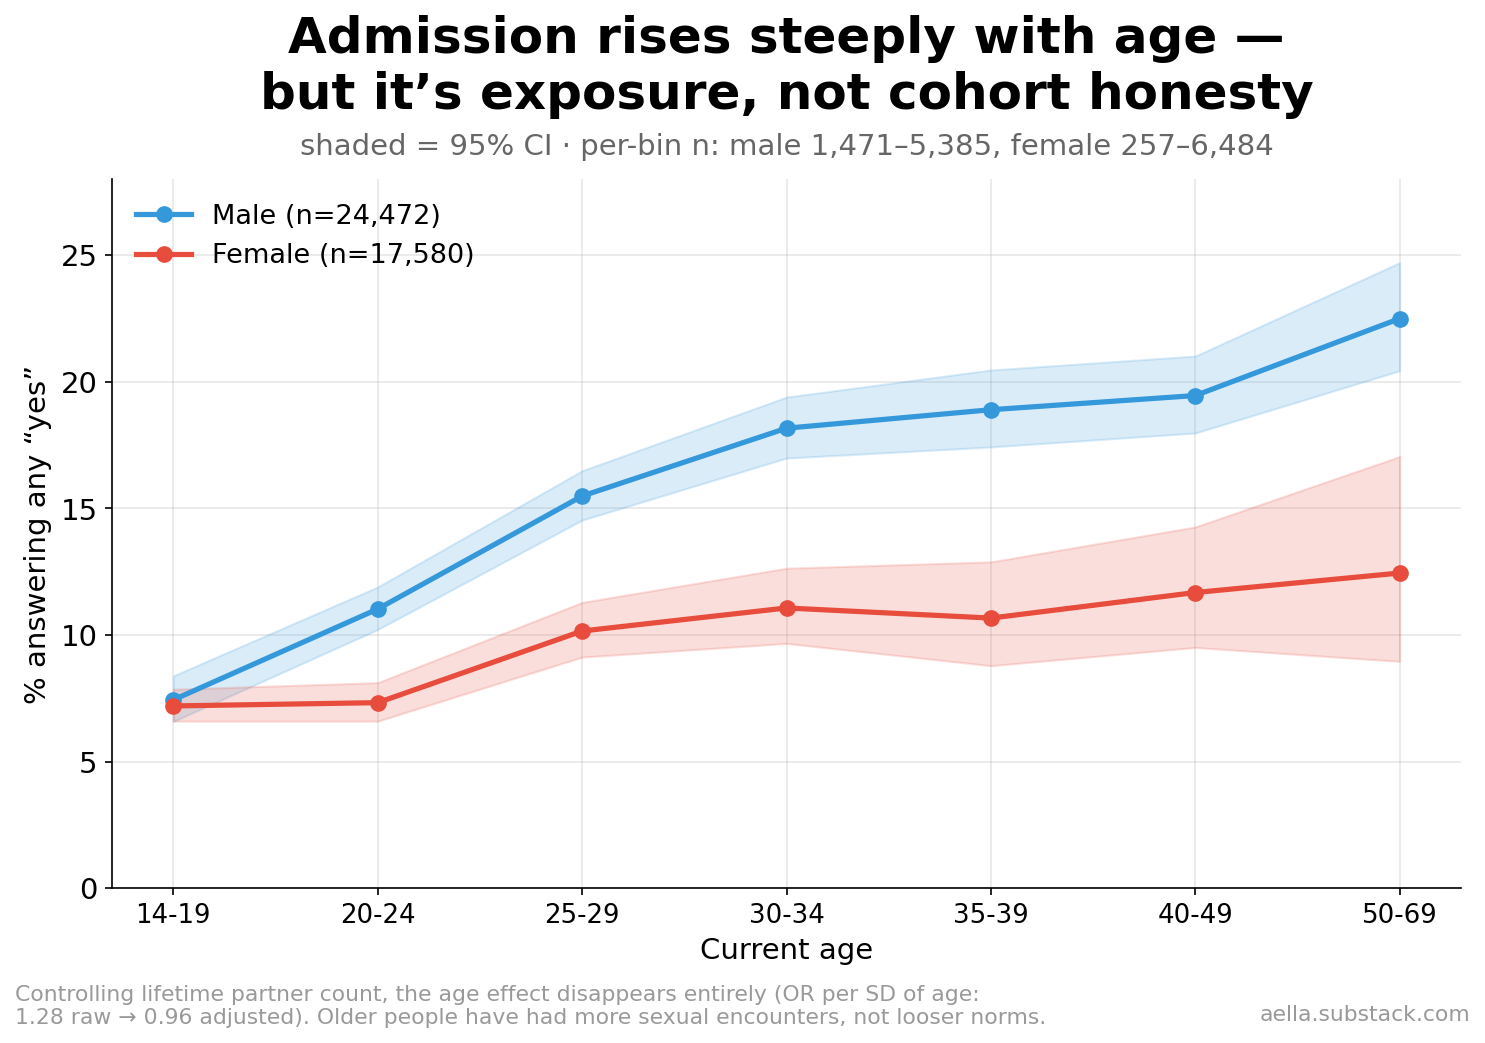
Admission triples across male age cohorts (7.4% at 14–19 → 22.5% at 50–69) and roughly doubles in women (7.2% → 12.5%). Two readings compete: older people have simply had more sexual history in which such an event could occur, or younger cohorts (raised on affirmative-consent norms) either commit or admit less. The data favors the first, completely: adding lifetime partner count to the model erases the age effect (OR per SD of age: 1.28 [1.24–1.31] → 0.96 [0.93–0.99]). Per unit of sexual exposure, the young admit at the same rate as the old — admission is neither declining nor rising across cohorts once you account for how much sex people have had.
THE CYCLE TESTDo the abused become abusers? Directly tested
The same survey asks in detail about the respondent's own childhood sexual abuse (gate question: "Did you experience any sexual abuse during your childhood?"), which lets us test the abuse→abuser hypothesis within one sample, by sex, with controls — instead of inferring it from incarcerated populations as the classic literature does.
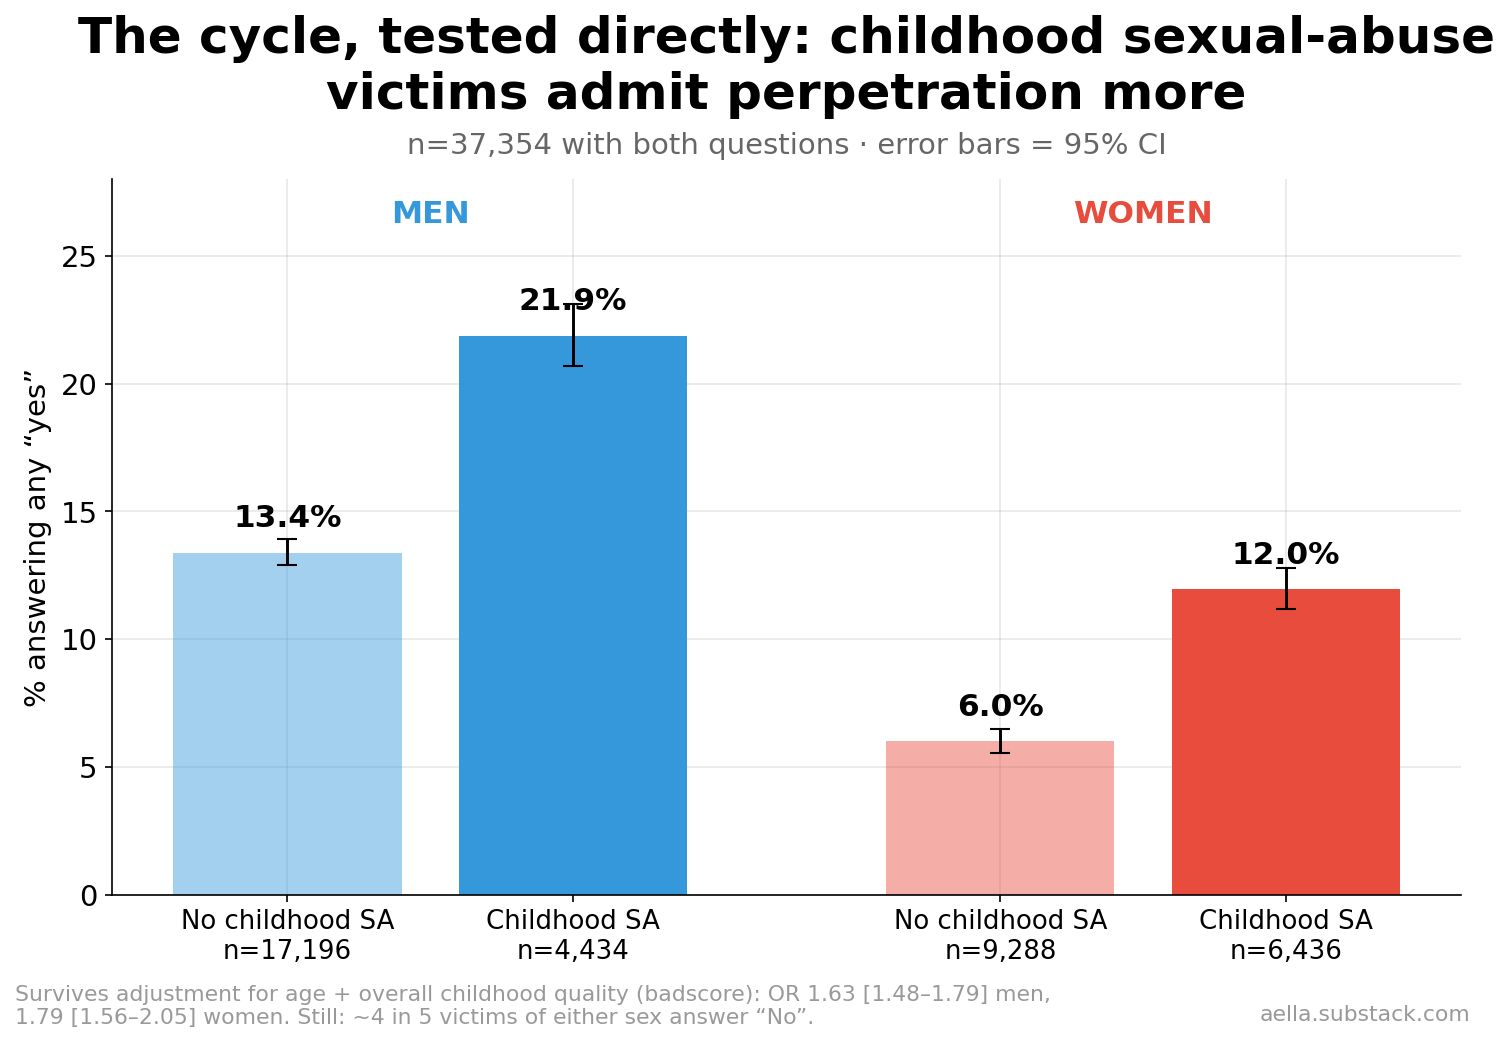
In absolute terms: 21.9% of male victims vs 13.4% of male non-victims answer above "No" (raw OR 1.81 [1.67–1.97]); 12.0% of female victims vs 6.0% of female non-victims (OR 2.13 [1.90–2.39]). The association survives age adjustment essentially unchanged (M 1.85, F 2.18) and survives adding the survey's overall childhood-quality score (badscorefinal): OR 1.63 [1.48–1.79] in men, 1.79 [1.56–2.05] in women. Since that score itself contains the SA items, this control is conservative — the cycle association is not just "bad childhoods cause everything."
Two things are true at once. The cycle exists: victimization roughly doubles the odds of admitted perpetration, in both sexes, and it is the single strongest childhood predictor in the survey. And the cycle is weak as prophecy: about 78–88% of victims (by sex) report never having done this, and most admitters were never victims (of the 3,273 admitting men with SA data, 70% report no childhood SA).
Which kind of abuse transmits?
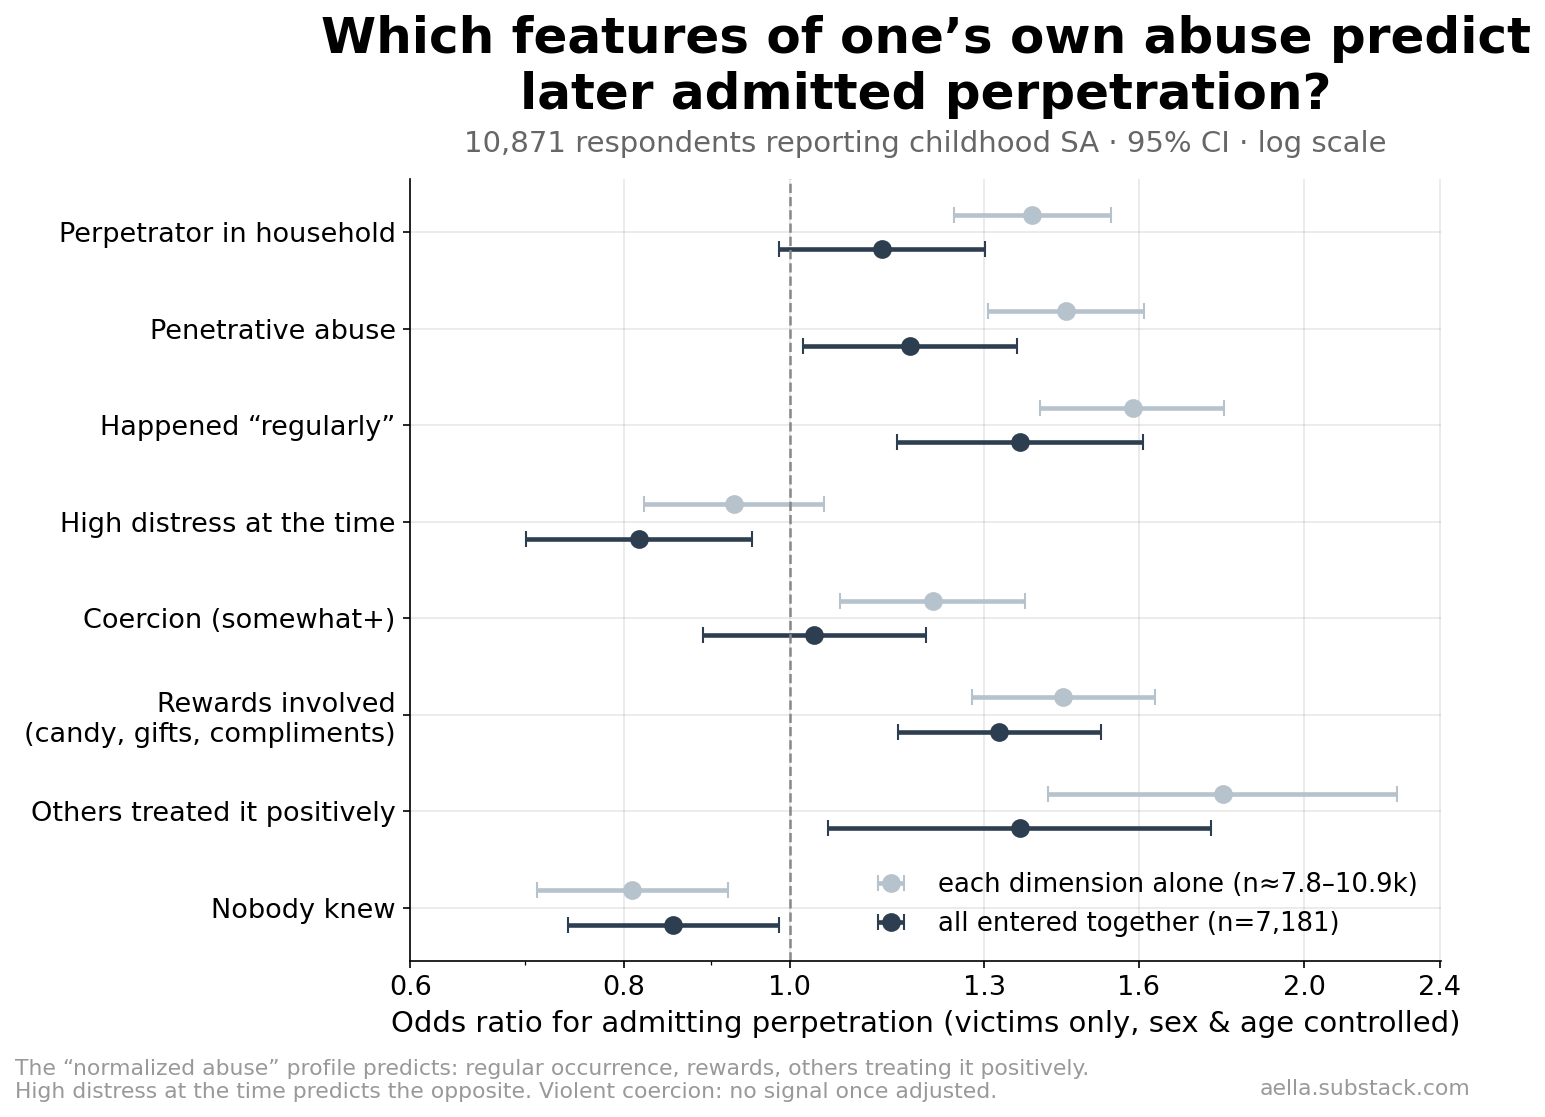
Among the 10,871 respondents reporting childhood SA, the survey records who the perpetrator was, severity, frequency, distress, coercion, rewards, and how people around the victim reacted. Entered together (n=7,181 complete cases, sex and age controlled), a coherent pattern emerges:
- Predicts admission: abuse that happened "regularly" (OR 1.36 [1.15–1.61]; 19.3% vs 15.1% absolute), abuse involving rewards — candy, gifts, compliments (1.33 [1.15–1.53]; 18.2% vs 14.1%), and abuse that people around the victim treated positively (1.36 [1.05–1.76]). That last group is small but striking: 24.1% [20.2–28.4] of victims whose disclosure was met positively admit perpetration, vs 15.0% of other victims — within sex, 30.1% of such men and 20.2% of such women.
- Predicts the opposite: high distress at the time (0.82 [0.70–0.95]) and nobody ever knowing (0.85 [0.74–0.99]).
- No unique signal: violent coercion (force, blackmail, threats) — OR 1.03 once the rest is controlled; household-member perpetrator drops from 1.39 alone to 1.13 [0.99–1.30] mutually adjusted.
Read together: what transmits is not the violence of the abuse but its normalization — repeated, reward-laced, socially tolerated abuse that didn't register as distressing. This is consistent with a learning account of the cycle (the experience taught that unwanted sex is ordinary) rather than a trauma account (the damage compels repetition); abuse experienced as terrifying, if anything, points the other way.
ANTECEDENTSThe rest of childhood, forced to compete
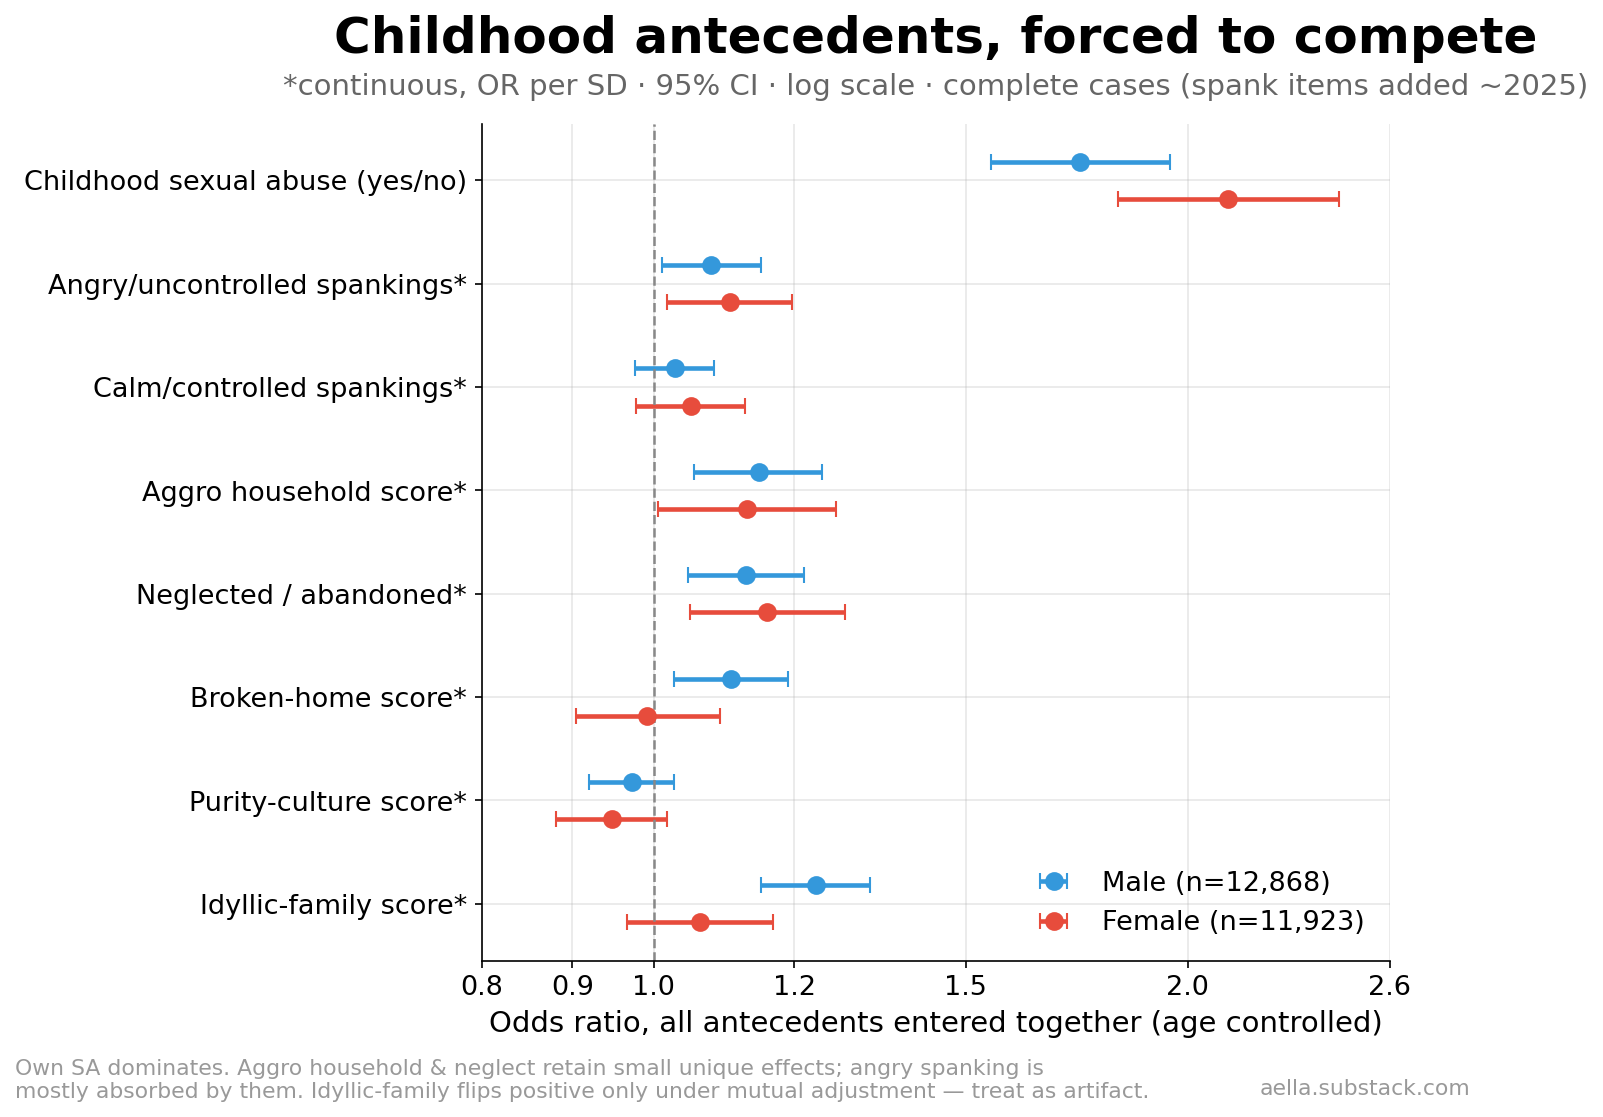
Does anything else in childhood predict admission once everything is entered together (within sex, age controlled, n≈24.8k complete cases)?
- Own SA dominates (OR 1.74 men, 2.11 women) — nothing else comes close.
- Aggro/loud household (yelling, verbal abuse, confrontational culture) and neglect/abandonment each keep small unique effects, OR ≈ 1.13–1.16 per SD in both sexes.
- Angry/uncontrolled spankings predict alone (OR 1.24 per SD; absolute: 17.3% vs 12.7% of men endorsing vs not, 10.1% vs 6.5% of women) but shrink to OR ≈ 1.08–1.10 once the household variables are in — angry spanking mostly marks an aggressive household rather than adding to it. Calm/controlled spankings predict nothing (joint OR ≈ 1.03–1.05, ns in both sexes; even alone, 1.05).
- Purity culture: nothing (if anything a hair protective, OR ≈ 0.95–0.97). Broken home: nothing left after the other variables (men 1.11, women 0.99). The idyllic-family score flips slightly positive under mutual adjustment (men 1.23) while predicting lower admission alone (OR 0.87) — a suppression artifact of controlling its correlates; we'd not interpret it.
And the total: childhood explains very little. The full childhood model — SA, both spanking types, aggro household, neglect, broken home, purity, parental warmth, plus sex and age — achieves McFadden pseudo-R² = 0.050 (Tjur R² = 0.038). Knowing everything this survey knows about someone's childhood moves a prediction of adult admission by only a few percentage points. The cycle is the strongest signal in the room, and the room is mostly noise: this behavior is not well-predicted by upbringing.
ITEM LEVELInside the composites: which specific items carry the signal
The model above used the survey's composite axes (aggro-household score, idyllic-family score, and so on). Composites are convenient but they can hide which ingredient does the work — "aggro household" bundles yelling, verbal abuse, parents fighting each other, and unpredictability into one number. So here we unpack them: the same regression rebuilt from 20 individual items — all seven aggro-battery items, all seven warmth items, the neglect item, the four physical-discipline types, and own SA. Each item is the stronger endorsement across its 0–12 and 13–18 versions; the duplicated "parents had a bad relationship" item (loud6 is a GT copy of broken6) enters once; "your parents were predictable" is reversed into unpredictability so that high = adverse throughout.
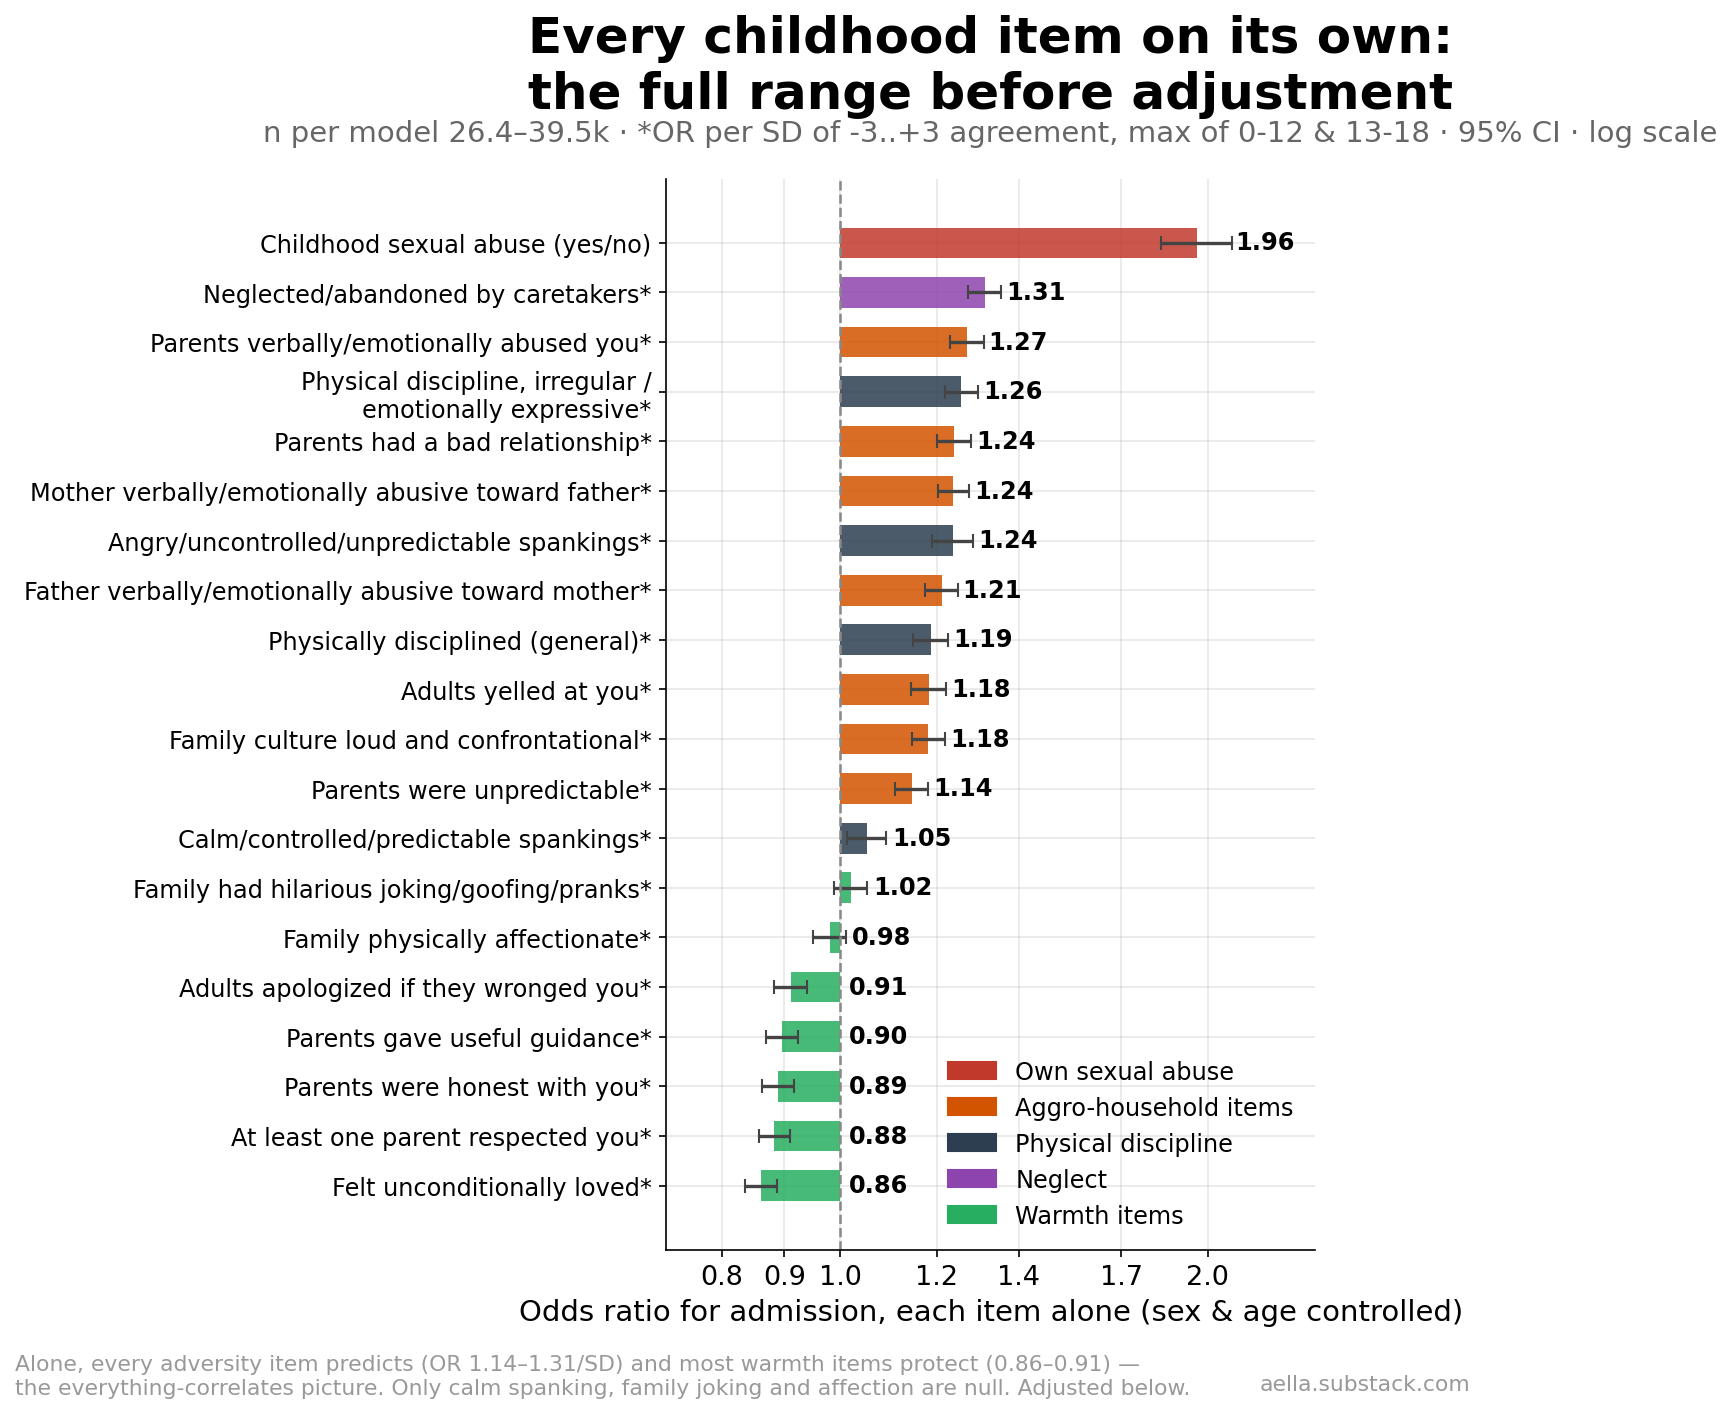
Taken one at a time (sex and age controlled), nearly everything "works," as it always does in childhood data: every adversity item predicts admission (OR 1.14–1.31 per SD) and most warmth items protect (0.86–0.91). The strongest single item after own SA (1.96) is neglect/abandonment at 1.31 — in absolute terms, 18.7% of men endorsing it admit vs 13.0% not, and 10.3% vs 6.2% of women. Next come parental verbal/emotional abuse (1.27) and irregular, emotionally expressive physical discipline (1.26). On the protective side, "you felt unconditionally loved" is the strongest (0.86; men 14.3% vs 16.7%, women 7.0% vs 9.8%). The only adversity-shaped item that predicts essentially nothing alone is calm/controlled spanking (1.05); family joking and physical affection are likewise null.
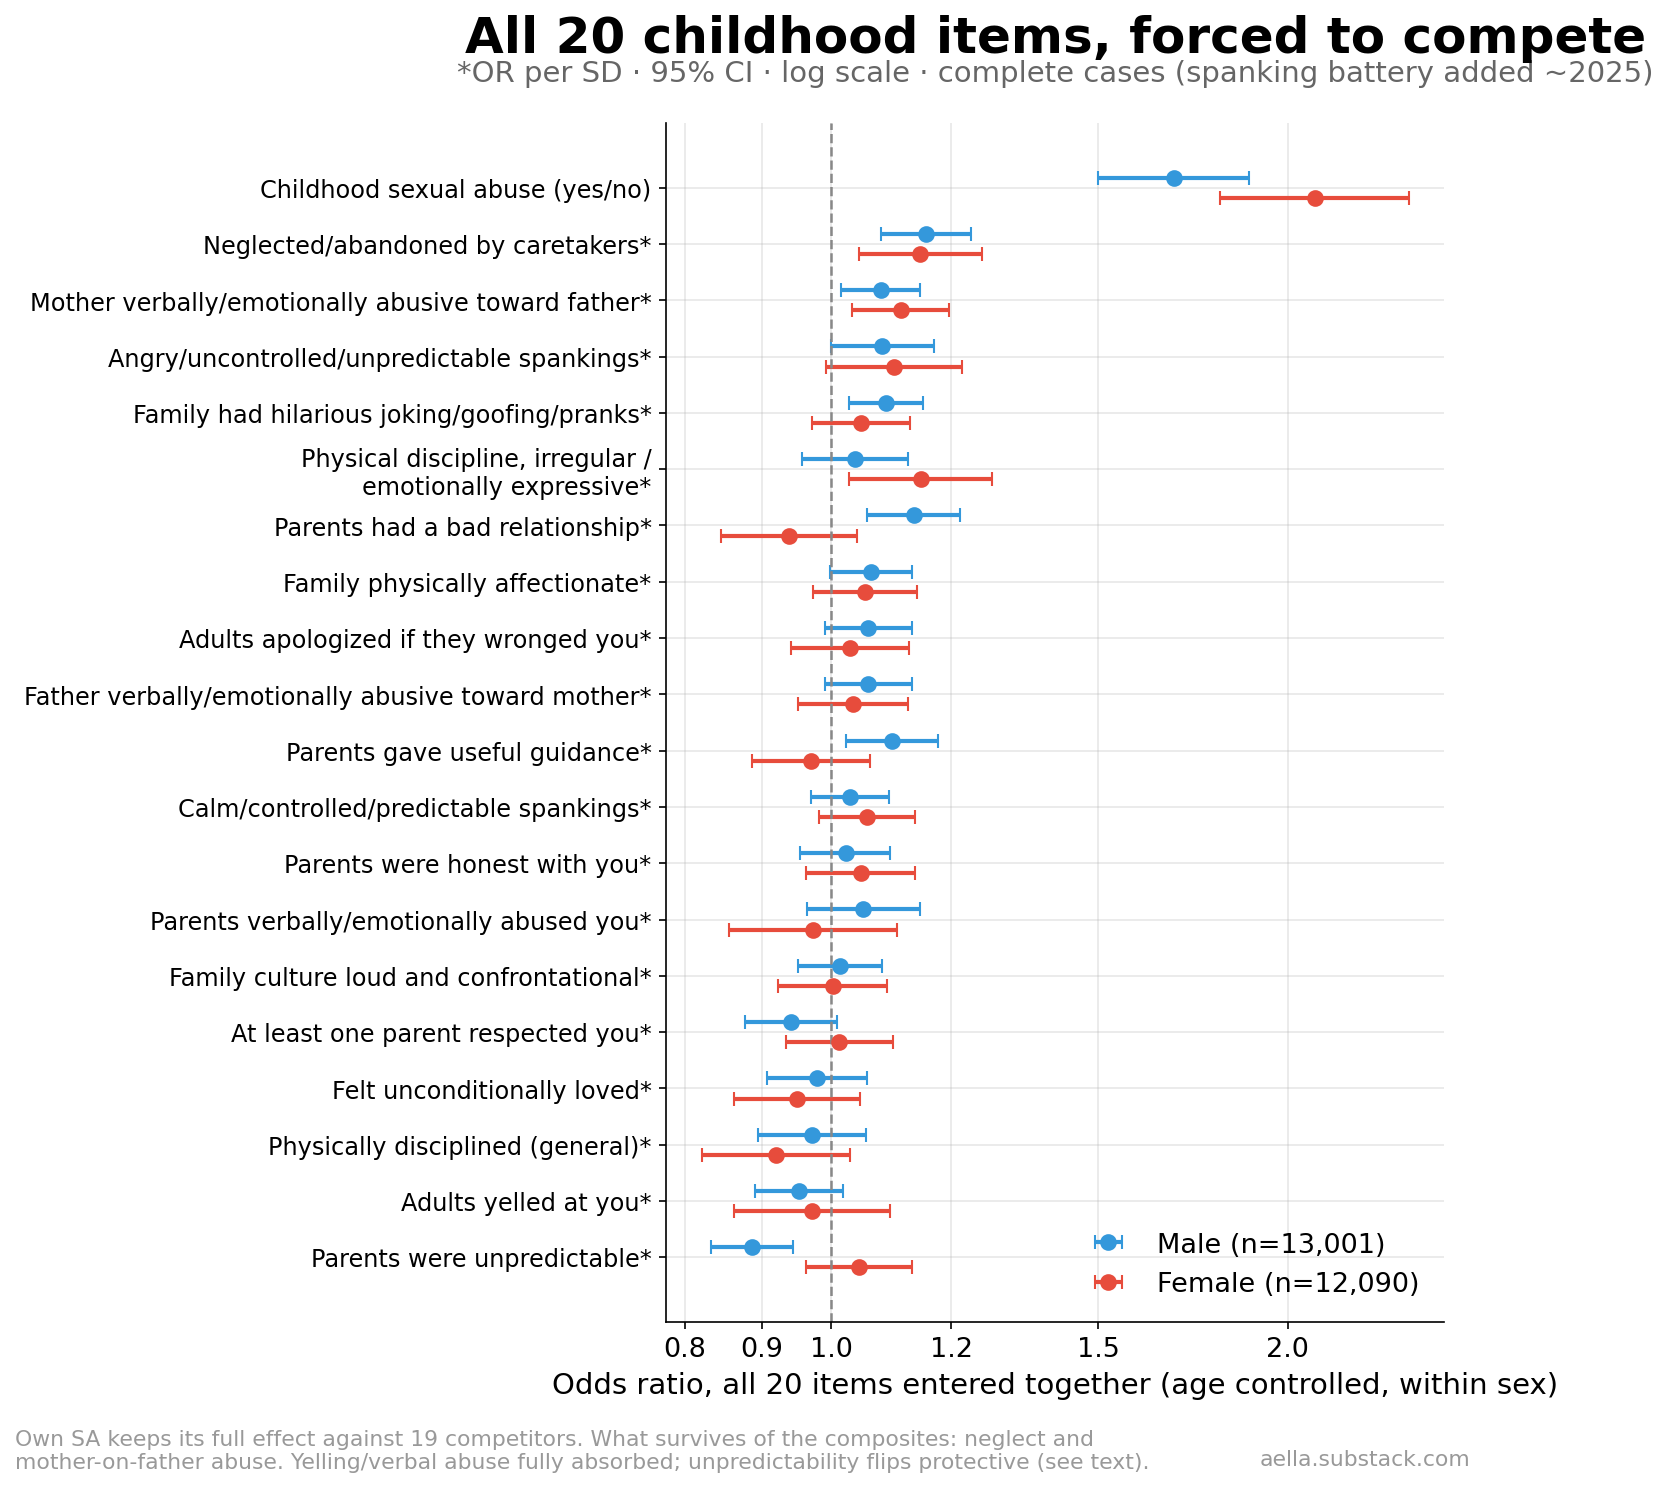
Entered together within sex (age controlled; 13,001 men / 12,090 women with complete data), the field thins drastically:
- Own SA is untouched by 19 competitors: OR 1.68 [1.50–1.89] in men, 2.08 [1.81–2.40] in women — essentially identical to the composite model. No combination of household items explains it away.
- Neglect/abandonment is the one household item that survives in both sexes (men 1.16 [1.08–1.24], women 1.15 [1.04–1.26] per SD). The composite model's "neglect" effect was real and is not reducible to the aggro items around it.
- The aggro composite's unique effect does not come from its loudest items. Yelling (1.18 alone → 0.96 adjusted), loud/confrontational family culture (1.18 → 1.01), and even direct parental verbal abuse (1.27 → 1.05 men / 0.97 women) are fully absorbed. What survives instead is mother being verbally/emotionally abusive toward father (men 1.08 [1.01–1.14], women 1.11 [1.03–1.20]) — while the mirror item, father abusing mother, survives in neither sex (1.06 / 1.03). We'd hold this asymmetry loosely (the two items correlate strongly, and which twin survives can be fragile), but it is the direction less covered by the usual narrative. For men, "parents had a bad relationship" also retains signal (1.13 [1.05–1.22]).
- Parental unpredictability is not the active ingredient. It predicts alone (1.14) but flips weakly protective once its correlates are controlled (0.94 pooled; 0.89 [0.83–0.94] in men) — the same suppression behavior the idyllic-family score showed in the composite model, and we'd interpret it the same way: as an artifact of adjusting away everything it travels with, not as "unpredictable parents protect." The small positive flips of guidance and family joking in men (1.10, 1.09) belong to the same family and get the same non-interpretation.
- Spanking, all four types, carries no unique signal. Angry spanking falls from 1.24 alone to 1.08 pooled and misses significance within either sex; calm spanking is null everywhere; general physical discipline contributes nothing. The one discipline item with a within-sex survivor is irregular, emotionally expressive physical discipline in women only (1.15 [1.03–1.28]; men 1.04). Discipline items mostly mark the household that produced them.
Does granularity help prediction? Barely. On the identical complete-case sample (n=24,791), the 20-item model achieves McFadden pseudo-R² = 0.052 against the composite model's 0.050 (Tjur 0.039 vs 0.038); AIC prefers the items by 9 points while spending 12 extra parameters. The composites were already capturing nearly everything the items know. The verdict of the previous section stands unchanged at item resolution: childhood — measured as finely as this survey can measure it — explains about 5% of the variance in who admits this. The item analysis sharpens where the weak signal lives (own SA, neglect, inter-parental hostility), not how strong it is.
Reading mutually adjusted items. With 20 correlated predictors, "no unique effect" does not mean "irrelevant" — yelling still marks elevated risk (15.6% vs 12.8% of men); it just adds nothing once you know the rest of the household. And sign-flips under adjustment (unpredictability, guidance, joking) are statistical residue, not discoveries. The solo chart is the right one for "is this item a risk marker?"; the joint chart for "which items carry independent information?"
ADULT PROFILEWho answers "yes," as adults
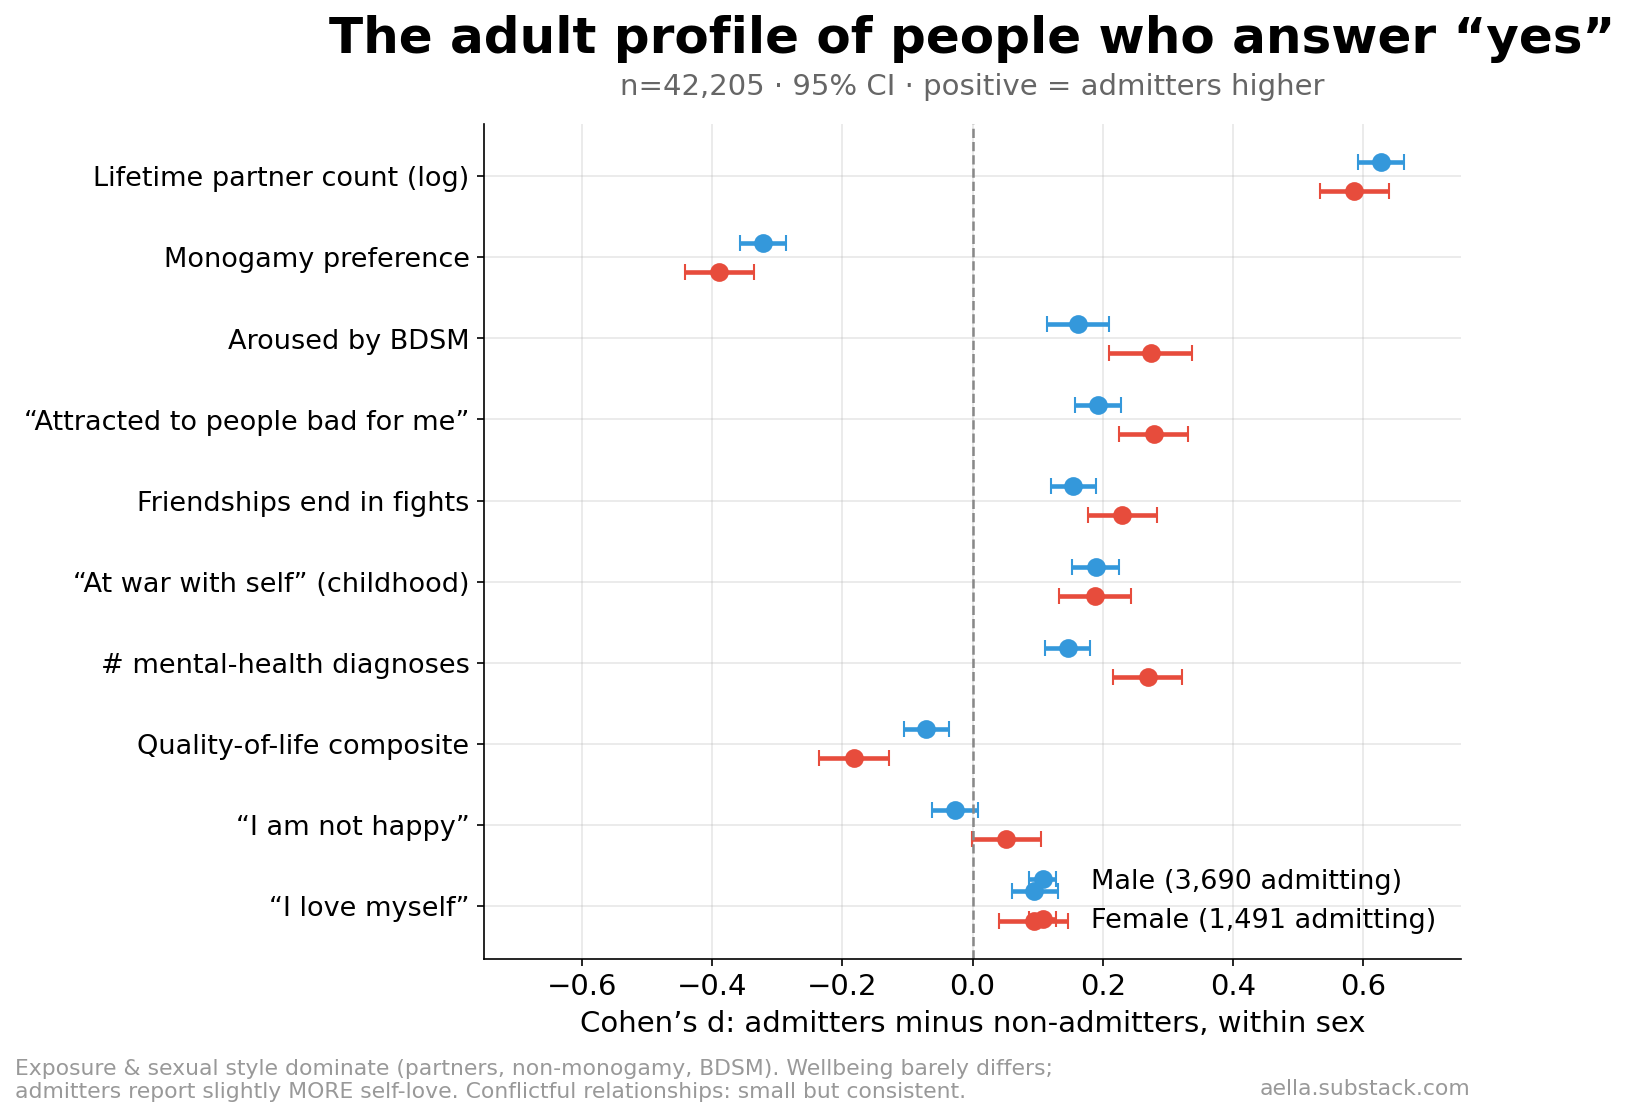
Comparing admitters to non-admitters within sex (Cohen's d, 95% CI):
- Exposure and sexual style dominate. Lifetime partner count is by far the largest difference (d ≈ 0.6 both sexes; medians 8 vs 3 for men, 5 vs 1 for women), with a clean dose-response: admission runs 4.5% → 27.6% across male partner-count bins (0 → 31+) and 4.6% → 19.4% in women. Admitters also prefer non-monogamy (d ≈ −0.32/−0.39) and report more BDSM arousal — a gradient from 10.7% to 16.3% across arousal levels in men and 5.1% to 11.1% in women. (No sadism-specific or non-consent-specific arousal item exists in this survey; BDSM arousal 0–3 is the closest available.)
- Conflictual-relationship signature, small but consistent in both sexes: "the people I'm attracted to tend to be bad for me" (d ≈ 0.19/0.28), friendships ending in fights (0.16/0.23), having felt "at war with yourself in trying to be a good person" in childhood (0.19/0.19 — the survey has no adult version of this item).
- Wellbeing barely differs. QoL composite d ≈ −0.07 (men) / −0.18 (women); "I am not happy" ≈ 0. And admitters report slightly more self-love (d ≈ +0.09 both sexes). Whatever shame the admission carries, it is not visible as global distress or self-loathing — these are not, on average, people quietly destroyed by what they're reporting.
- Diagnoses: mental-health diagnosis count is mildly elevated (d 0.15 men / 0.27 women). Self-reported sociopathy diagnosis, while rare, more than doubles: 2.0% vs 0.9% of men, 3.2% vs 1.1% of women.
Direction warning. These are cross-sectional correlates, and the partner-count link surely runs through opportunity (more encounters = more chances for one to be unwanted) as much as through disposition. Nothing here should be read as "BDSM or non-monogamy causes perpetration"; admitters are people with much more sexual history, and their kink/structure preferences travel with that.
BASE-RATE HONESTYTaking the female numbers seriously
The arithmetic worth sitting with: men admit at 1.76× the female rate overall, 2.0× at "slightly," and at "extremely" the ratio inverts to 0.77×. Compare that to the gaps everyone knows: in this same sample women report childhood sexual abuse at 2.0× the male rate (40.9% vs 20.5%), and criminal-justice statistics put male-to-female ratios for sexual offending at roughly 10–50×. Self-reported perpetration shows the smallest sex gap of any measure of this behavior we're aware of.
Three readings, not mutually exclusive: (1) the broad wording sweeps in mild boundary-pushing that women do at near-male rates, while the rarer severe acts that dominate crime statistics stay male — but note the severe tail here is not male-dominated; (2) male perpetration is more often reported by victims, prosecuted, and remembered as serious, so official ratios overstate the behavioral asymmetry; (3) men under-admit more than women at the severe end. An anonymous survey cannot fully separate these, but it can bound them: female-perpetrated unwanted sex is, at minimum, common enough that one in twelve women acknowledges it when asked plainly.
On the floor itself: all of these numbers are floors. This is an anonymous survey with nothing to gain from admission, which is the best case available — but social desirability does not vanish in anonymity. Two internal checks are mildly reassuring about the comparisons (not the levels): admission is essentially identical between respondents who rate their own survey-honesty 2 vs 3 (men 14.2% vs 15.0%; women 8.7% vs 8.2%), and the age pattern behaves like real exposure rather than shifting candor. If under-reporting is roughly proportional across groups, the ratios and odds ratios above survive; the absolute percentages should all be read as "at least."
CAVEATSHow to read this
The question is broad. "A sexual experience with someone who did not want it" spans miscommunication-adjacent events to assault, weighted by the respondent's own perception and severity judgment. The 0–3 levels are not validated categories. Most "yes" is "yes, slightly."
Retrospective childhood recall. Abuse, discipline, and household measures are adult memories of childhood, with all the bias that implies; the SA-dimension items are additionally conditional on choosing to disclose at the gate question.
Self-selected, very-online sample — young, left-leaning, kink-tolerant, heavily male. Absolute rates (of admission and of childhood SA) should not be projected onto the population; internal comparisons are the robust part.
Cross-sectional. The "cycle" finding is an association between two retrospective reports, not a demonstrated causal path; no claim about individual prediction is licensed by a pseudo-R² of 0.05.