Replication Report
Around 200 well-established findings from the academic literature, checked against the Big Kink Survey. A living document — more get added over time. Last updated 2026-08-15 (second full audit: all “survey question” toggles regenerated verbatim from the survey source; analytic and consistency corrections across ~60 cards).
Caveats that apply throughout: (1) These are correlations, not causal tests. (2) The weighted sample is ages 14–34, mostly Western — a few age/lifespan findings instead use the full unweighted sample (ages 14–75), marked full sample. (3) Mental-health conditions are self-reported presence, not clinical diagnoses — the survey asks "Do you have any of the following" and to "only check if they're moderate to severe." So "report X" throughout means self-identification, which carries its own biases (e.g. willingness to self-label) and isn't the same as a clinician's diagnosis. (4) Several literature findings concern behavior or clinical groups, while BKS often measures self-rated interest — close, not identical. (5) Menstrual/PMS/contraception items are women only; partner-count and IQ analyses are limited to respondents who answered those items. (6) Partner counts are capped at 50, and are age-adjusted (residualized on age) wherever lifetime accumulation would otherwise confound the result — marked age-adjusted. (7) “Tested IQ” is self-reported. Respondents were asked “Have you had an officially administered IQ test?”; only those who answered Yes saw a follow-up, “Your officially tested IQ result is:” (free number entry), and that self-entered number is the IQ used throughout (cleaned to 70–170). Nobody was tested by us. (8) Where a relationship could be masked or confounded by sex, we checked the within-sex slopes; unless a card says otherwise, the sex-split picture matches the pooled one. (9) Kink sub-items are shown only to respondents who endorsed the parent category; non-endorsers are counted as 0 (“no interest”) by design — cards note where this gating materially shapes a correlation.
On statistical inference: these are roughly 200 pre-specified findings drawn from the literature, not a data-dredged search, and no multiple-comparisons correction is applied. At these sample sizes statistical significance is uninformative — almost everything is "significant" — so findings are screened on effect size and its 95% CI, not p-values. Cards resting on smaller samples (flagged with their n per card) should be read as more exploratory, since an effect-size screen still admits noise at low n.
On effect sizes: the effect sizes reported here are raw bivariate values; the companion BKS findings explorer has been updated (fix-pass 2.1) to headline the same raw values, with covariate-adjusted values shown separately. Survey items: where the question is confidently identified, each card now has a “Survey question(s) asked” toggle showing the exact wording and response scale, so you can judge the construct yourself.
Scorecard
Childhood, trauma & abuse
1. Childhood adversity → adult mental illness Replicates
The claim: Cumulative childhood adversity (the ACE dose-response) predicts more adult mental-health problems.
Best: Felitti et al. (1998), Am. J. Preventive Medicine — the ACE Study. link
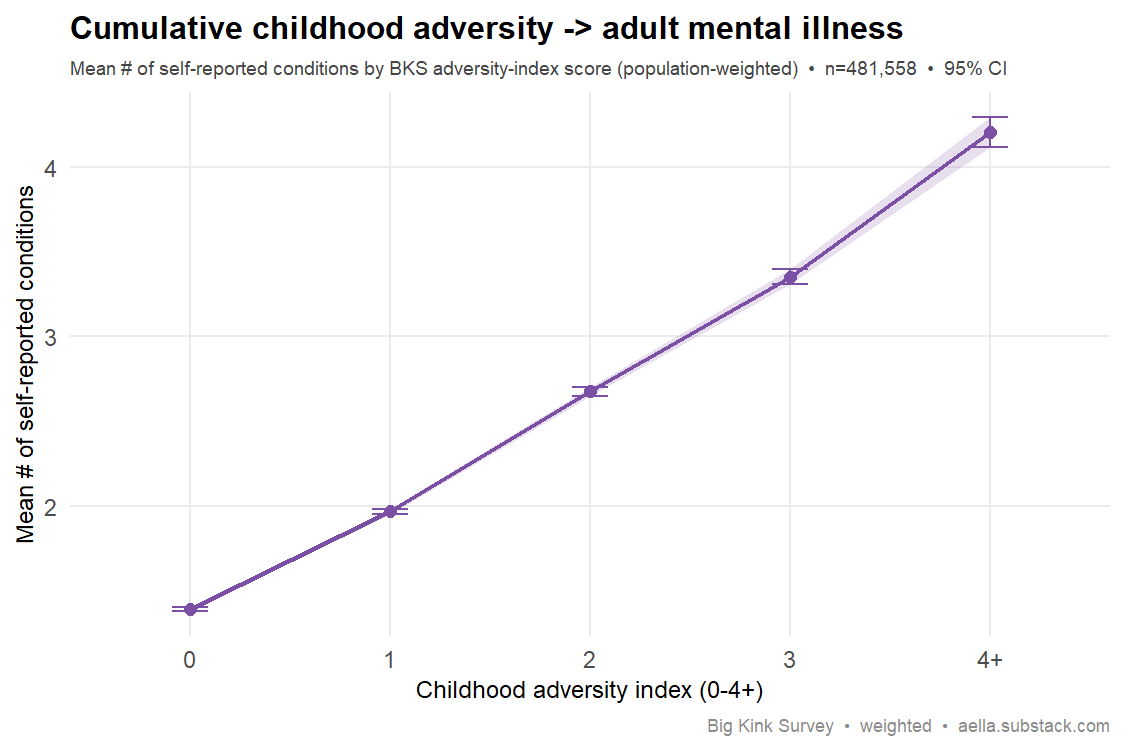
Your data: Clean dose-response — the mean # of self-reported conditions climbs 1.4 → 2.0 → 2.7 → 3.4 → 4.2 from 0 to 4+ adversities. Note the index is BKS-specific (childhood sexual assault, absent father, absent mother, frequent spanking, repressive upbringing), not the Felitti ACE items — the replication target is the dose-response shape, and that shape is textbook.
Survey question(s) asked
- “Did you experience sexual assault in your childhood?” — No / Yes, mild / Yes, moderate / Yes, severe
- “Which best describes your parents' presence in your lives?” — Both mother and father present / Mother present, father absent / Father present, mother absent / Both mother and father absent
- “From the ages of 0-14, how often were you spanked as a form of discipline?” (tip: spanking means striking the buttocks, with a hand or an implement such as a shoe or belt) — Never / Rarely / Sometimes / Often / Very regularly
- “How "sexually liberated" was your upbringing?” — Highly repressed / Moderately repressed / Slightly repressed / Equally repressed/liberated / Slightly liberated / Moderately liberated / Highly liberated
- “Do you have any of the following” (checkbox; tip: “Please only check if they're 'moderate to severe'”) — 19 conditions (ADHD, Anorexia, Anxiety, Autism, Bipolar I/II, Body Dysmorphia, Borderline, Bulimia, C-PTSD, Depersonalization/derealization, Depression, Disassociative Identity Disorder, OCD, PTSD, Schizophrenia, Social anxiety, Sociopathy, Substance Abuse Disorder)
- The adversity index counts how many of five things apply (0–4+): any childhood sexual assault, father absent, mother absent, spanked “Often” or more, and a “Moderately” or “Highly repressed” upbringing. It is a study-specific composite, not the Felitti ACE checklist.
- The outcome is the number of conditions checked on the mental-health checklist — self-reported, not clinical diagnoses.
2. Childhood sexual abuse → BPD & PTSD Replicates
The claim: Childhood sexual abuse predicts borderline personality disorder, PTSD and complex PTSD in adulthood.
Best: Porter et al. (2020), Acta Psychiatrica Scandinavica (meta-analysis). link · Backup: McLean & Gallop (2003), Am. J. Psychiatry. link
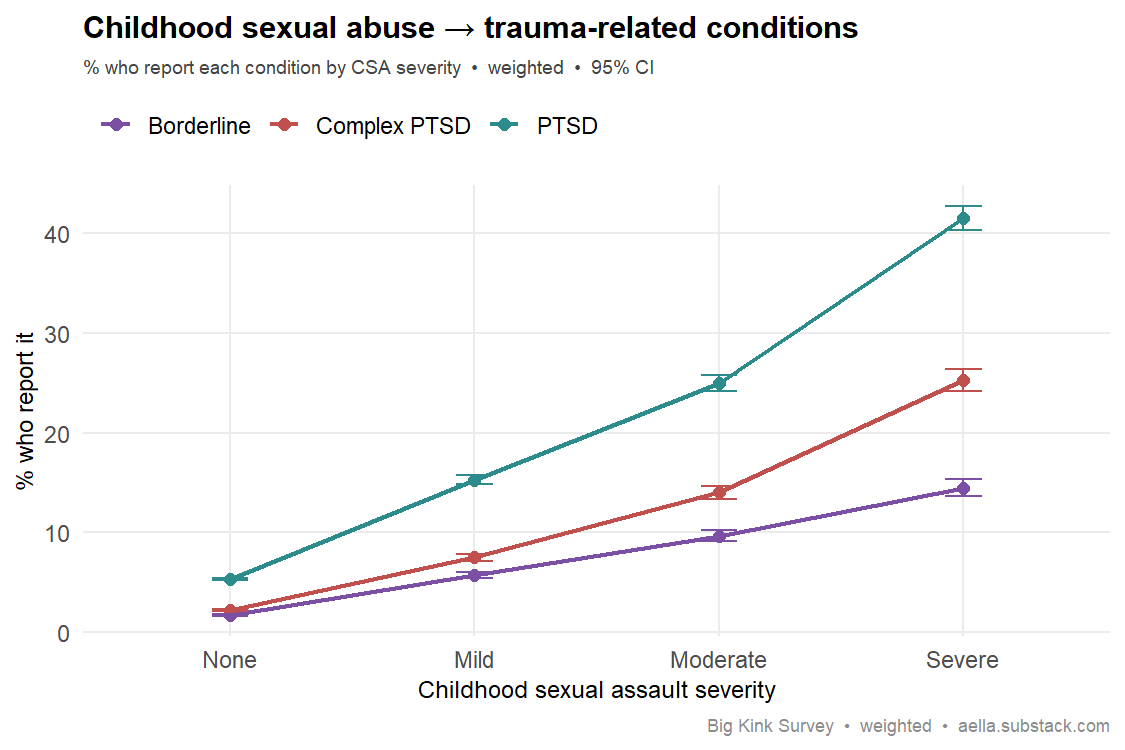
Your data: Strong dose-response. Borderline PD rises 1.7% → 14.4% from no abuse to severe; PTSD and complex PTSD climb in parallel.
Survey question(s) asked
- “Did you experience sexual assault in your childhood?” — No / Yes, mild / Yes, moderate / Yes, severe
- “Do you have any of the following” (checkbox; tip: “Please only check if they're 'moderate to severe'”) — “Borderline”, “PTSD”, and “C-PTSD” each checked vs not
- These are self-reported conditions from a checklist, not verified clinical diagnoses.
3. Childhood abuse → adult revictimization Replicates
The claim: Childhood sexual abuse predicts adult sexual revictimization.
Best: Roodman & Clum (2001), Clinical Psychology Review (meta-analysis). link
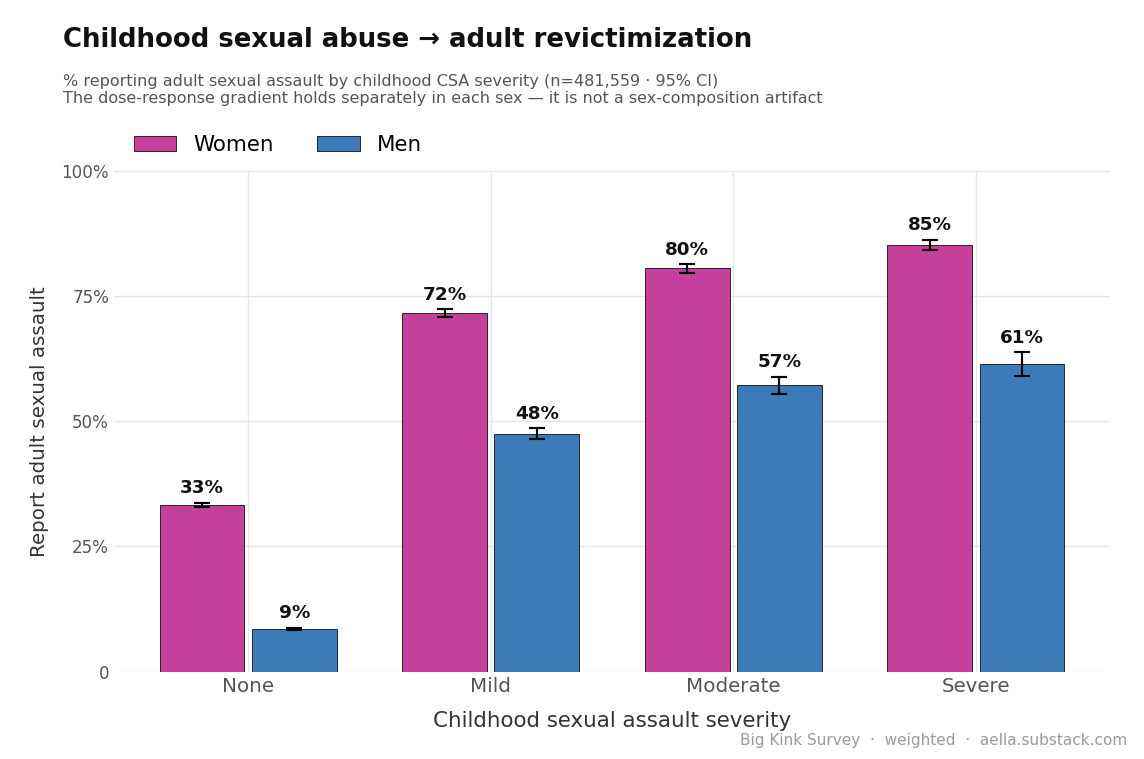
Your data: The share reporting adult sexual assault climbs steeply with childhood CSA severity: 19% → 64% → 75% → 79%. Strong dose-response revictimization gradient. Split by sex (chart): the gradient is just as steep inside each sex — women 33% → 72% → 80% → 85%, men 9% → 48% → 57% → 61% — so it is not a sex-composition artifact, even though women report both childhood and adult assault far more often than men do.
Survey question(s) asked
- “Did you experience sexual assault in your childhood?” — No / Yes, mild / Yes, moderate / Yes, severe
- “As an adult, have you been the victim of sexual assault?” (tip: sexual assault means unwanted physical sexual contact from someone else, such as groping or rape) — No / Yes, mild / Yes, moderate / Yes, severe
- The chart shows the share answering anything other than “No” to the adult item (mild or worse).
4. Childhood maltreatment → insecure attachment Replicates
The claim: Childhood abuse/neglect predicts insecure adult attachment.
Best: Baer & Martinez (2006), “Child maltreatment and insecure attachment: a meta-analysis,” J. Reproductive & Infant Psychology 24(3):187–197 (meta-analysis of 8 studies; maltreated children show markedly elevated insecure/disorganized attachment). link
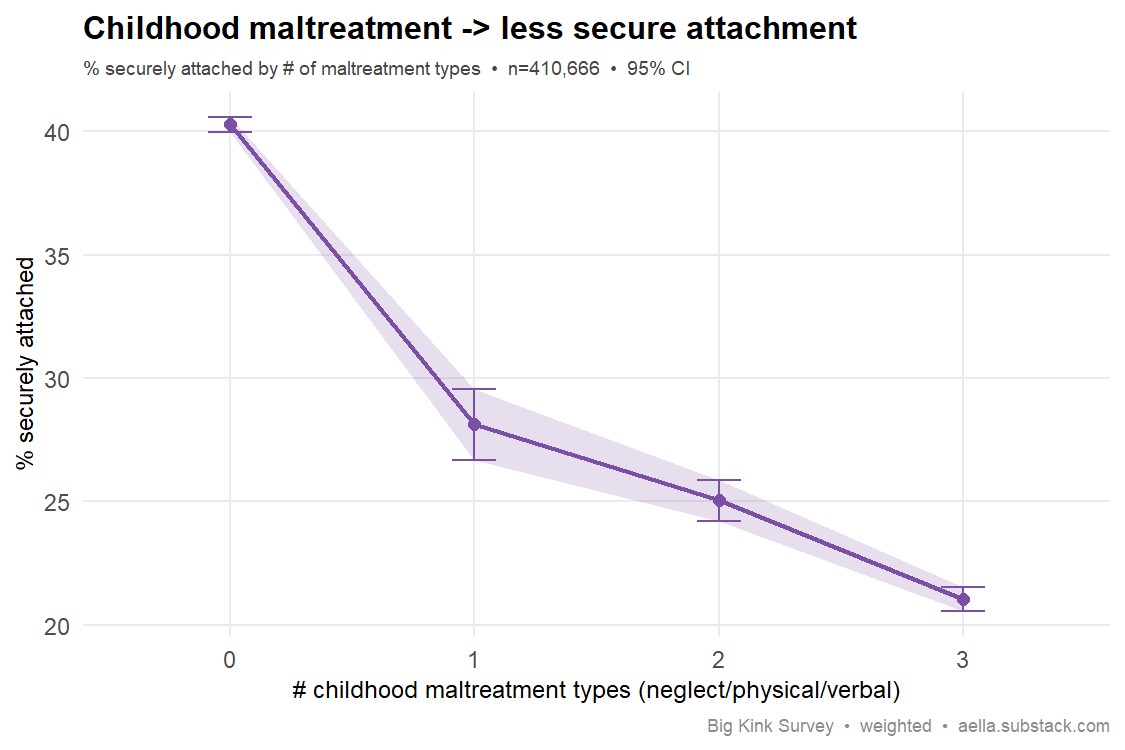
Your data: The share securely attached falls from 40% (no maltreatment) to 21% (3 types). Clear replication. (Maltreatment types built from neglect/physical/verbal items; absence treated as "not endorsed.")
Survey question(s) asked
- “Were you (at least semiregularly) abused as a child?” (tip: “abuse” means cruel treatment, such as significant neglect, insulting, or causing physical damage — does not include spanking) — No / Yes
- If Yes, five follow-ups: “During your childhood, how often were you neglected?”, “…verbally abused by an adult man?”, “…verbally abused by an adult woman?”, “…physically abused by a man?”, “…physically abused by a woman?” — each Never / Rarely / Sometimes / Often / Very regularly
- “What's your attachment style?” — Don't know/not sure / Avoidant / Anxious / Disorganized / Secure (single self-label item; “Don't know” excluded)
- Maltreatment types = how many of neglect / physical abuse (by man or woman) / verbal abuse (by man or woman) were rated above “Never” (0–3). The follow-ups were only shown to respondents who answered Yes to the gate question; those who answered No are counted as 0 types.
5. Sexual assault → PTSD Replicates
The claim: Sexual assault is among the strongest predictors of PTSD.
Best: Kessler et al. (1995), Archives of General Psychiatry (National Comorbidity Survey). link
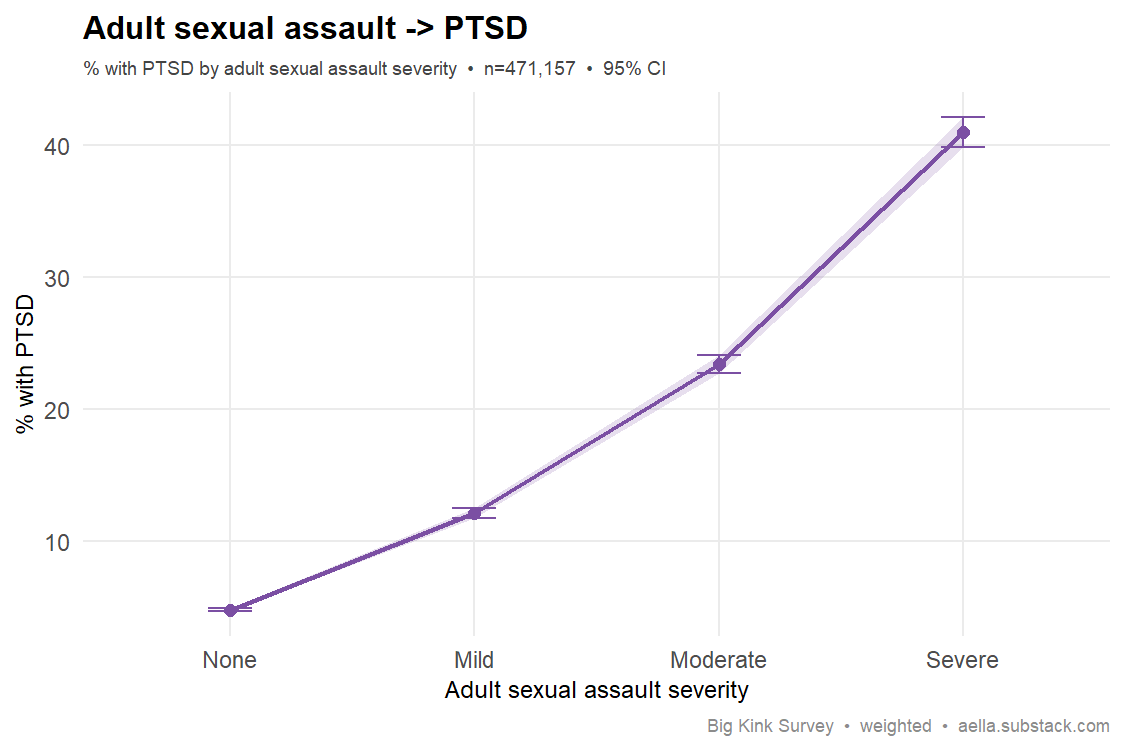
Your data: PTSD prevalence rises 5% → 12% → 23% → 41% across adult sexual-assault severity — a steep dose-response, exactly the expected pattern.
Survey question(s) asked
- “As an adult, have you been the victim of sexual assault?” (tip: sexual assault means unwanted physical sexual contact from someone else, such as groping or rape) — No / Yes, mild / Yes, moderate / Yes, severe
- “Do you have any of the following” (checkbox; tip: “Please only check if they're 'moderate to severe'”) — “PTSD” checked vs not
- PTSD is self-reported from a checklist, not a verified clinical diagnosis.
6. Childhood sexual abuse → nonconsent fantasy Supported · contested
The claim: Childhood sexual abuse is associated with later interest in nonconsent / sadomasochistic fantasy. Mixed evidence in the literature.
Best: Gewirtz-Meydan, Godbout, Canivet, Peleg-Sagy & Lafortune (2024), J. Sex & Marital Therapy 50(5):583–594. link · Backup: Brown, Barker & Rahman (2020), J. Sex Research 57(6):781–811. link
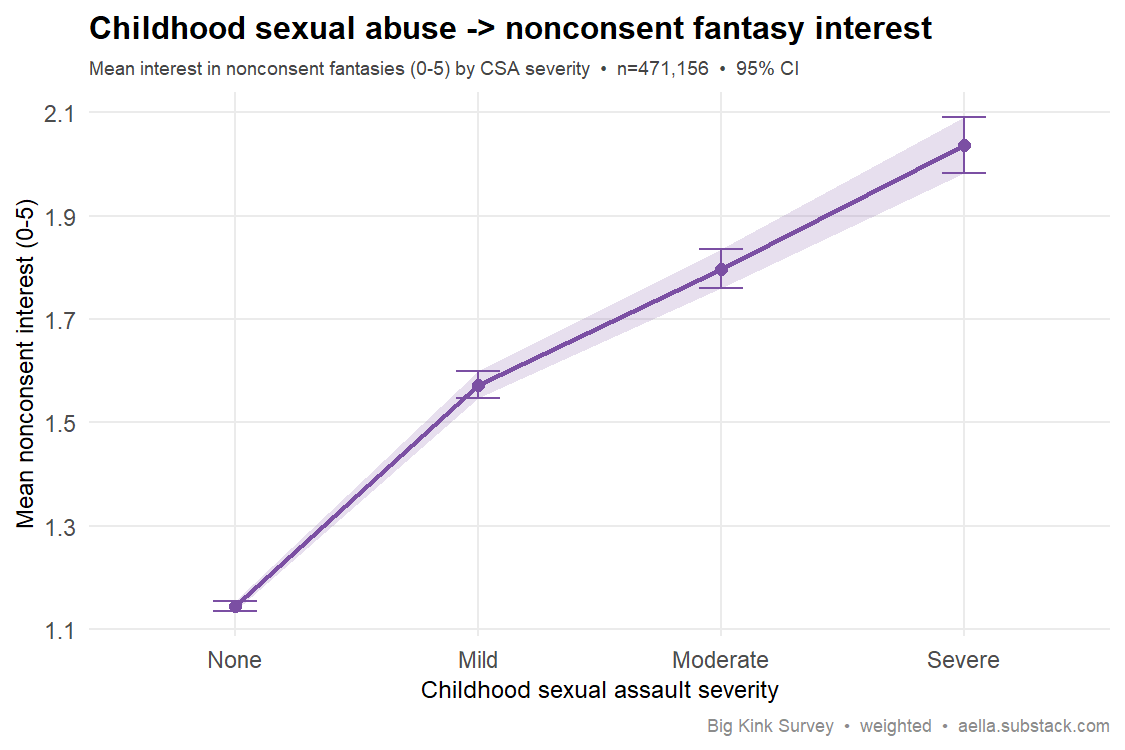
Your data: Nonconsent-fantasy interest rises 1.14 → 2.04 with CSA severity — a clear positive gradient, supporting the contested claim in this sample. Interpret cautiously.
Survey question(s) asked
- “Did you experience sexual assault in your childhood?” — No / Yes, mild / Yes, moderate / Yes, severe
- “I find sexual scenarios involving nonconsent to be:” (tip: if only one specific type of nonconsent scenario is erotic — e.g. rapeplay, body control, kidnapping — answer with just that in mind, not the whole category) — Not arousing / Slightly arousing / Somewhat arousing / Moderately arousing / Very arousing / Extremely arousing
- The arousal item was shown only to respondents who checked “Nonconsent (rapeplay, body control, kidnapping, etc.)” on the screener “Check all the following categories that contain a thing that arouses you”; respondents who didn't check the category are counted as 0 (“Not arousing”).
- Raw survey codes {0, 1, 2, 3, 5, 8} are stored as an ordinal 0–5 scale in the cleaned data.
7. Childhood spanking → adult spanking interest Supported · contested
The claim: Being spanked as a child predicts adult erotic interest in spanking ("sexual imprinting"). Note: this is debated and weakly supported in the literature.
Best: No solid source links ordinary childhood spanking to adult spanking interest; the broader "early experience → BDSM interest" idea is contested. For an illustrative review see De Neef et al. (2019), Sexual Medicine — which finds higher self-reported childhood sexual abuse (not ordinary spanking) among BDSM practitioners but states the literature "does not prove a causal relationship." link
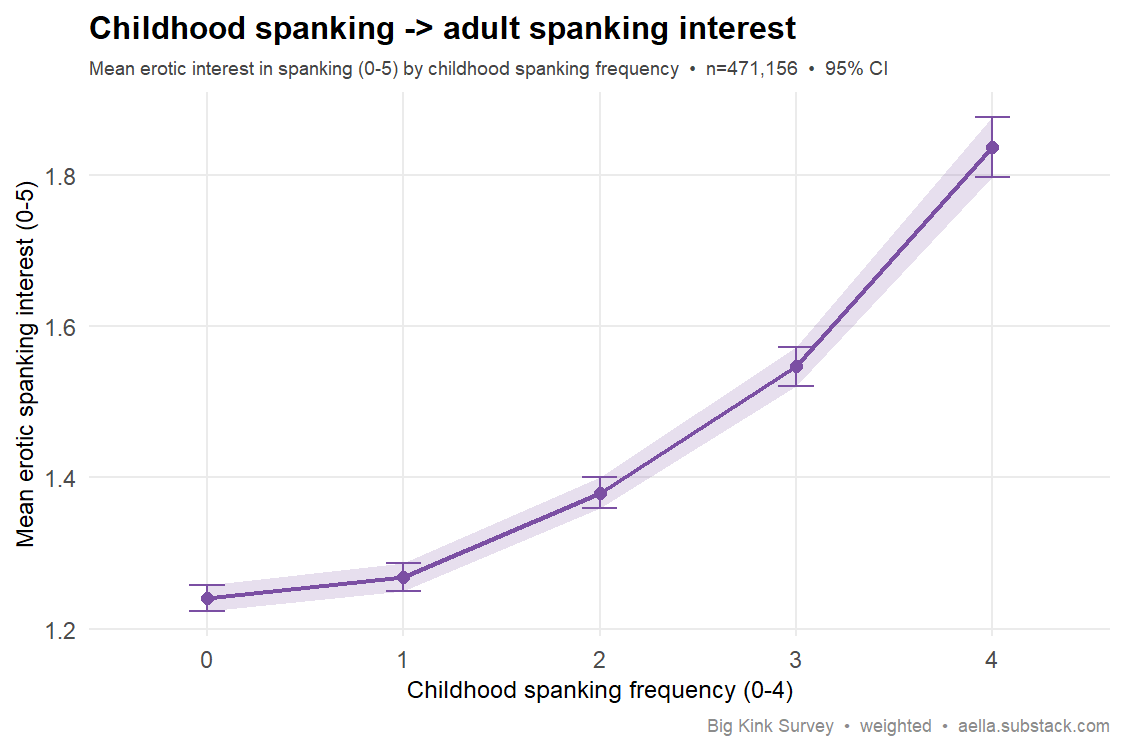
Your data: A real dose-response — erotic spanking interest rises 1.24 → 1.84 with childhood spanking frequency. Small effect, but consistent; your large N detects what small studies miss. Causality is unestablished.
Survey question(s) asked
- “From the ages of 0-14, how often were you spanked as a form of discipline?” (tip: spanking means striking the buttocks, with a hand or an implement such as a shoe or belt) — Never / Rarely / Sometimes / Often / Very regularly
- “I find spanking to be” — Not arousing / Slightly arousing / Somewhat arousing / Moderately arousing / Very arousing / Extremely arousing
- The erotic-spanking item was asked within the sadomasochism section, shown only to respondents who checked “Sadomasochism (spanking, needle play, clamps, torture, etc.)” on the screener “Check all the following categories that contain a thing that arouses you”; non-checkers are counted as 0 (“Not arousing”).
- Raw survey codes {0, 1, 2, 3, 5, 8} are stored as an ordinal 0–5 scale in the cleaned data.
Family, birth order & development
8. Father absence → earlier sexual debut Replicates
The claim: Father absence in childhood predicts earlier first sex (life-history theory).
Best: Ellis et al. (2003), Child Development. link · Backup: Belsky, Steinberg & Draper (1991). link
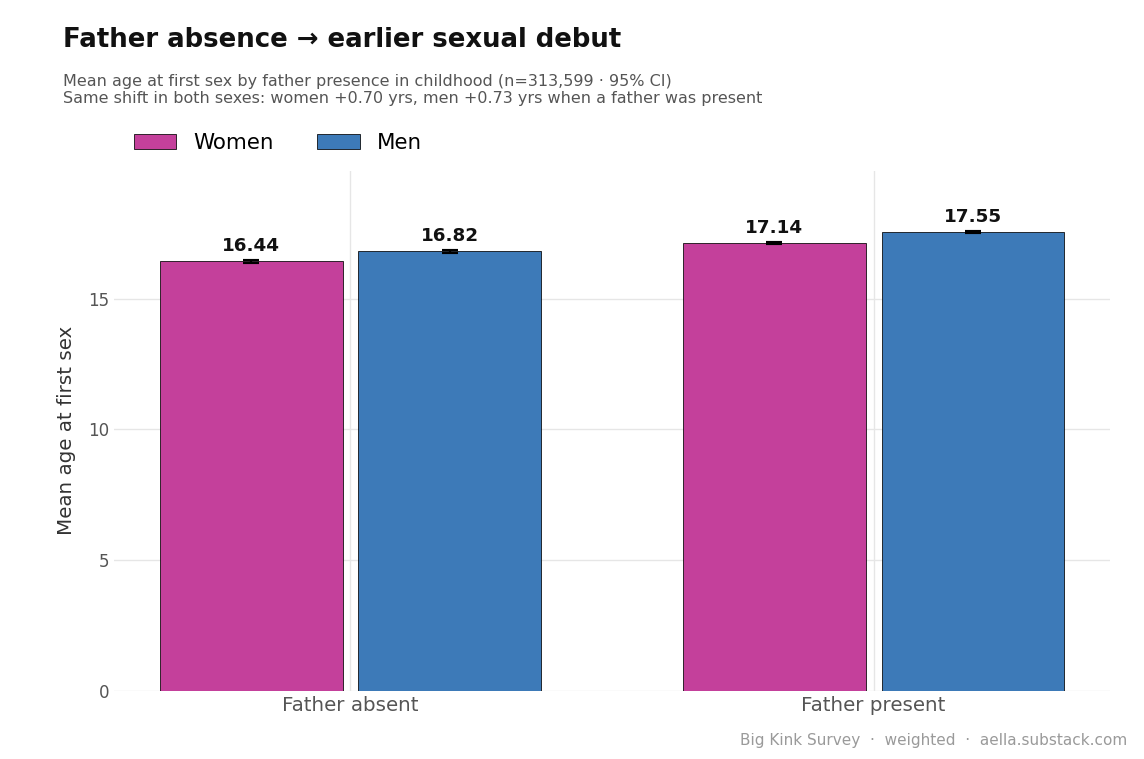
Your data: Father-absent respondents report first sex ~0.75 years earlier (16.6 vs 17.4). Direction and modest size match the literature. Split by sex (chart): the same shift shows up in both — women 16.44 vs 17.14, men 16.82 vs 17.55 — so it is not a sex-composition artifact. Note the y-axis starts at zero: 0.7 years is a real but small difference.
Survey question(s) asked
- “Which best describes your parents' presence in your lives?” — Both mother and father present / Mother present, father absent / Father present, mother absent / Both mother and father absent
- “At what age did you first have penetrative sexual intercourse?” — I haven't had sex / 12 or younger / single years 13–25 / 26-30 / 31-35 / 36-40 / 41+
- “Father present” vs “absent” is derived from the two father-present vs two father-absent options. Debut age is categorical: the binned options are coded at representative values (12 or younger = 11, 26-30 = 28, 31-35 = 34, 36-40 = 38, 41+ = 45), and “I haven't had sex” respondents are excluded.
- The item measures overall parental presence “in your lives”, so it can't distinguish early- vs late-childhood father absence.
9. More siblings → lower IQ Replicates
The claim: Larger sibship size predicts lower IQ (resource dilution).
Best: Downey (2001), American Psychologist. link
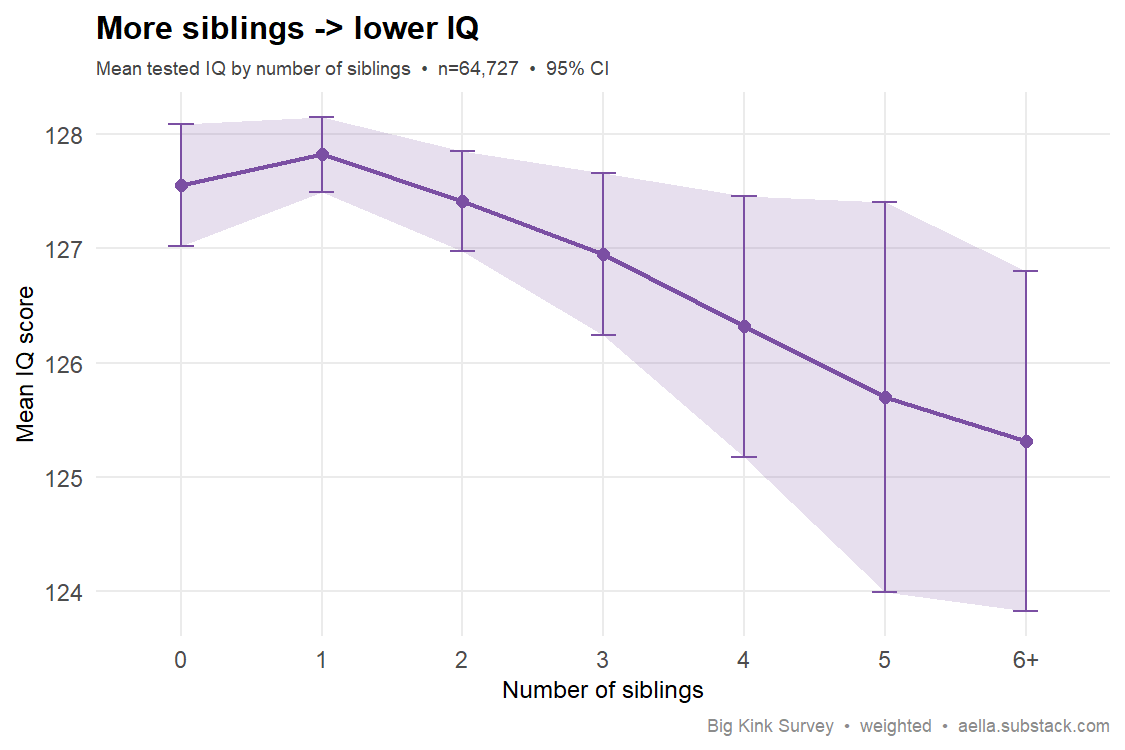
Your data: Mean IQ declines monotonically from 127.6 (only child) to 125.3 (6+ siblings). Small but consistent dilution gradient. (Self-reported IQ; absolute level inflated by self-selection, but the slope is what matters.)
Survey question(s) asked
- “How many siblings did you grow up with?” — 0 / 1 / 2 / 3 / 4 / 5 / 6 / 7+
- “Have you had an officially administered IQ test?” — No / No, but have done a high-quality online test on my own / Yes
- “Your officially tested IQ result is:” — free number entry
- The IQ score is used only from respondents who answered “Yes” (officially tested); entries outside 70–170 are discarded. Self-reported test results, not administered tests — hence the inflated absolute level the card notes.
10. Does birth order shape personality? Tiny, but not zero
The claim: The modern consensus is that birth order has essentially no causal effect on personality — overturning Sulloway's popular claim that later-borns are more open/rebellious.
Best: Rohrer, Egloff & Schmukle (2015), PNAS (~20k adults, null). link · Backup: Damian & Roberts (2015), PNAS. link
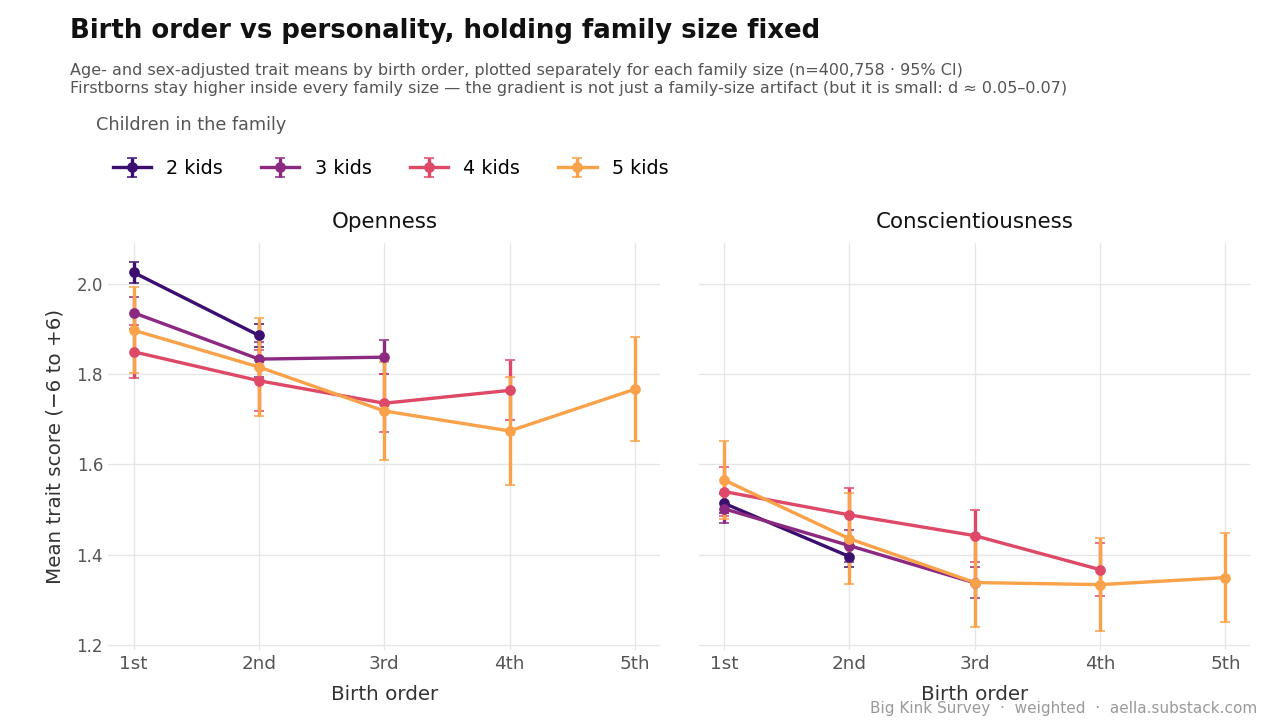
Your data: Pooled, later-borns look lower in openness (2.0 → 1.6) and conscientiousness — and the obvious suspect is the between-family confound: later-borns come from larger families, and #9 showed more siblings → lower IQ. But that is checkable, so we checked it. Holding family size fixed (chart — 2-, 3-, 4- and 5-child families plotted separately, adjusted for age and sex) the gradient is still there: firstborns beat their later-born counterparts by 0.09–0.15 points on both traits in every family size. So it is not purely a family-size artifact — but it is tiny (d ≈ 0.05–0.07, i.e. ~2% of a standard deviation per birth position), which is roughly what "essentially no effect" looks like in a million-person sample. Two limits: this is still a between-family comparison of different people, not Rohrer's within-family design (siblings compared against each other), which is what licenses a causal reading; and the one effect Rohrer did find within families was on self-reported intellect — which is exactly what our "openness" proxy is built from ("I have excellent ideas" / "difficulty understanding abstract ideas"). The direction still contradicts Sulloway, who predicted later-borns would be more open.
Survey question(s) asked
- “You were the ___ child among your siblings” — Firstborn / Secondborn / … / Seventhborn or more
- “I have excellent ideas” and “I have difficulty understanding abstract ideas” — Totally agree (+3) … Totally disagree (−3), 7-point
- “I like order” and “I shirk my duties” — Totally agree (+3) … Totally disagree (−3), 7-point
- Openness = “I have excellent ideas” minus “I have difficulty understanding abstract ideas”; Conscientiousness = “I like order” minus “I shirk my duties” (each −6 to +6). These are 2-item proxies, not full Big Five inventories.
- Birth order was asked only of respondents with at least one sibling; only-children are coded Firstborn in the cleaned data — so they are excluded from the family-size chart, which uses the separate “how many siblings do you have?” item to define family size (siblings + 1).
11. Childhood social class → adult IQ Mixed
The claim: Higher childhood family SES predicts higher adult IQ.
Best: von Stumm & Plomin (2015), Intelligence 48:30-36, “Socioeconomic status and the growth of intelligence from infancy through adolescence” (TEDS, n=14,853 children) — higher family SES predicts a higher childhood IQ starting point and steeper gains. link
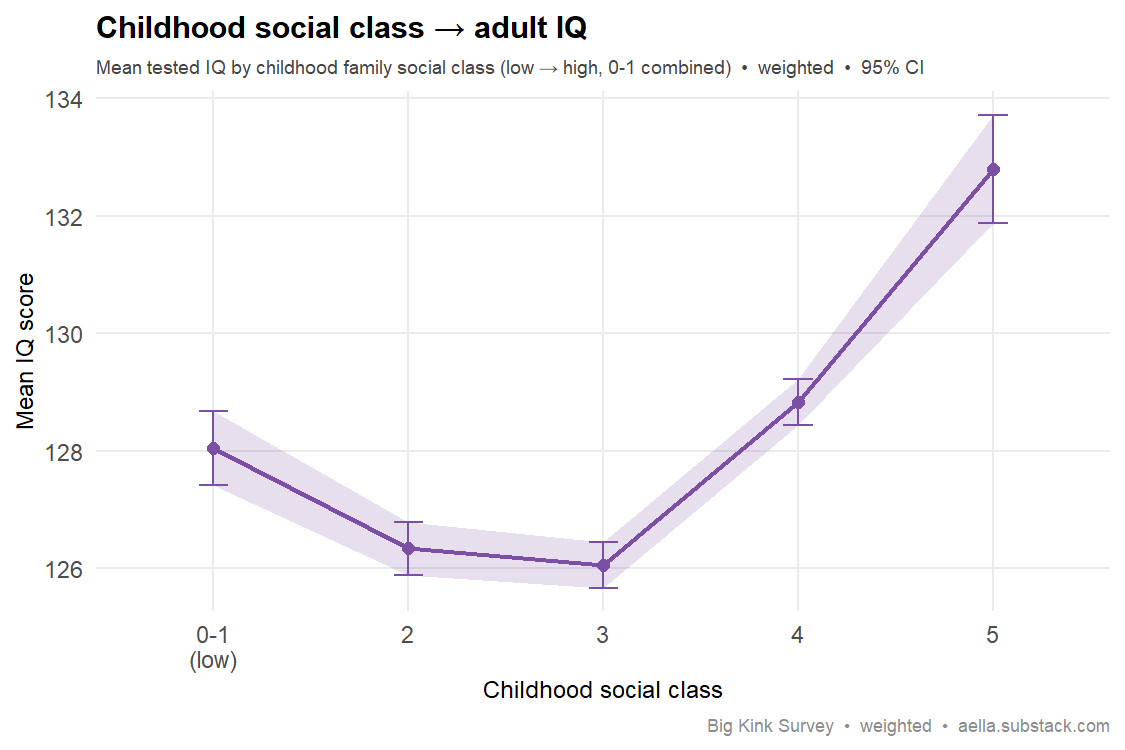
Your data: Not the clean positive line. IQ is U-shaped across social class — ≈128 at the bottom (classes 0–1 combined for stability), dipping to ≈126 in the middle, up to ≈133 at the top: highest at the top class but also high at the bottom. Likely driven by self-reported "tested IQ" (only ~65k, heavy self-selection) and a noisy class measure. Doesn't cleanly replicate here.
Survey question(s) asked
- “Growing up, your family was” (tip: compared to most of the people in your country) — Underclass (very poor) / Low class / Lower-middle class / Middle class / Upper-middle class / Upper class / Elite class (very rich)
- “Have you had an officially administered IQ test?” — No / No, but have done a high-quality online test on my own / Yes
- “Your officially tested IQ result is:” — free number entry
- “Elite class (very rich)” responses were dropped at data build as unreliable, so the top bin on the chart is Upper class (5); the bottom two classes are combined for stability. IQ is used only from respondents claiming an official test, cleaned to 70–170.
12. Fraternal birth order → male homosexuality Partial · confounded full sample
The claim: Each older brother raises a man's odds of homosexuality by ~33% (the fraternal birth order effect). The magnitude is actively contested.
Best: Blanchard (2018), Archives of Sexual Behavior (meta-analysis, 26 studies). link · Backup: Blanchard & Bogaert (1996), Am. J. Psychiatry. link
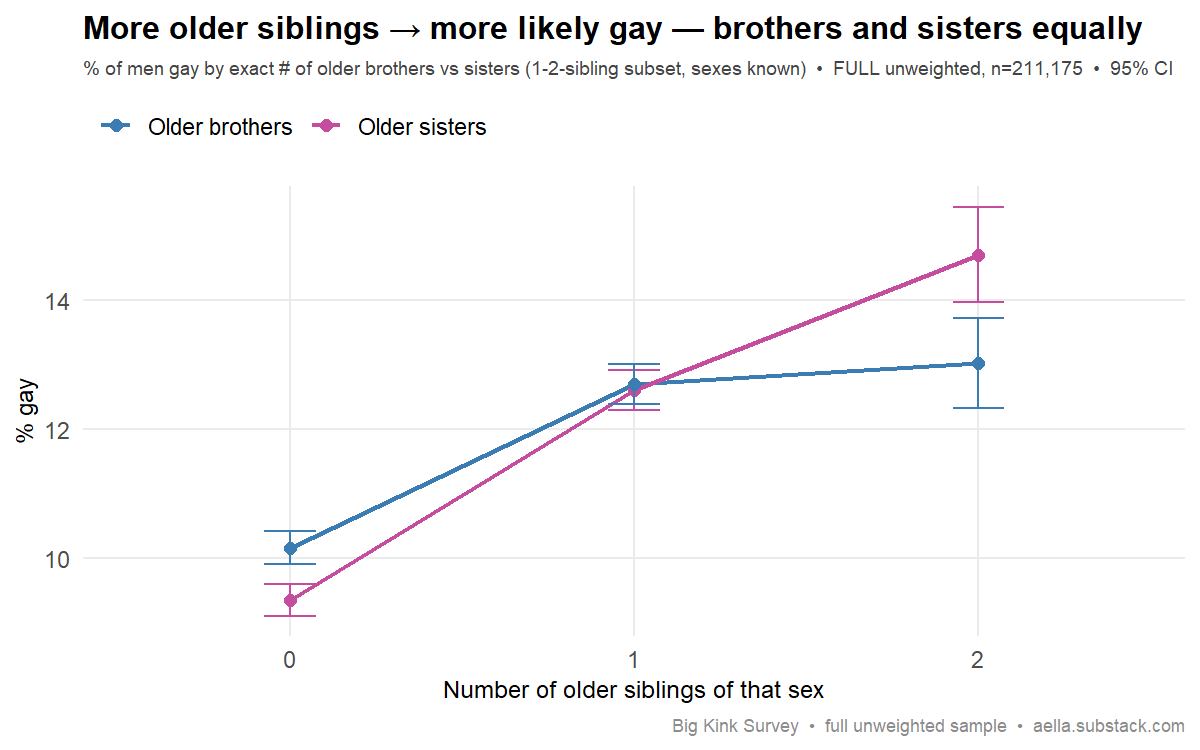
Your data: Partial — and instructive. For men with 1–2 siblings reported as "mostly" one sex, every sibling is that sex (a single sibling, or "mostly" of two, can only be 2–0), so birth position gives the exact count of older brothers or sisters (n=211k after dropping impossible birth-order combinations). Each older brother raises the odds of being gay (OR 1.24 per brother, p≈2e-65) — but so does each older sister, just as strongly (OR 1.28, p≈3e-83); head-to-head, an older brother is no more predictive than an older sister (OR 0.98, p=0.33). In this sample it reads as a general older-sibling / birth-order effect rather than the brother-specific FBOE — lining up with the family-size-confound critique. Limits: "gay" here is derived from attraction rather than identity, siblings are those you grew up with (so the same-mother biological pathway the maternal-immune hypothesis needs isn't strictly isolated), and the exact-count trick leans on literal readings of "mostly".
Survey question(s) asked
- “How many siblings did you grow up with?” — 0 / 1 / … / 6 / 7+
- “You were the ___ child among your siblings” — Firstborn / Secondborn / … / Seventhborn or more (asked only if siblings > 0)
- “Your siblings are mostly” — Male / Female / Equal mix
- “You're sexually attracted to people with___” — Penises, exclusively / mostly / slightly / Both equally / Vaginas, slightly / mostly / exclusively
- “You're more sexually attracted to people who appear visually” — Totally masculine … Totally feminine, 7-point
- “Gay” here is derived from these two attraction items relative to birth sex (their average scored toward the same sex) — not a self-identification question.
- Older-brother/sister counts are inferred by combining birth position with the “mostly” sibling-sex item; the exact-count analysis uses men whose 1–2 siblings are reported as “mostly” one sex (which pins down every sibling's sex). Siblings are “siblings you grew up with”, not necessarily biological same-mother siblings.
Sexual development & debut
13. Sexually repressive upbringing → later debut Replicates
The claim: Religious / sexually repressive upbringing predicts later sexual debut and fewer partners.
Best: Rostosky et al. (2004), J. Adolescent Research (review). link
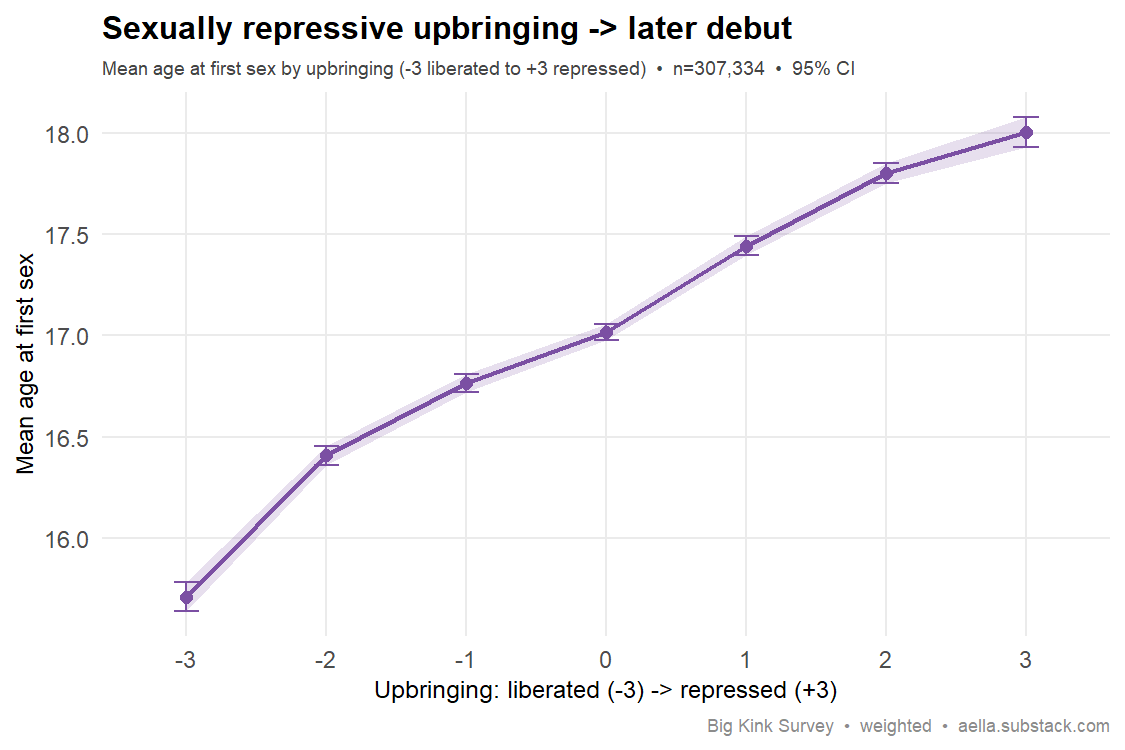
Your data: Strong monotonic gradient — first sex 15.7 (most liberated) → 18.0 (most repressed), a 2.3-year spread.
Survey question(s) asked
- “How "sexually liberated" was your upbringing?” (tip: “Highly repressed” might be a highly conservative religious community where ankles must be covered, and “Highly liberated” might be a community where free love, nudity, or sexual expression was encouraged) — Highly repressed (+3) / Moderately repressed / Slightly repressed / Equally repressed/liberated (0) / Slightly liberated / Moderately liberated / Highly liberated (−3)
- “At what age did you first have penetrative sexual intercourse?” — I haven't had sex / 12 or younger / single years 13–25 / 26-30 / 31-35 / 36-40 / 41+
- Debut age is categorical: binned options are coded at representative values (12 or younger = 11, 26-30 = 28, 31-35 = 34, 36-40 = 38, 41+ = 45), and “I haven't had sex” respondents are excluded.
14. Higher IQ → later sexual debut Weak (age-confounded)
The claim: More intelligent adolescents delay first sex ("smart teens don't have sex"). Causal status is contested.
Best: Halpern et al. (2000), J. Adolescent Health (Add Health). link
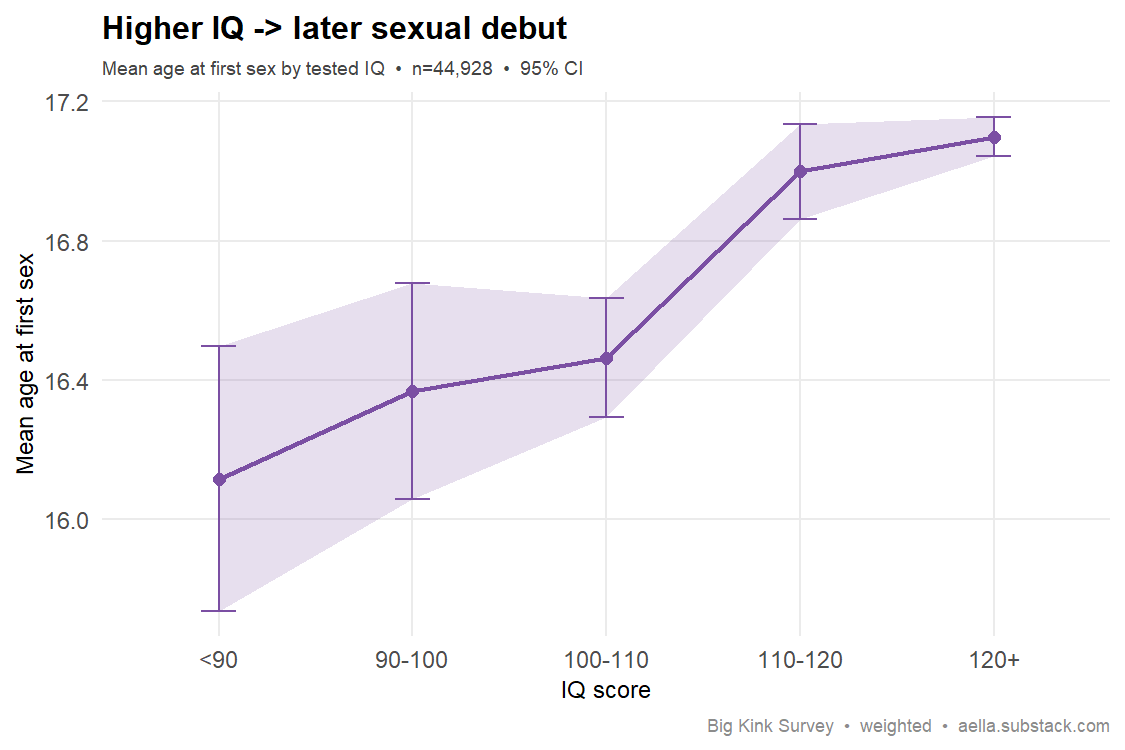
Your data: The raw pattern looks right — age at first sex rises about a year from low to high tested-IQ — but it is essentially an age artifact. Among adults the IQ↔debut-age rank correlation is +0.03 raw and −0.01 after age adjustment: within same-age people, IQ does not predict debut age. (IQ here is self-reported.) So the literature's IQ→later-debut link isn't really visible once age is handled. (Consistent in both sexes — age-adjusted ≈ 0 for each.)
Survey question(s) asked
- “Have you had an officially administered IQ test?” — No / No, but have done a high-quality online test on my own / Yes
- “Your officially tested IQ result is:” — free number entry
- “At what age did you first have penetrative sexual intercourse?” — I haven't had sex / 12 or younger / 13, 14, … 25 / 26-30 / 31-35 / 36-40 / 41+
- The IQ number is asked of, and counted only for, respondents who answered “Yes” to the officially-administered-test question (online-test scores are stored separately and not used here); values outside 70–170 are dropped. Debut-age bands are coded at representative ages (“12 or younger” = 11, 26-30 = 28, 31-35 = 34, 36-40 = 38, 41+ = 45), and “I haven't had sex” respondents are excluded.
15. Earlier porn exposure → earlier sexual debut Replicates
The claim: Earlier first exposure to pornography is associated with earlier sexual debut.
Best: Pathmendra et al. (2023), J Med Internet Res — systematic review. link · Backup: O'Hara et al. (2012), Psychological Science. link
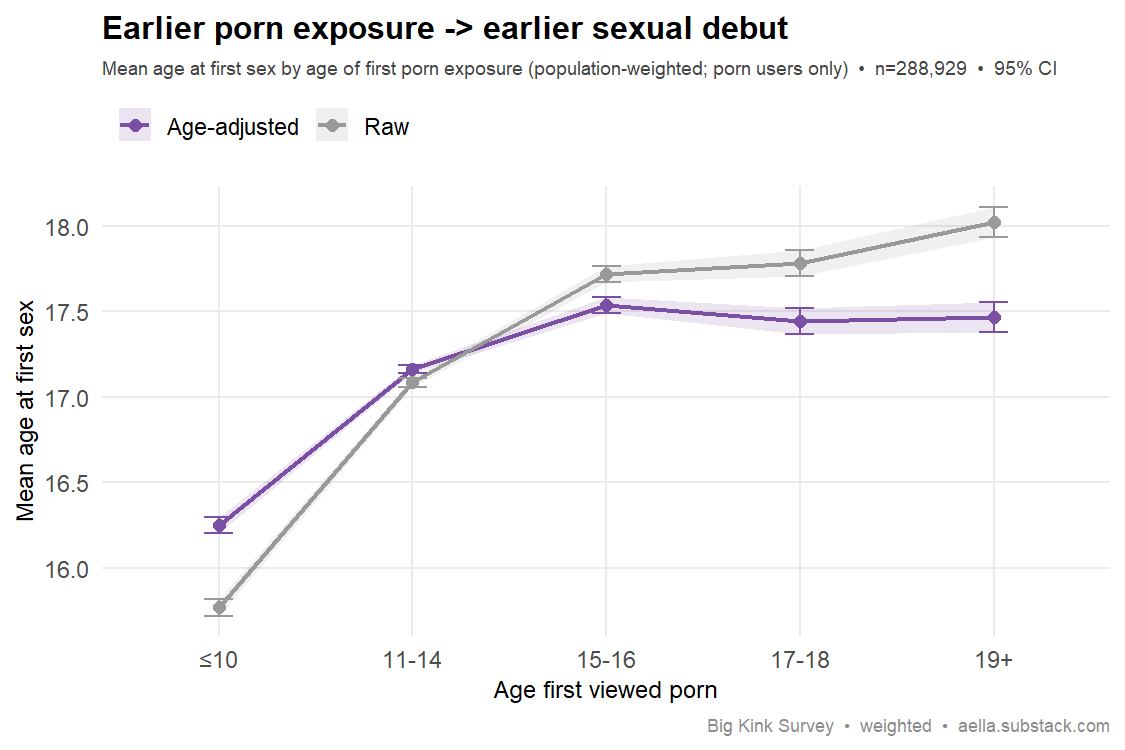
Your data: Replicates, concentrated at the early end. Both items are ages, so the raw gradient (15.8 → 18.0) partly tracks respondent age; controlling for it, those first exposed at ≤10 still debut about a year earlier than the 11–14 group (16.2 vs 17.2), while the curve above 15 goes flat (17.5 / 17.4 / 17.5) — that part of the raw gradient is an age artifact. Asked only of current porn users.
Survey question(s) asked
- “How often do you watch or read pornographic/erotic content?” (tip: “for the purposes of getting aroused”) — I don't / Multiple times a day / Daily / Multiple times a week / Once a week / A few times a month / Once a month / A few times a year / Once a year / Less than once a year
- “At what age did you begin watching porn or reading erotic content at least semiregularly?” — >6yo / 7-8yo / 9-10yo / 11-12yo / 13-14yo / 15-16yo / 17-18yo / 19-25yo / 26yo+
- “At what age did you first have penetrative sexual intercourse?” — I haven't had sex / 12 or younger / 13, 14, … 25 / 26-30 / 31-35 / 36-40 / 41+
- The porn-start question is only asked of respondents who report watching or reading porn at all (anything but “I don't” on the frequency question). Its bands are coded at rough midpoints (>6yo = 5, … 19-25yo = 22, 26yo+ = 28) and then binned for the chart; “I haven't had sex” respondents are excluded from the debut-age outcome.
16. Earlier masturbation → earlier first sex Replicates
The claim: Earlier first masturbation predicts earlier first intercourse (developmental cascade).
Best: see e.g. Bancroft, J. (Ed.) (2003), Sexual Development in Childhood (Indiana University Press) — in particular the chapter on masturbation as a developmental marker, which documents the typical sequencing of solitary before partnered sexual milestones. Cited illustratively; the volume describes developmental timing of masturbation and is not a single longitudinal test of masturbation onset predicting coital onset.
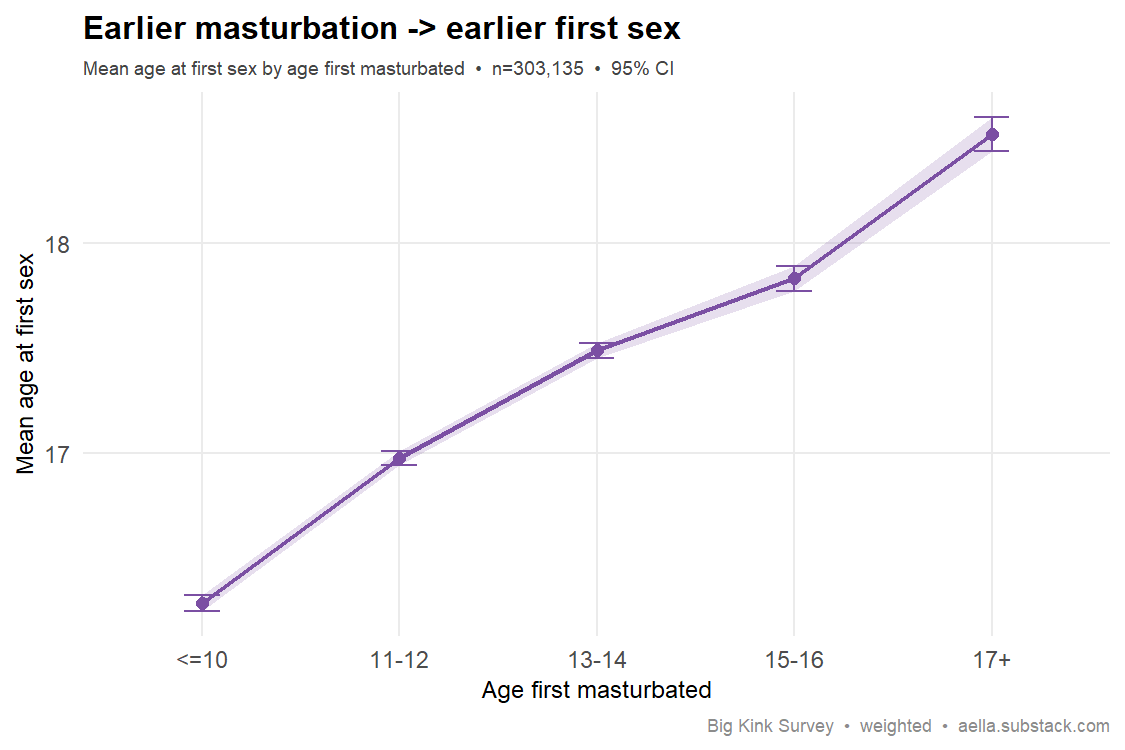
Your data: Age at first sex rises with age of first masturbation (16.3 for ≤10 → 18.5 for 17+) — earlier masturbation tracks earlier debut, as the milestone literature describes.
Survey question(s) asked
- “At what age did you first begin (at least semiregularly) masturbating?” — I've never masturbated / 5 or younger / 6, 7, … 17 / 18 or older
- “At what age did you first have penetrative sexual intercourse?” — I haven't had sex / 12 or younger / 13, 14, … 25 / 26-30 / 31-35 / 36-40 / 41+
- “I've never masturbated” and “I haven't had sex” respondents are excluded. Band endpoints are coded numerically (“5 or younger” = 4, “18 or older” = 19; “12 or younger” = 11, 41+ = 45) and masturbation age is binned for the chart.
Personality & sexuality
17. Extraversion → more sexual partners Replicates age-adjusted
The claim: Extraversion predicts more sexual partners.
Best: Allen & Walter (2018), Psychological Bulletin (meta-analysis, n≈420k). link · Backup: Schmitt (2004), Eur. J. Personality. link
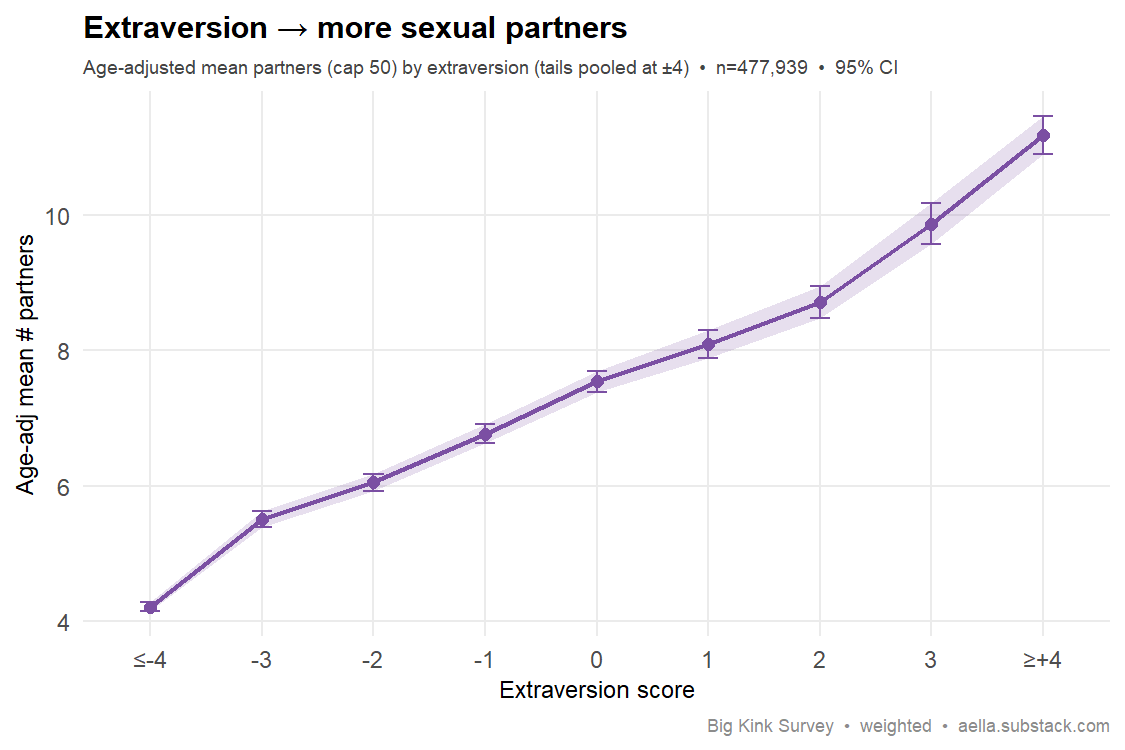
Your data: Beautifully monotonic, and it survives age-adjustment cleanly — age-adjusted mean partners climb 4.2 → 11.2 across the extraversion scale. One of the cleanest replications here.
Survey question(s) asked
- “I am the life of the party” — +3 Totally agree … −3 Totally disagree (7-point agreement scale)
- “I am quiet around strangers” — same 7-point agreement scale
- “How many people have you had sex with?” (tip: “By your definition of 'sex' - this typically means penetration, and sometimes includes oral sex.”) — free number entry
- Extraversion here = agreement with the first item minus agreement with the second (−6…+6) — a 2-item proxy, not a full Big Five inventory. Partner counts are capped at 50 and age-adjusted for the chart.
18. Conscientiousness → fewer partners Weak / inconsistent age-adjusted
The claim: Conscientiousness predicts fewer partners / less risky sex.
Best: Allen & Walter (2018), Psychological Bulletin — meta-analysis (137 studies, n = 420,595): conscientiousness is negatively related to risky and uncommitted sexual behavior, including sexual infidelity (r+ = −.17) and sexual aggression (r+ = −.14). link
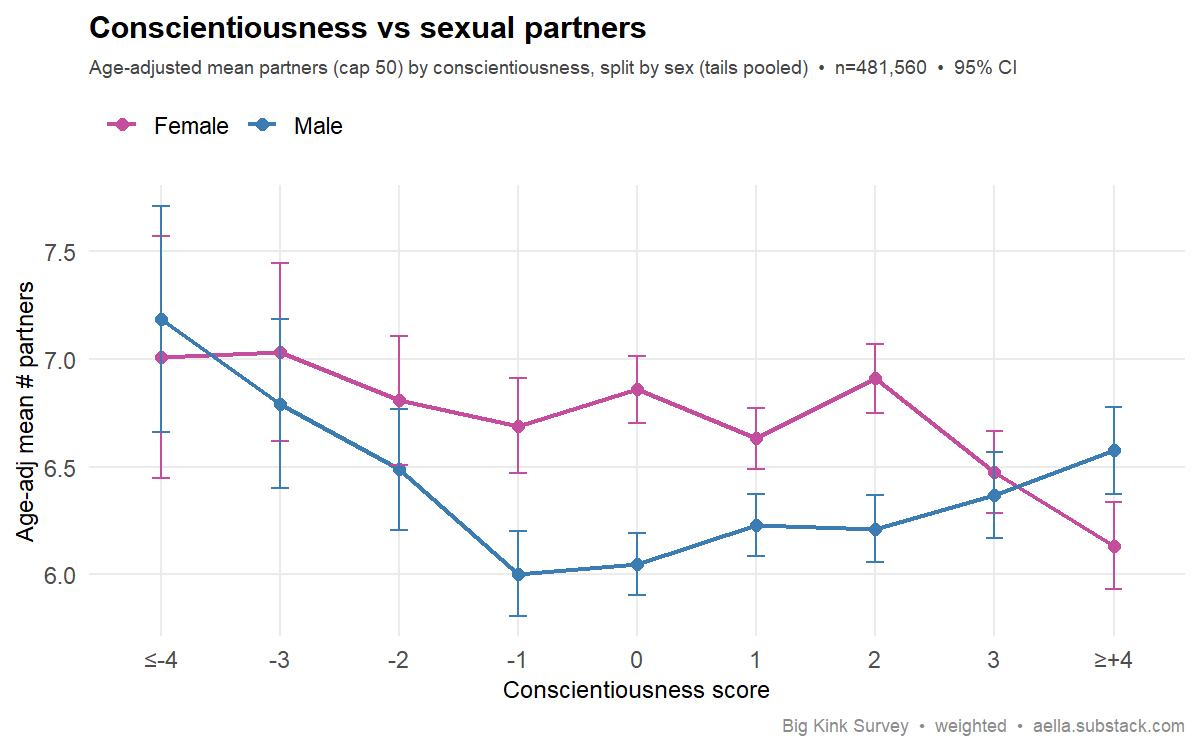
Your data: The raw chart showed a reversal (partners rising with conscientiousness) — but that was an age confound: within 14–34, conscientiousness rises with age, and older people have accumulated more partners. Age-adjusted, edge-binned and split by sex, the predicted negative direction shows up only at the extremes — the least conscientious report the most partners (F 7.0, M 7.2) vs the most conscientious (F 6.1, M 6.6) — but the middle is noisy and the male curve is U-shaped, so it's weak and inconsistent, not a clean replication. The dramatic raw "reversal" was an artifact; the real effect, if any, is small.
Survey question(s) asked
- “I like order” — +3 Totally agree … −3 Totally disagree (7-point agreement scale)
- “I shirk my duties” — same 7-point agreement scale
- “How many people have you had sex with?” (tip: “By your definition of 'sex' - this typically means penetration, and sometimes includes oral sex.”) — free number entry
- Conscientiousness here = agreement with “I like order” minus agreement with “I shirk my duties” (−6…+6) — a 2-item proxy, not a full Big Five inventory. Partner counts are capped at 50, age-adjusted, and split by sex for the chart.
19. Agreeableness → fewer partners Weak / mixed age-adjusted
The claim: Agreeableness predicts fewer partners / more restricted sociosexuality.
Best: Allen & Walter (2018), Psychological Bulletin (meta-analysis). link
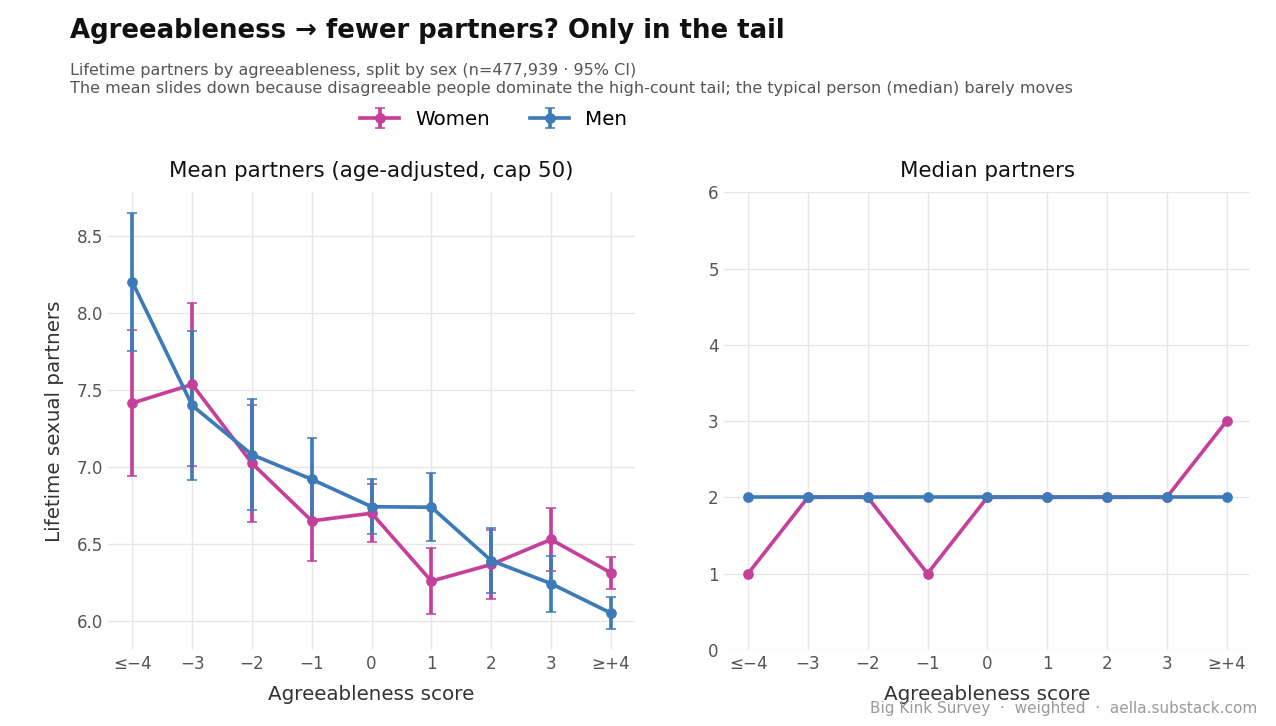
Your data: Barely — and the answer depends entirely on which statistic you use, which is what the two panels show. On ranks it is a non-effect: age-adjusted Spearman +0.01 overall (−0.03 men, +0.04 women), and the median partner count sits flat at 2 across almost the whole scale. On means it looks real: age-adjusted mean partners fall 7.9 → 6.2 from the least to the most agreeable (d≈0.17) — but that is a tail effect, driven by disagreeable respondents being over-represented among very high partner counts, not by the typical person having fewer. The raw correlation even runs the wrong way (+0.07) because younger respondents are both less agreeable and less experienced. Verdict: weakly in men and in the outliers, not at all — slightly reversed — in women. Self-report, cross-sectional.
Survey question(s) asked
- “I sympathize with others' feelings” — +3 Totally agree … −3 Totally disagree (7-point agreement scale)
- “I feel little concern for others” — same 7-point agreement scale
- “How many people have you had sex with?” (tip: “By your definition of 'sex' - this typically means penetration, and sometimes includes oral sex.”) — free number entry
- Agreeableness here = agreement with the first item minus agreement with the second (−6…+6) — a 2-item proxy, not a full Big Five inventory. Partner counts are capped at 50 for the chart means (uncapped ranks for the quoted Spearman correlations), with age adjustment as described.
20. Openness → broader range of sexual interests Weak
The claim: Openness to experience predicts more varied / permissive sexual interests.
Best: Magnusson, Crandall & Evans (2019), BMC Public Health — low self-control predicts earlier sexual debut (i.e. higher self-control/conscientiousness predicts later initiation). link Backup: Allen & Walter (2018), Psychological Bulletin — meta-analysis linking Big Five traits (incl. conscientiousness) to sexuality and sexual health. link
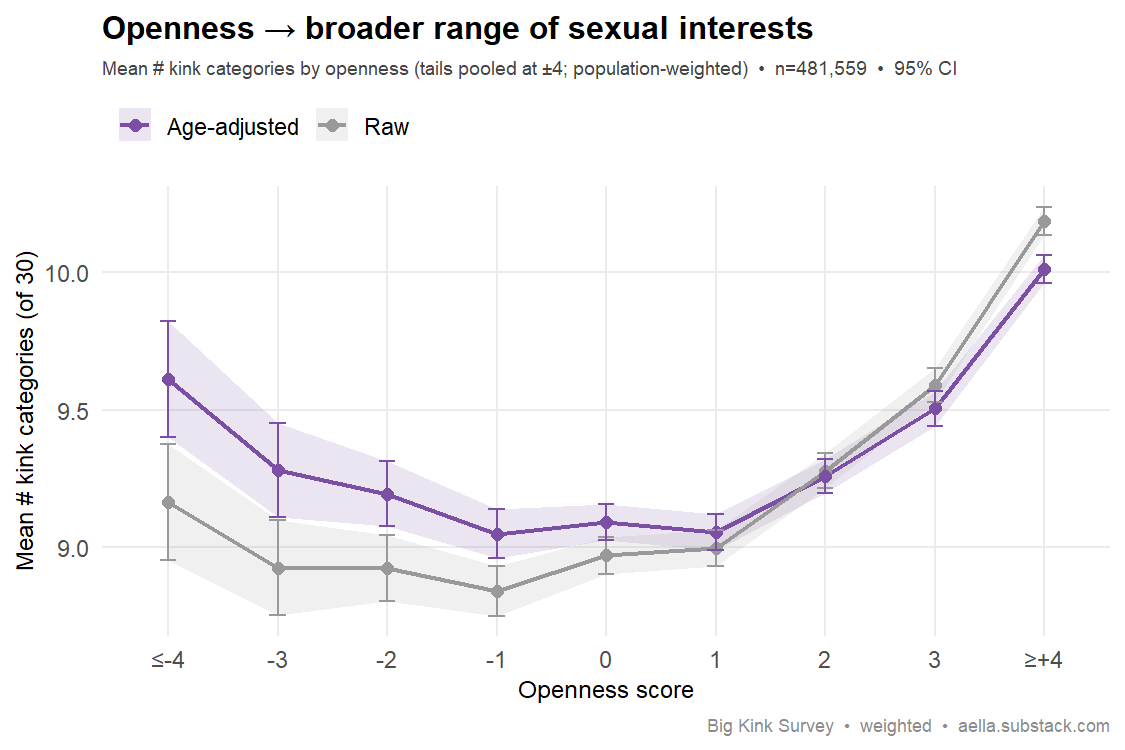
Your data: Positive but weak and not monotone. From openness −1 upward breadth climbs cleanly (8.8 → 10.2 kink categories), but the full curve is J-shaped — the most-closed respondents also report more kinks (9.2 at ≤−4), and age-adjusted the closed tail nearly matches the open one (9.6 vs 10.0). The full-sample correlation is +0.08 (+0.06 age-adjusted): real, but small. Openness here is measured with two intellect items, a conservative proxy for the experiential facet the literature leans on.
Survey question(s) asked
- “I have excellent ideas” — +3 Totally agree … −3 Totally disagree (7-point agreement scale)
- “I have difficulty understanding abstract ideas” — same 7-point agreement scale
- “Common things: Check all the following categories that contain a thing that arouses you.” — checkbox, 17 categories (Bondage, Clothing, Humiliation, Power dynamics & D/s, Sadomasochism, Roles, …)
- “Uncommon things: Check all the following categories that contain a thing that arouses you.” — checkbox, 13 categories (Bestiality/creatures, Genderplay, Transformations, Vore, …)
- Kink breadth = total number of categories checked across both checklists (0–30). Openness here = agreement with “I have excellent ideas” minus agreement with “I have difficulty understanding abstract ideas” (−6…+6) — a 2-item intellect-facet proxy, not a full openness scale.
21. Narcissism → more sexual partners Replicates age-adjusted
The claim: Narcissism predicts more partners / unrestricted sociosexuality.
Best: Schmitt et al. (2017), Psychological Topics, 26(1) (ISDP-2; N=30,470 across 53 nations). link Backup: Holtzman & Strube (2013), Evolutionary Psychology. link
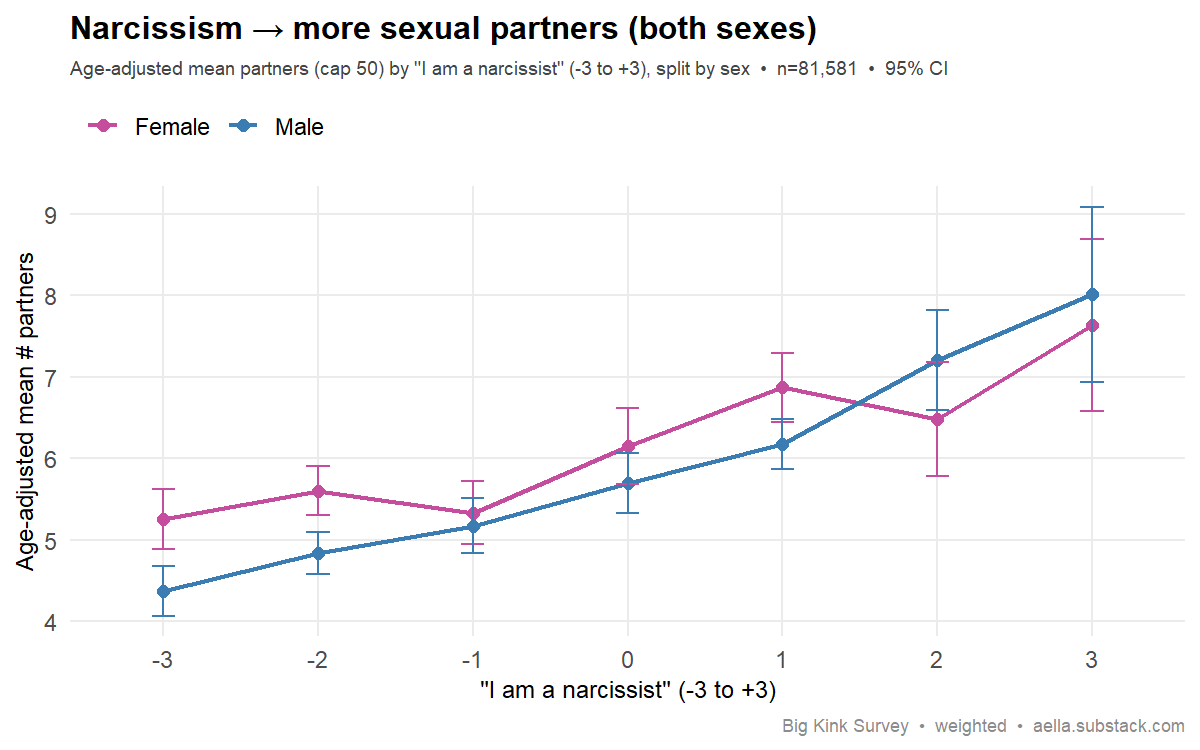
Your data: Flat in the raw pooled numbers (5.66 → 5.78) — but that was an age artifact: younger respondents rate themselves more narcissistic and have had less time to accumulate partners, which suppresses the link. Age-adjust (as we do for the other partner-count findings) and split by sex, and the predicted gradient appears in both sexes: age-adjusted mean partners climb ~4.4 → 8.0 in men and ~5.3 → 7.6 in women across the narcissism scale. The single-item "I am a narcissist" is still a crude proxy, but the sociosexuality link replicates — and the sex split confirms it isn't a pooling artifact.
Survey question(s) asked
- “To what extent do you agree with this statement: I am a narcissist.” (tip: “Note: The word ‘narcissist’ means egotistical, self-focused, and vain.”) — +3 Totally agree … −3 Totally disagree (7-point agreement scale)
- “How many people have you had sex with?” (tip: “By your definition of 'sex' - this typically means penetration, and sometimes includes oral sex.”) — free number entry
- Narcissism is this single self-rating item, not a narcissism inventory. Partner counts are capped at 50, age-adjusted, and split by sex for the chart.
22. BDSM interest → healthier personality Mixed
The claim: BDSM practitioners are as psychologically healthy or healthier than non-practitioners — lower neuroticism, higher extraversion, openness, conscientiousness and wellbeing.
Best: Wismeijer & van Assen (2013), J. Sexual Medicine. link
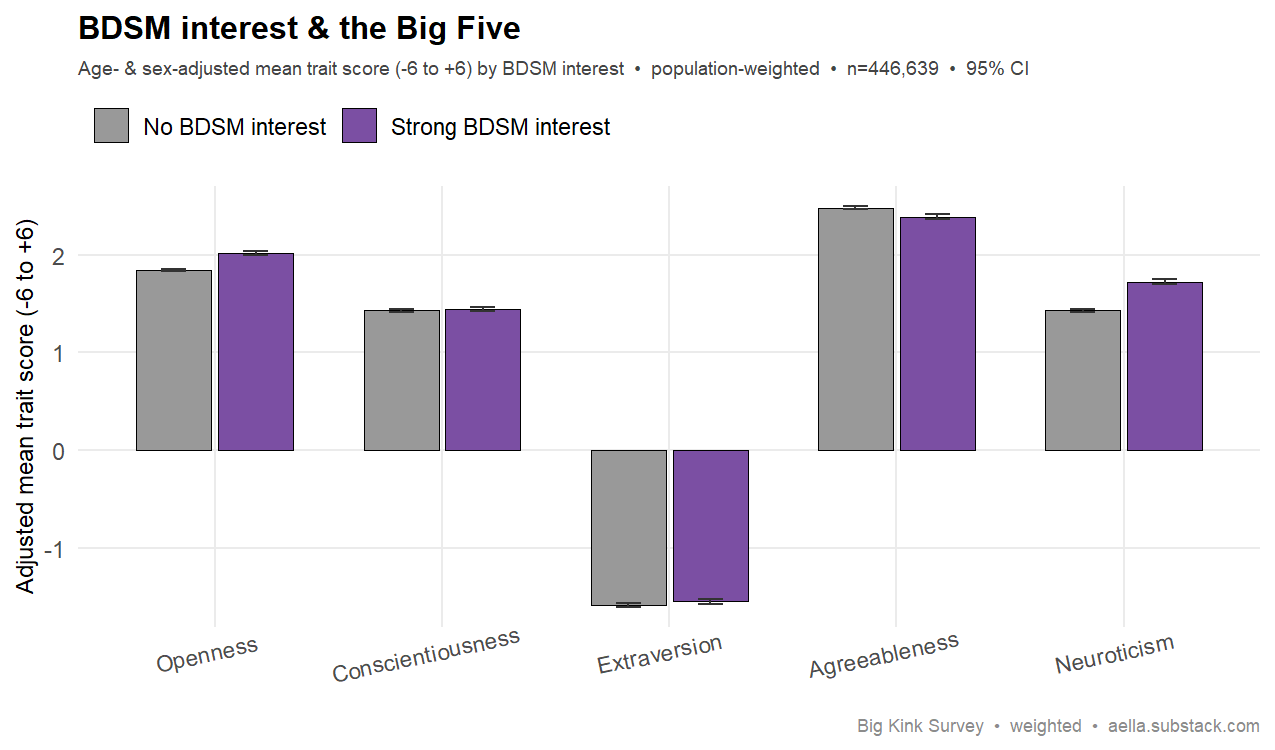
Your data: Partly reversed. Adjusting for age and sex — both confound the raw comparison, since the strong-interest group is older and more female — strong BDSM interest comes with slightly higher openness (2.02 vs 1.84), flat conscientiousness (1.44 vs 1.43), flat extraversion and agreeableness, and notably higher neuroticism (1.72 vs 1.43; the gap holds within women, +0.36, and within men, +0.23) — the opposite of Wismeijer's "emotionally stable" finding. The likely reason: Wismeijer compared an out, community BDSM sample to controls, whereas this is self-rated S&M interest in a kink survey, which tracks the same trauma/neurodivergence load seen elsewhere in this report rather than the well-adjusted hobbyist profile.
Survey question(s) asked
- “I find sexual scenarios involving sadomasochism to be:” (tip: if one specific type of sadomasochism is erotic for you — spanking, needle play, clamps, etc. — answer with just that in mind, not the whole category) — Not arousing / Slightly arousing / Somewhat arousing / Moderately arousing / Very arousing / Extremely arousing
- Big Five items, each rated +3 Totally agree … −3 Totally disagree: Openness = “I have excellent ideas” − “I have difficulty understanding abstract ideas” · Conscientiousness = “I like order” − “I shirk my duties” · Extraversion = “I am the life of the party” − “I am quiet around strangers” · Agreeableness = “I sympathize with others' feelings” − “I feel little concern for others” · Neuroticism = “I worry about things.” − “I am relaxed most of the time” (each trait −6…+6)
- The sadomasochism arousal item is only asked of respondents who checked “Sadomasochism (spanking, needle play, clamps, torture, etc.)” in the kink-category checklist; respondents who didn't check the category are counted as 0 (“Not arousing”) by design. Raw answer values {0,1,2,3,5,8} are stored as an ordinal 0–5 scale. “Strong BDSM interest” on the chart = “Moderately arousing” or higher; “No BDSM interest” = 0.
Ideology, attachment & relationships
23. Openness → political liberalism Weak full sample
The claim: Openness to experience predicts more liberal politics.
Best: Sibley, Osborne & Duckitt (2012), J. Research in Personality (meta-analysis, N≈72k; r=−.18). link
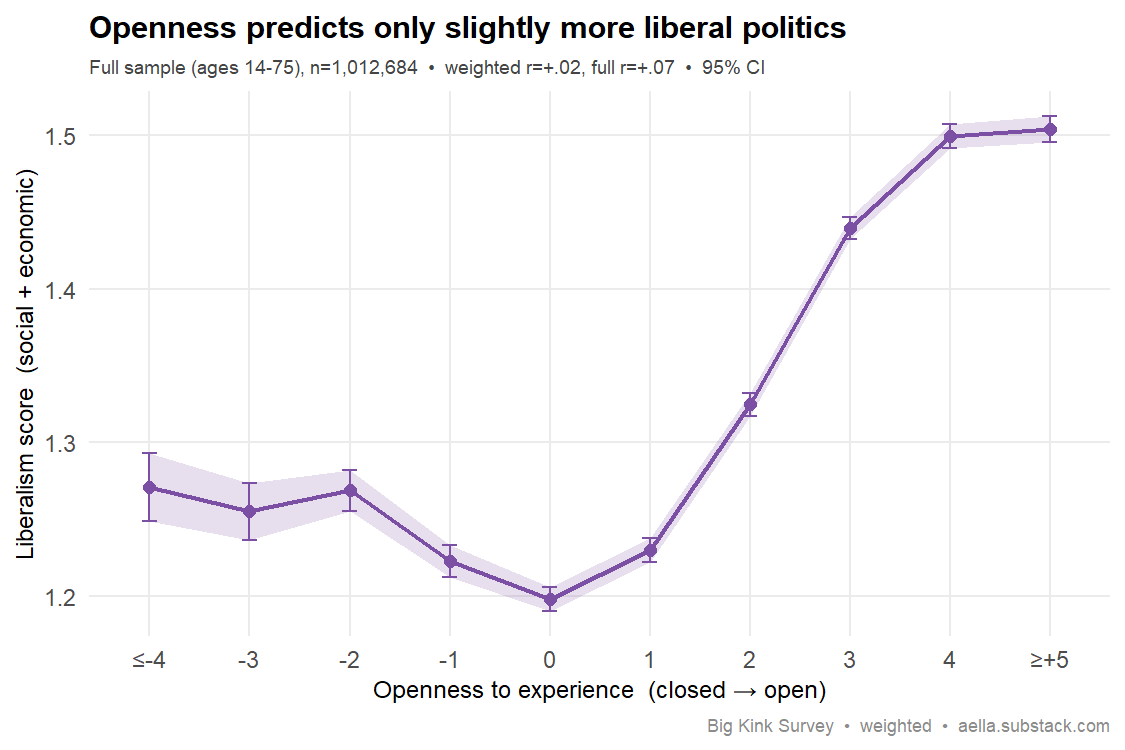
Your data: Direction is right — more open people lean a bit more liberal — but the effect is far weaker than the meta-analytic r≈-.18 (openness↔conservatism). On the full sample (ages 14-75, n≈1.01M) the openness↔liberalism correlation is only r=+.07 (95% CI .067–.071); on the age-truncated weighted sample (14-34) it shrinks to r=+.02. The dose-response is honest above the center — liberalism climbs steadily from openness 0 up to the most-open — but there's a slight uptick at the most-closed tail, so it isn't perfectly linear. Two likely reasons it lands weak: (1) range restriction — a kink survey skews heavily liberal (only ~13% conservative; mean +1.3 on a -3…+3 scale), leaving little conservative variance to detect; and (2) age restriction — the effect is stronger in older respondents (r≈.11 for 35-75 vs ~.06 under 35), so a young sample dilutes it. Sex doesn't change the story (women r=.097, men r=.086 — consistent with the pooled, non-sex-specific literature claim). Not a clean test, but the sign matches.
Survey question(s) asked
- “I have excellent ideas” — +3 Totally agree … −3 Totally disagree (7-point agreement scale)
- “I have difficulty understanding abstract ideas” — same 7-point agreement scale
- Openness here = agreement with the first item minus agreement with the second (−6…+6) — a 2-item intellect-facet proxy, not a full openness scale.
- The liberalism score is the average of two separate political-lean items (social lean and economic lean, each scored −3 conservative … +3 liberal) from survey versions before June 2023, when they were condensed; their exact wording is not preserved in the current survey file. The current survey instead asks the single item “Politically speaking, you tend to be more:” (Significantly liberal/left +3 … Significantly conservative/right −3).
24. Conscientiousness → conservatism Replicates
The claim: Conscientiousness predicts more conservative politics.
Best: Sibley, Osborne & Duckitt (2012), J. Research in Personality (r=.10). link
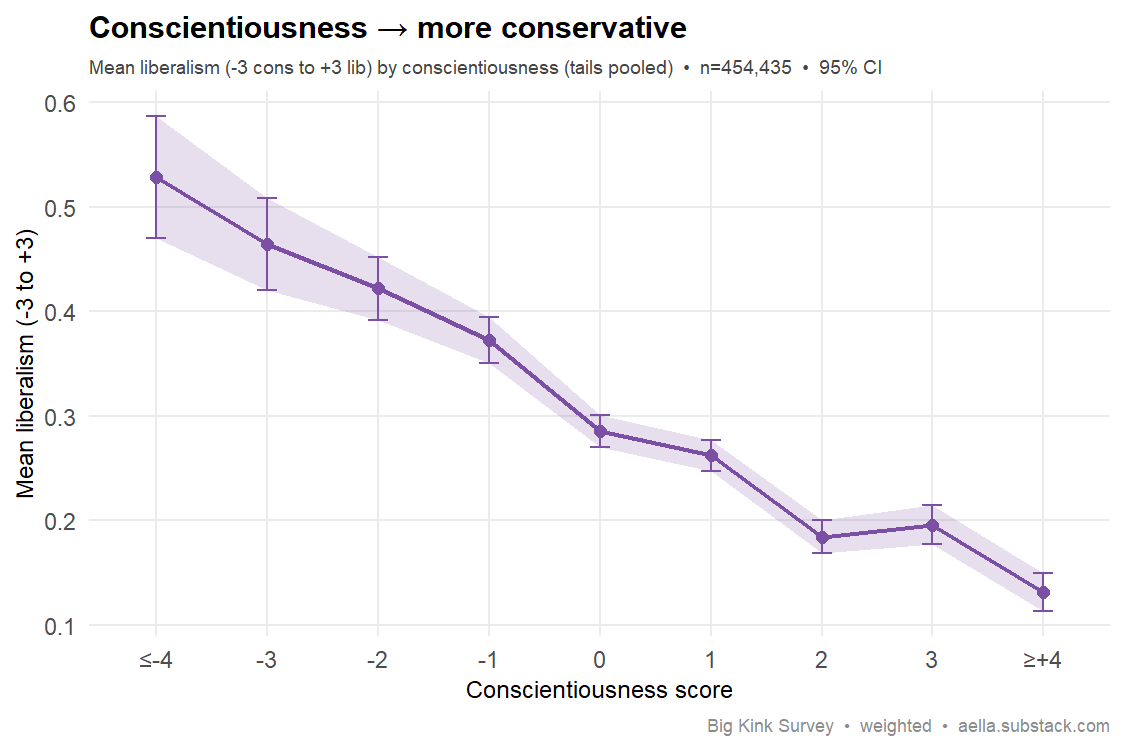
Your data: Mean liberalism falls from +0.53 (least conscientious) to +0.13 (most conscientious) — the expected conservative shift, and clearer than the openness effect despite the same liberal-skewed sample.
Survey question(s) asked
- “I like order” — +3 Totally agree … −3 Totally disagree (7-point agreement scale)
- “I shirk my duties” — same 7-point agreement scale
- Conscientiousness here = agreement with “I like order” minus agreement with “I shirk my duties” (−6…+6) — a 2-item proxy, not a full Big Five inventory.
- The liberalism score is the average of two separate political-lean items (social lean and economic lean, each scored −3 conservative … +3 liberal) from survey versions before June 2023, when they were condensed; their exact wording is not preserved in the current survey file. The current survey instead asks the single item “Politically speaking, you tend to be more:” (Significantly liberal/left +3 … Significantly conservative/right −3).
25. Neuroticism → anxious attachment Replicates
The claim: Neuroticism strongly predicts anxious / insecure adult attachment.
Best: Noftle & Shaver (2006), J. Research in Personality (r≈.52). link
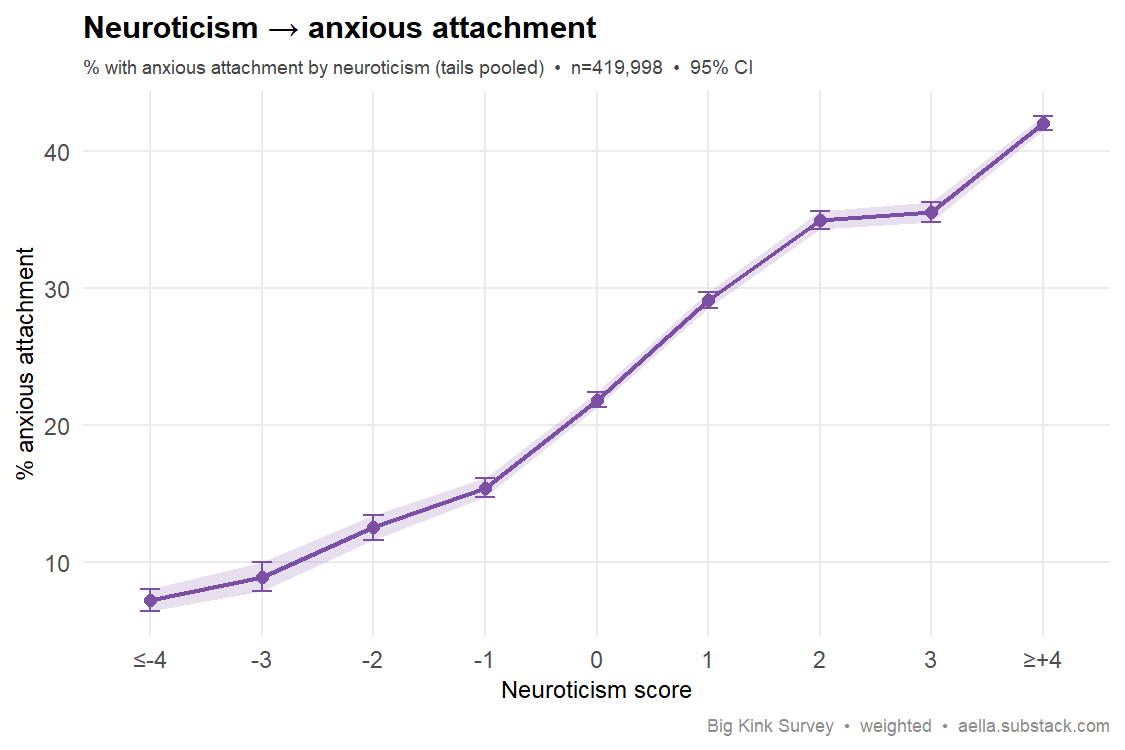
Your data: Dramatic — the share with anxious attachment climbs from 7% (lowest neuroticism) to 42% (highest). One of the strongest relationships in this report.
Survey question(s) asked
- “I worry about things.” — +3 Totally agree … −3 Totally disagree (7-point agreement scale)
- “I am relaxed most of the time” — same 7-point agreement scale
- “What's your attachment style?” (tip: “Attachment style is the way you typically relate to relationships, usually romantic”) — Don't know/not sure / Avoidant (avoidant/distant/commitment fears) / Anxious (codependent/clingy/abandonment fears) / Disorganized (mix of Avoidant and Anxious) / Secure (comfortable with intimacy)
- Neuroticism here = agreement with “I worry about things.” minus agreement with “I am relaxed most of the time” (−6…+6) — a 2-item proxy. Attachment is a single self-label question, not an ECR-style inventory; “Don't know/not sure” respondents are excluded, and the chart plots the share choosing “Anxious”.
26. Avoidant attachment → more casual sex Not seen full sample
The claim: Avoidant attachment predicts more uncommitted/casual sex; anxious attachment is more ambivalent.
Best: see e.g. Schmitt (2005), Pers. & Social Psychology Bulletin 31(6):747-768 — insecure attachment is moderately associated with short-term mating. link · Backup: “No strings attached?”, Personality & Individual Differences (2019), on attachment orientation and varieties of casual sex. link
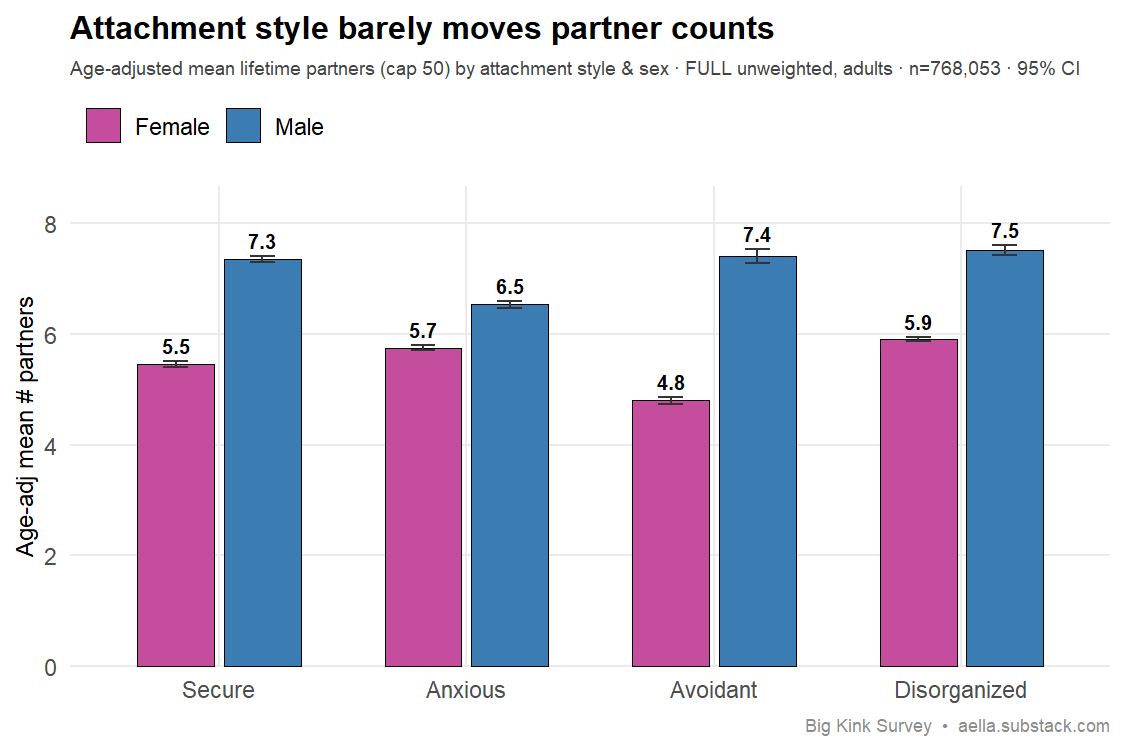
Your data: Not seen. The claim is that attachment avoidance predicts more unrestricted/casual sex; we proxy that with lifetime partners (capped at 50). Raw means flatter Secure — but Secure respondents are ~2.5 years older and far less female than the insecure groups, and that composition does most of the work. Age-adjusted, Disorganized is highest (6.5), Secure sits at 6.2 and Avoidant at 5.7 — roughly half a partner below Secure (−0.5 with age and sex controlled). Split by sex, avoidant men report as many partners as secure men (7.4 vs 7.3, age-adjusted); only among women do avoidants fall behind (4.8 vs 5.5). Avoidant people may hold more permissive casual-sex attitudes, but they do not accumulate more partners — the predicted effect simply isn't there. Self-report, single-item attachment, cross-sectional.
Survey question(s) asked
- “What's your attachment style?” (tip: “Attachment style is the way you typically relate to relationships, usually romantic”) — Don't know/not sure / Avoidant (avoidant/distant/commitment fears) / Anxious (codependent/clingy/abandonment fears) / Disorganized (mix of Avoidant and Anxious) / Secure (comfortable with intimacy)
- “How many people have you had sex with?” (tip: “By your definition of 'sex' - this typically means penetration, and sometimes includes oral sex.”) — free number entry
- Attachment is a single self-label question, not an ECR-style inventory; “Don't know/not sure” respondents are excluded. The casual-sex claim is proxied by lifetime partner count: adults 18+, counts filtered to 0–500 and capped at 50 for the chart means (medians use uncapped counts).
27. Secure attachment → more likely partnered Replicates
The claim: Securely attached adults are more likely to be in stable committed relationships.
Best: Hazan & Shaver (1987), J. Personality & Social Psychology (seminal). link
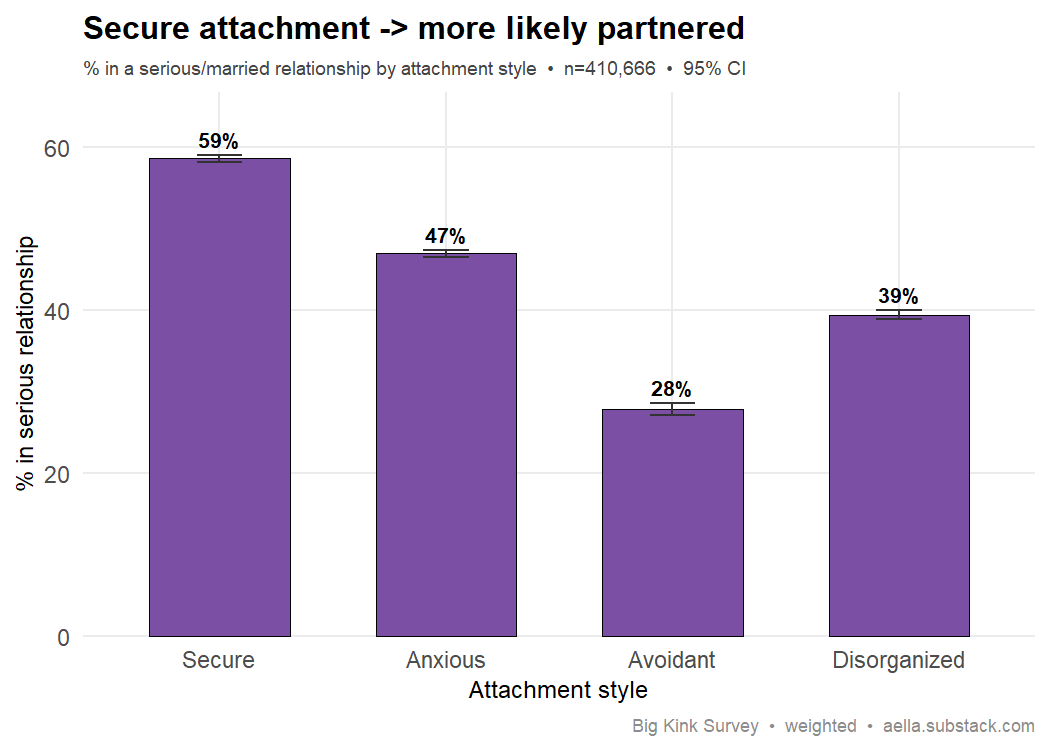
Your data: Secure (59%) > Anxious (47%) > Disorganized (39%) > Avoidant (28%) for being in a serious/married relationship. Secure highest, avoidant lowest — textbook.
Survey question(s) asked
- “What's your attachment style?” (tip: “Attachment style is the way you typically relate to relationships, usually romantic”) — Don't know/not sure / Avoidant (avoidant/distant/commitment fears) / Anxious (codependent/clingy/abandonment fears) / Disorganized (mix of Avoidant and Anxious) / Secure (comfortable with intimacy)
- “Your romantic relationship status is:” (tip: “If you have multiple romantic relationships, answer for the most serious one”) — Single / Relationship (casual) / Relationship (serious) / Relationship (married)
- “In a serious/married relationship” = the last two options. Attachment style is a single self-labeled item (not a validated inventory); “Don't know/not sure” responses are excluded.
Sex differences
28. Men report more sexual partners than women Not seen age-balanced · full sample
The claim: Men report more lifetime sexual partners than women — the famous (and arithmetically impossible) gender discrepancy.
Best: Wiederman (1997), J. Sex Research. link · Backup: Schmitt et al. (2003), J. Personality & Social Psychology. link
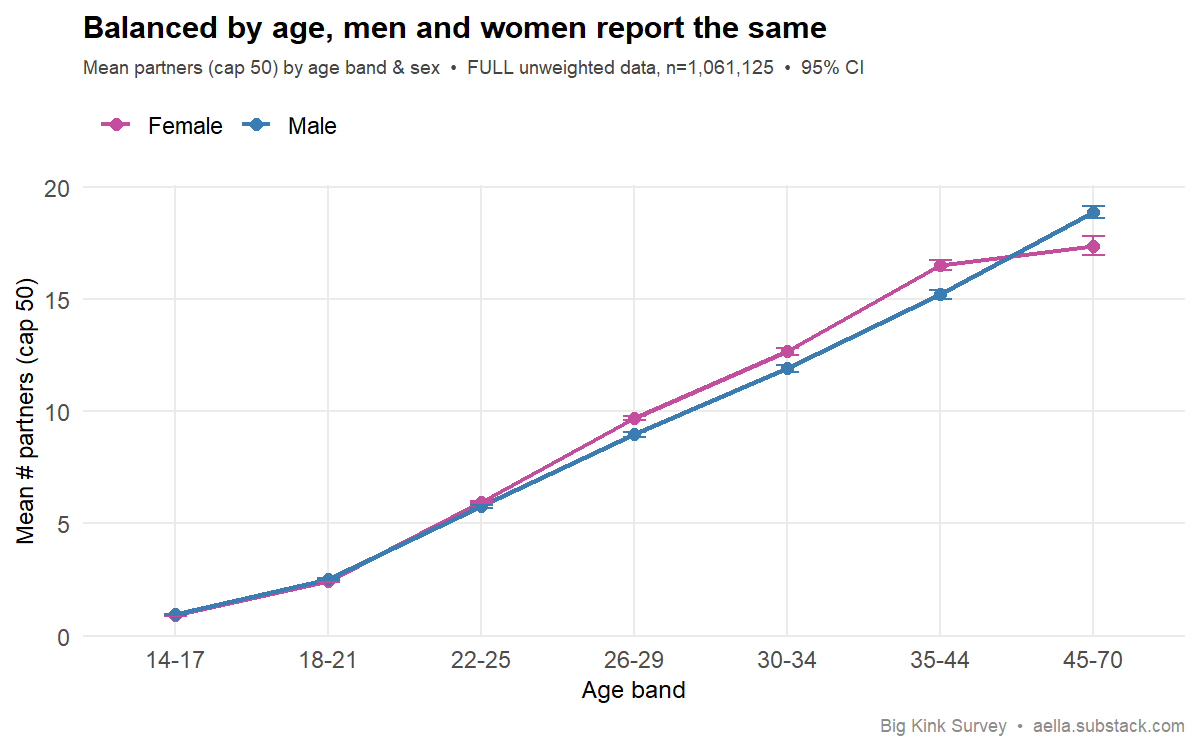
Your data: Doesn't replicate once you balance for age. Comparing men and women within each age band (so the result isn't driven by age composition), they report essentially the same number of partners — age-standardized 9.2 for men vs 9.4 for women (capped at 50). Within bands the sexes track closely — women a touch ahead through 22–44, men among teens and the sparse, self-selected 45+ group. Uncapped, men edge slightly ahead overall (11.7 vs 11.2) because more men report over 50 partners (2.4% vs 1.1%) — still nowhere near the classic severalfold gap. Why this matters: a naive pooled comparison looks male-skewed (6.0 vs 4.5), but that's itself an age-composition artifact — men in the raw sample skew older. Balanced per age, the classic gap is gone, reflecting how unusually sexually active the BKS female sample is. (Self-reported counts also carry the usual male-over / female-under-reporting noise.)
Survey question(s) asked
- “Which category fits you best?” — Man (cis) / Man (trans) / Woman (cis) / Woman (trans) / Nonbinary/other (assigned male at birth) / Nonbinary/other (assigned female at birth)
- “How many people have you had sex with?” (tip: “By your definition of 'sex' - this typically means penetration, and sometimes includes oral sex.”) — write-in number
- Male/Female here is biological sex derived from the category item (trans and nonbinary respondents are grouped by birth sex). Partner counts are capped at 50 and compared within age bands on the full unweighted sample, ages 14–70.
29. Women are more bisexual than men Replicates
The claim: Women are far more likely to be bisexual / sexually fluid, while men's same-sex attraction is more categorical (exclusively gay).
Best: Copen, Chandra & Febo-Vazquez (2016), Natl. Health Statistics Reports (NSFG / CDC). link · Backup: Diamond (2008), Sexual Fluidity (Harvard Univ. Press). link
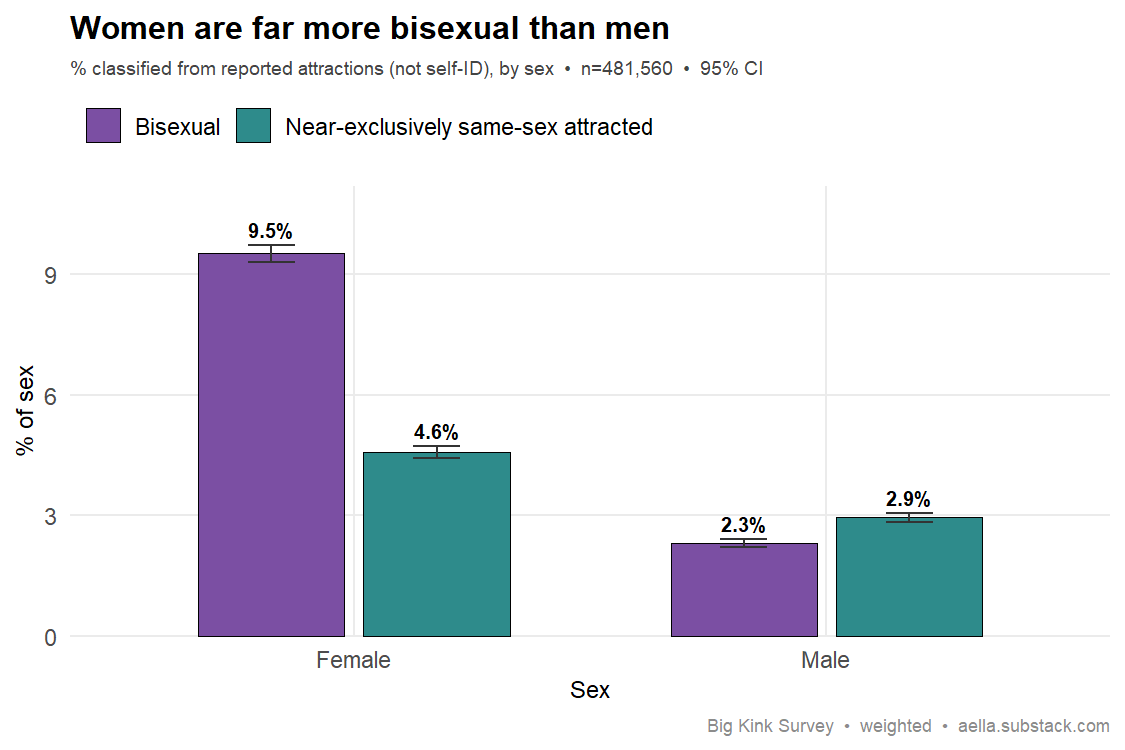
Your data: Strong replication. Classified by their reported attractions (the survey asks who you're attracted to, not for an identity label), 9.5% of women land as bisexual vs just 2.3% of men — a 4× gap. And the categorical-vs-fluid contrast holds: among non-straight respondents, men's attractions are far more often near-exclusively same-sex (≈56% of non-straight men vs ≈32% of non-straight women).
Survey question(s) asked
- “Which category fits you best?” — Man (cis) / Man (trans) / Woman (cis) / Woman (trans) / Nonbinary/other (AMAB) / Nonbinary/other (AFAB); Male/Female = birth sex
- “You're sexually attracted to people with___” — Penises, exclusively / Penises, mostly / Penises, slightly / Both equally / Vaginas, slightly / Vaginas, mostly / Vaginas, exclusively
- “You're more sexually attracted to people who appear visually” — Totally masculine / Somewhat masculine / Slightly masculine / Equally masculine and feminine / Slightly feminine / Somewhat feminine / Totally feminine
- Straight/Bisexual/Gay here are derived from these two attraction items relative to birth sex — not a self-identification question. Each item is scored toward “attracted to the other sex,” the two scores are averaged (−3 to +3), and the average is cut at ≥0.5 = Straight, −0.5 to 0.5 = Bisexual, <−0.5 = Gay (so “Gay” includes mostly-same-sex-attracted respondents, not only exclusive ones).
30. Men lean dominant, women lean submissive Replicates
The claim: Men are more aroused by sexual dominance, women by submission. (A difference of degree — both themes are common in both sexes.)
Best: Joyal, Cossette & Lapierre (2015), J. Sexual Medicine. link · Backup: Zurbriggen & Yost (2004), J. Sex Research. link
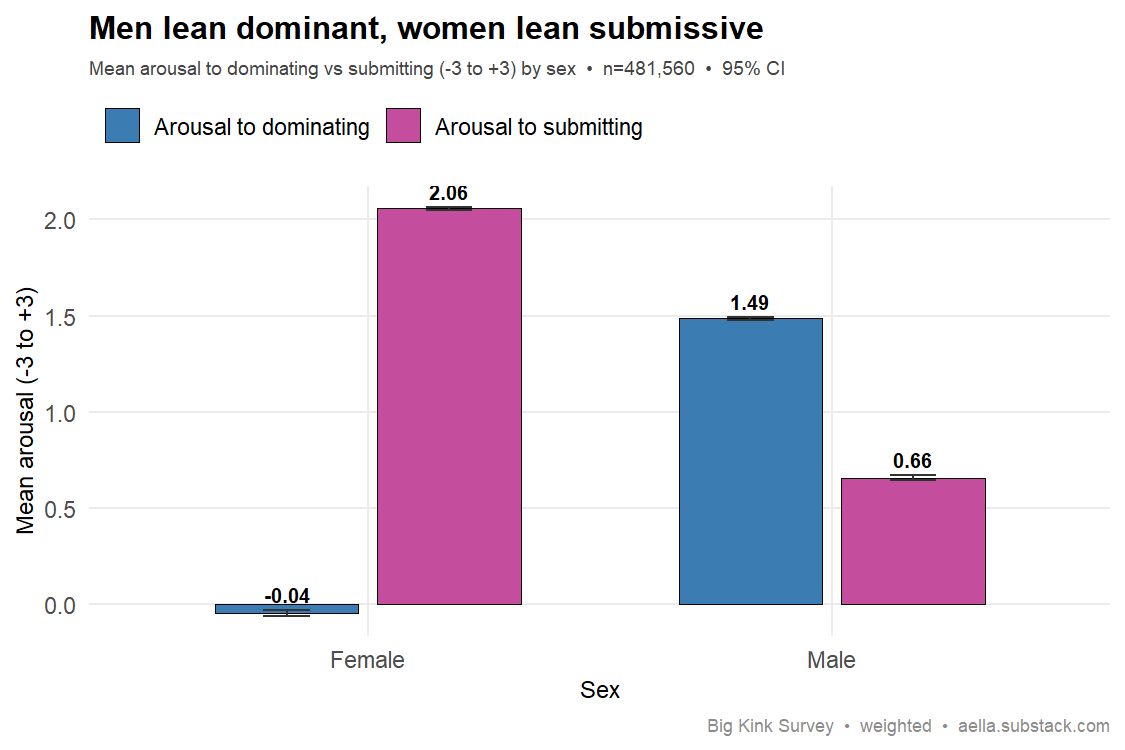
Your data: One of the largest sex differences in this report. Men's arousal to dominating (1.49) dwarfs women's (−0.04); women's arousal to submitting (2.06) far exceeds men's (0.66). (Both sexes lean submissive overall — submission is simply far stronger in women.)
Survey question(s) asked
- “Which category fits you best?” — Man (cis) / Man (trans) / Woman (cis) / Woman (trans) / Nonbinary/other (AMAB) / Nonbinary/other (AFAB); Male/Female = birth sex
- “I am aroused by being dominant in sexual interactions” — +3 Totally agree / +2 Agree / +1 Somewhat agree / 0 Neither agree nor disagree / −1 Somewhat disagree / −2 Disagree / −3 Totally disagree
- “I am aroused by being submissive in sexual interactions” — same 7-point agree scale
31. Men use pornography more than women Replicates
The claim: Men consume more pornography than women.
Best: Hald (2006), Archives of Sexual Behavior. link
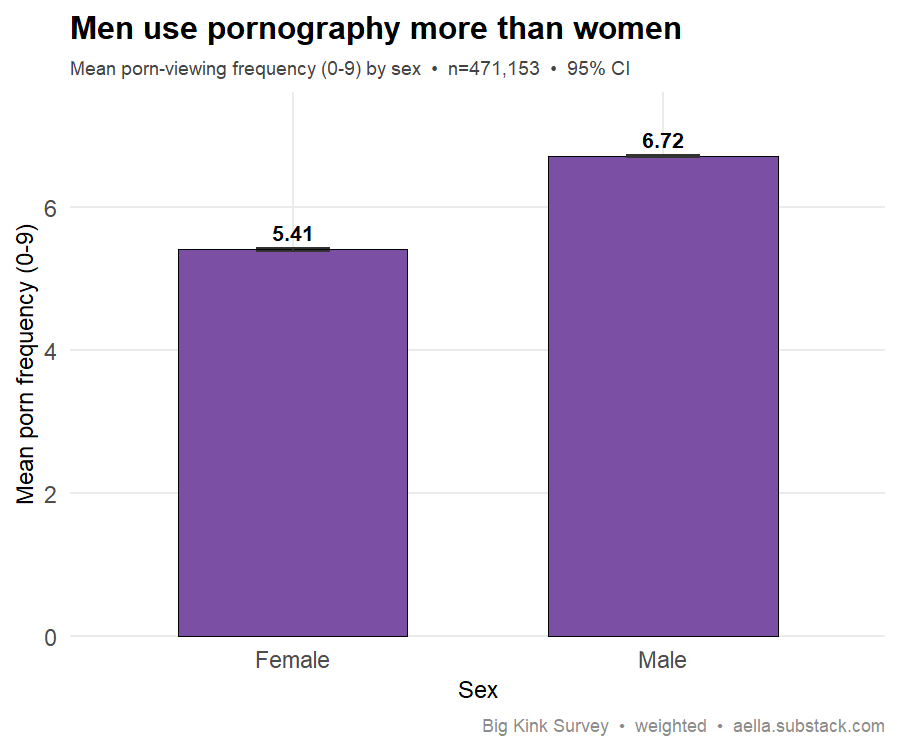
Your data: Men score higher on porn-viewing frequency (6.7 vs 5.4). Replicates — though the gap is smaller than general-population studies, since BKS women are unusually sexually engaged.
Survey question(s) asked
- “Which category fits you best?” — Man (cis) / Man (trans) / Woman (cis) / Woman (trans) / Nonbinary/other (AMAB) / Nonbinary/other (AFAB); Male/Female = birth sex
- “How often do you watch or read pornographic/erotic content?” (tip: “for the purposes of getting aroused”) — I don't (0) / Less than once a year (1) / Once a year (2) / A few times a year (3) / Once a month (4) / A few times a month (5) / Once a week (6) / Multiple times a week (7) / Daily (8) / Multiple times a day (9)
- The item counts reading erotica as well as watching visual porn.
32. Men report higher sex drive Replicates
The claim: Men have stronger sex drive / desire than women.
Best: Baumeister, Catanese & Vohs (2001), Personality & Social Psychology Review. link
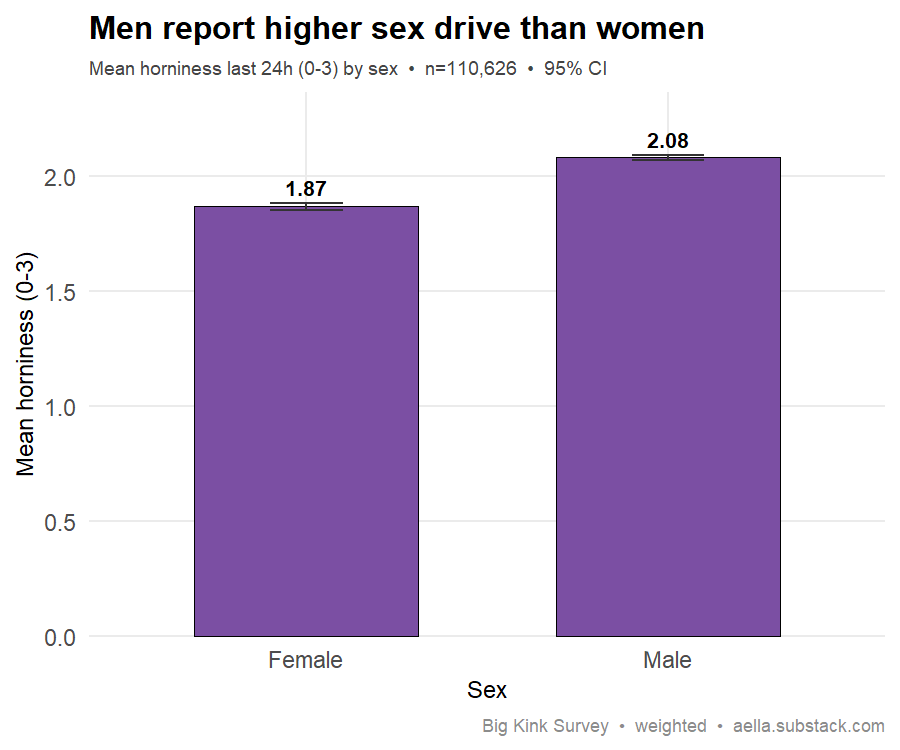
Your data: Men report higher recent horniness (2.08 vs 1.87). Direction matches; modest gap, again attenuated by a high-libido female sample.
Survey question(s) asked
- “Which category fits you best?” — Man (cis) / Man (trans) / Woman (cis) / Woman (trans) / Nonbinary/other (AMAB) / Nonbinary/other (AFAB); Male/Female = birth sex
- “How horny have you been in the last 24 hours?” — Not horny at all (0) / A little horny (1) / Moderately horny (2) / Real horny (3)
Mate value & mating
33. Higher mate value → more partners Replicates age-adjusted
The claim: More physically attractive people have more sexual partners.
Best: Rhodes, Simmons & Peters (2005), Evolution & Human Behavior. link
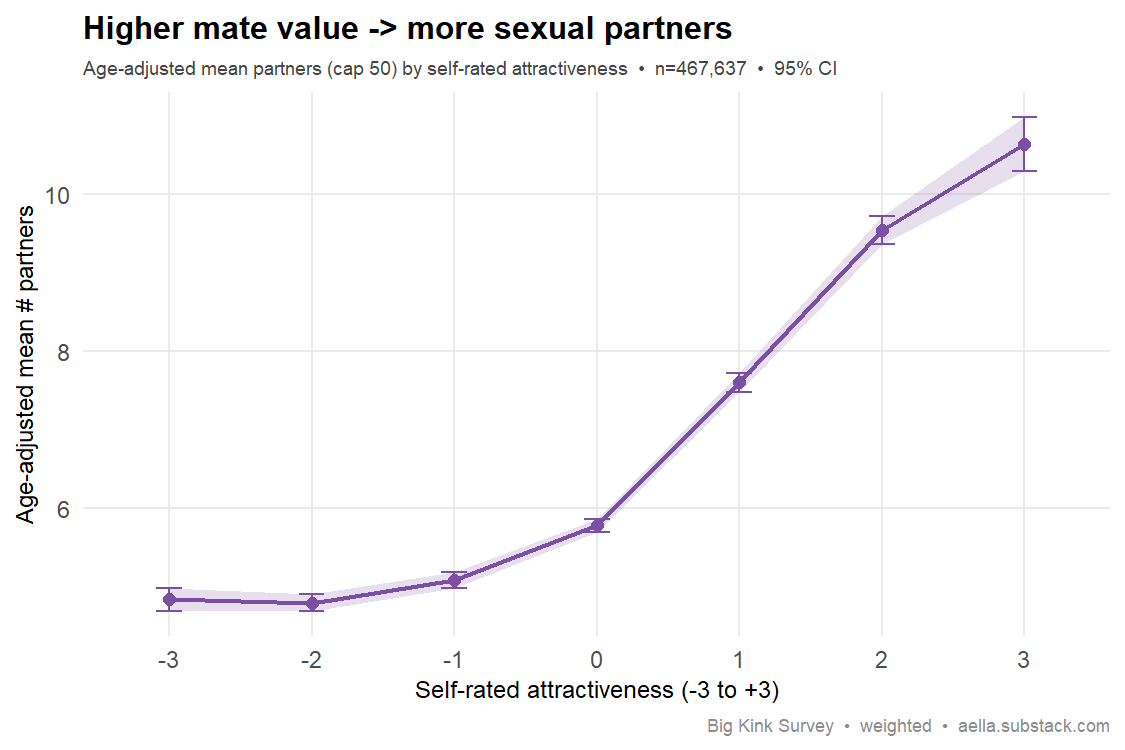
Your data: Age-adjusted partners more than double across self-rated attractiveness (4.8 → 10.6). Strong. Note: Rhodes found the pattern differs by sex (attractiveness → short-term partners for men, long-term for women), so a sex split would add nuance here.
Survey question(s) asked
- “Compared to other people of your same gender and age range, you are” — Significantly less attractive (−3) / Moderately less attractive (−2) / Slightly less attractive (−1) / About average attractiveness (0) / Slightly more attractive (+1) / Moderately more attractive (+2) / Significantly more attractive (+3)
- “How many people have you had sex with?” (tip: “By your definition of 'sex' - this typically means penetration, and sometimes includes oral sex.”) — write-in number
- Attractiveness is self-rated, not observer-rated. Partner counts are capped at 50 and age-adjusted (residualized on single years of age).
34. Taller men → more partners Replicates age-adjusted
The claim: Taller men have more sexual partners / greater mating success.
Best: Nettle (2002), Human Nature. link · Backup: Pawlowski et al. (2000), Nature. link
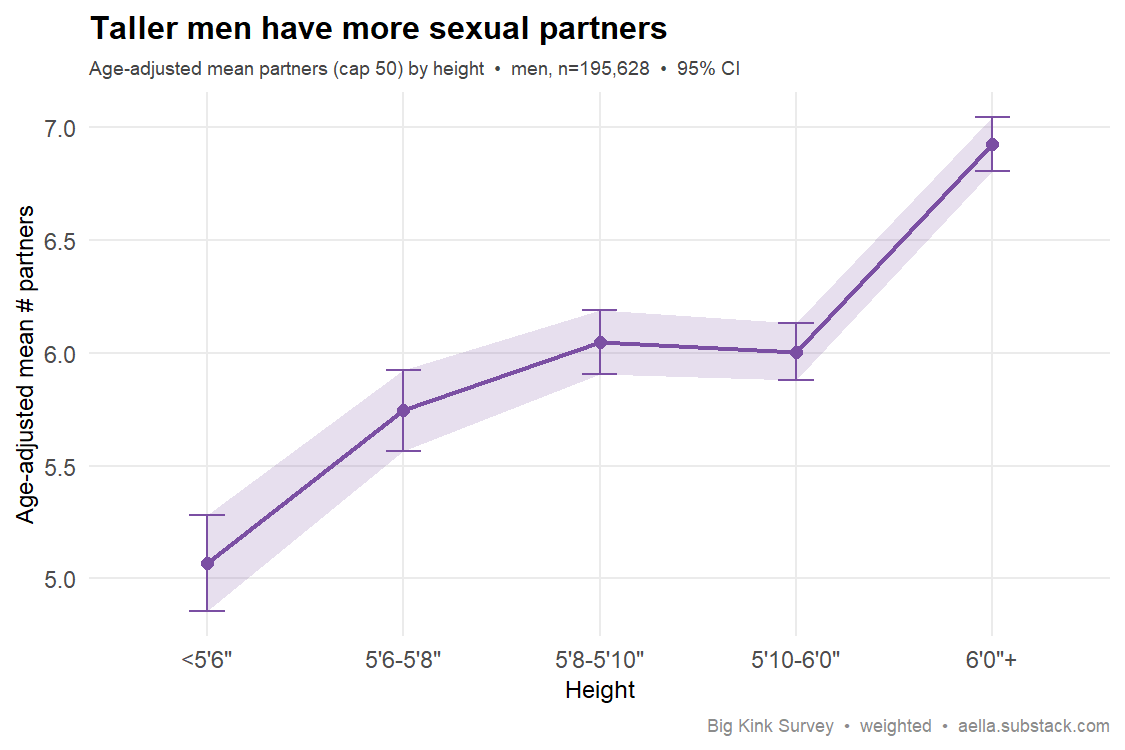
Your data: Among men, age-adjusted partners rise with height (5.1 for <5'6" → 6.9 for 6'0"+). Monotonic — replicates.
Survey question(s) asked
- “What's your height?” — pick list from <5'0" (<152cm) to 6'6+ (198cm) in 1-inch steps
- “How many people have you had sex with?” (tip: “By your definition of 'sex' - this typically means penetration, and sometimes includes oral sex.”) — write-in number
- Men only (birth sex from the “Which category fits you best?” item). Partner counts capped at 50 and age-adjusted; heights grouped into the five bins shown.
35. Higher BMI → lower self-rated attractiveness Replicates
The claim: Higher BMI predicts lower physical attractiveness, especially in women.
Best: Wang et al. (2015), PeerJ 3:e1155, "The relationship of female physical attractiveness to body fatness" — inverse linear relationship between BMI/body fatness and rated female attractiveness across 10 populations. link
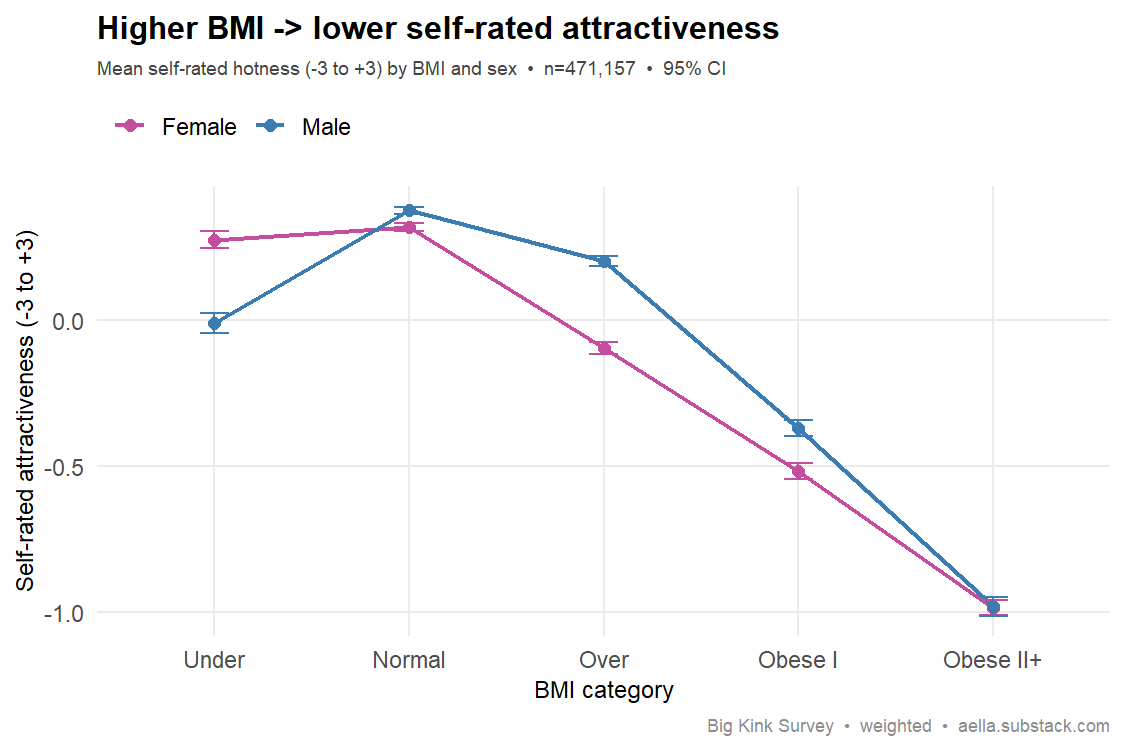
Your data: Self-rated attractiveness peaks at normal weight and falls steeply with BMI for both sexes (women 0.28 → −0.99). The decline is monotonic above normal weight — strong replication, using self-rating rather than observer rating.
Survey question(s) asked
- “Compared to other people of your same gender and age range, you are” — Significantly less attractive (−3) / Moderately less attractive (−2) / Slightly less attractive (−1) / About average attractiveness (0) / Slightly more attractive (+1) / Moderately more attractive (+2) / Significantly more attractive (+3)
- “What's your height?” — pick list, <5'0" to 6'6+ in 1-inch steps
- “Your weight is closest to:” — pick list, <90lbs (<41kg) to >350lbs (>159kg) in 20lb steps
- BMI was not asked directly — it is computed from these two coarse pick-list items, then binned (underweight <18.5 / normal / overweight / obese I / obese II+). Split by birth sex from the “Which category fits you best?” item.
36. Polyamory orientation → more partners Replicates age-adjusted
The claim: Unrestricted sociosexuality / polyamorous orientation predicts more partners.
Best: Penke & Asendorpf (2008), J. Personality & Social Psychology (SOI-R). link
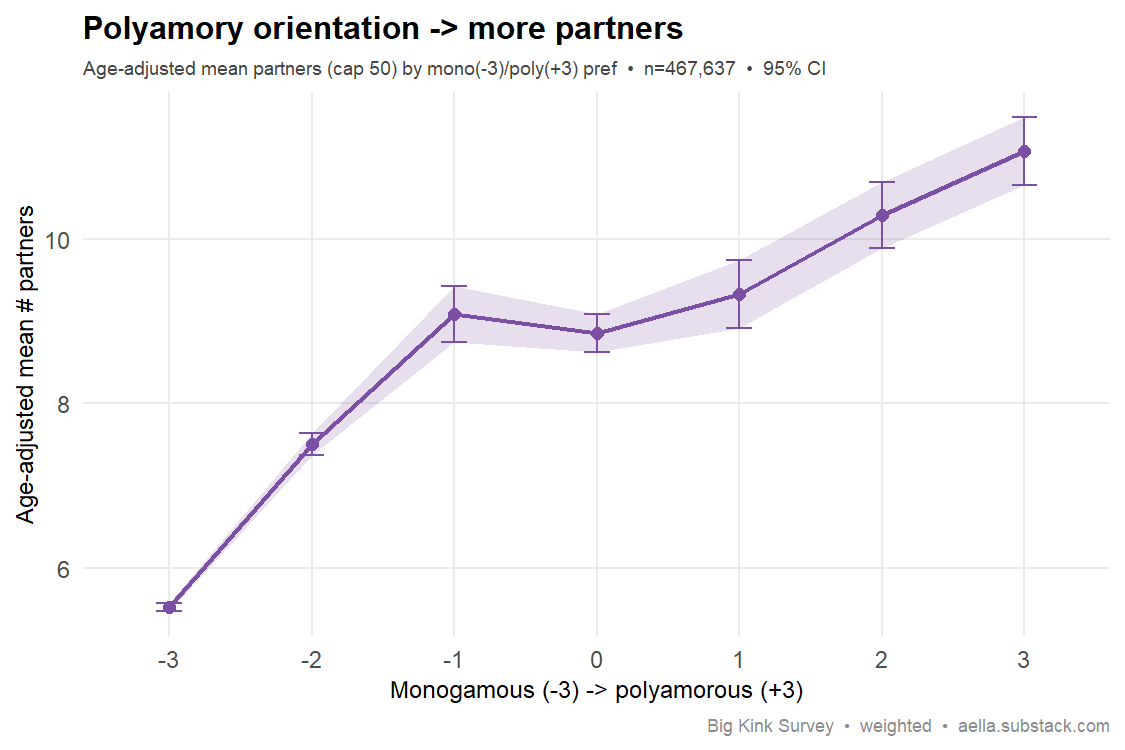
Your data: Age-adjusted partners double from monogamous (5.5) to polyamorous (11.1) preference. Clean replication of the sociosexuality → behavior link.
Survey question(s) asked
- “Personally, your preferred relationship style is:” (tip: “Monogamy is preferring a relationship structure where both people are expected not to have sexual/romantic intimacy outside the relationship. Polyamory is a relationship structure where sexual/romantic intimacy outside the relationship is allowed.”) — Very monogamous (−3) / Somewhat monogamous (−2) / Slightly monogamous (−1) / Halfway between mono/poly (0) / Slightly polyamorous (+1) / Somewhat polyamorous (+2) / Very polyamorous (+3)
- “How many people have you had sex with?” (tip: “By your definition of 'sex' - this typically means penetration, and sometimes includes oral sex.”) — write-in number
- This measures preferred relationship style (mono vs poly), not the SOI-R sociosexuality inventory. Partner counts capped at 50 and age-adjusted.
Neurodivergence
37. ADHD → more partners & earlier debut Replicates age-adjusted
The claim: ADHD predicts earlier sexual debut and more partners / riskier sex.
Best: Flory et al. (2006), J. Clinical Child & Adolescent Psychology. link
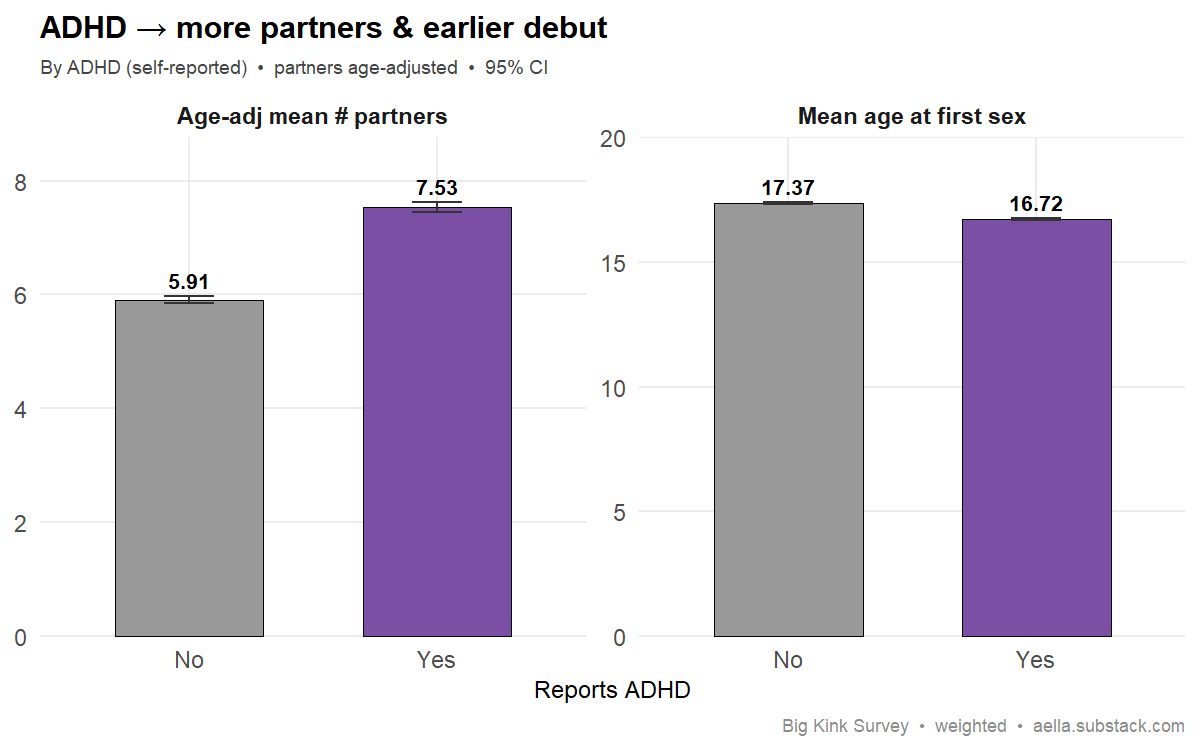
Your data: Both hold — with partner count age-adjusted (ADHD respondents skew younger), those with ADHD still report more partners (7.5 vs 5.9) and earlier first sex (16.7 vs 17.4).
Survey question(s) asked
- “Do you have any of the following” (checkbox; tip: “Please only check if they're 'moderate to severe'”) — ‘ADHD’ checked vs not
- “How many people have you had sex with?” (tip: “By your definition of 'sex' - this typically means penetration, and sometimes includes oral sex.”) — write-in number
- “At what age did you first have penetrative sexual intercourse?” — I haven't had sex / 12 or younger / single years 13–25 / 26-30 / 31-35 / 36-40 / 41+
- ADHD is self-reported from a mental-health checklist, not a diagnosis question. Partner counts capped at 50 and age-adjusted. “12 or younger” is coded 11 and the older ranges at rough midpoints (28/34/38/45); “I haven't had sex” is excluded from the debut analysis.
38. Autism → broader atypical sexual interests Replicates
The claim: Autism / autistic traits predict more atypical, paraphilic, or varied sexual interests.
Best: Schöttle et al. (2017), Dialogues in Clinical Neuroscience. link
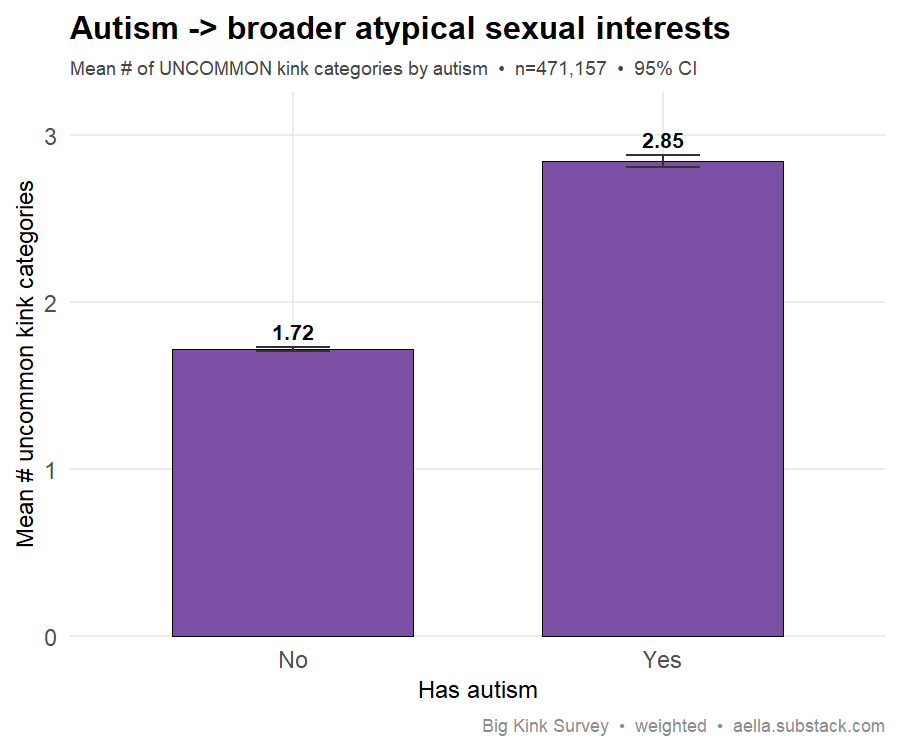
Your data: Autistic respondents endorse far more uncommon kink categories (2.85 vs 1.72) — a large gap, consistent with the broader-interests finding. The gap holds within cis women (2.15 vs 1.40) and cis men (2.56 vs 1.90) taken separately, so it isn't just the much higher autism rate among trans and nonbinary respondents (38–48%, vs 7–9% in cis groups).
Survey question(s) asked
- “Do you have any of the following” (checkbox; tip: “Please only check if they're 'moderate to severe'”) — ‘Autism’ checked vs not
- “Uncommon things: Check all the following categories that contain a thing that arouses you.” (checkbox) — 13 categories: Abnormal bodies and body parts / Age: nonstandard / Bestiality/creatures / Bodily secretions / Brutal/violent / Creepy/horror / Dirtiness/disgust/messiness / Genderplay / Mental Alteration / Objects: nonstandard / Reproduction / Transformations / Vore
- Outcome = number of uncommon categories checked (0–13); respondents who checked none are counted as 0. Autism is self-reported from the checklist, not a diagnosis question.
Biology, health & the cycle
39. Higher BMI → greater PMS severity Replicates (modest)
The claim: Higher BMI predicts more severe PMS.
Best: Bertone-Johnson et al. (2010), J. Women's Health (Nurses' Health Study II). link · Backup: Masho et al. (2005). link
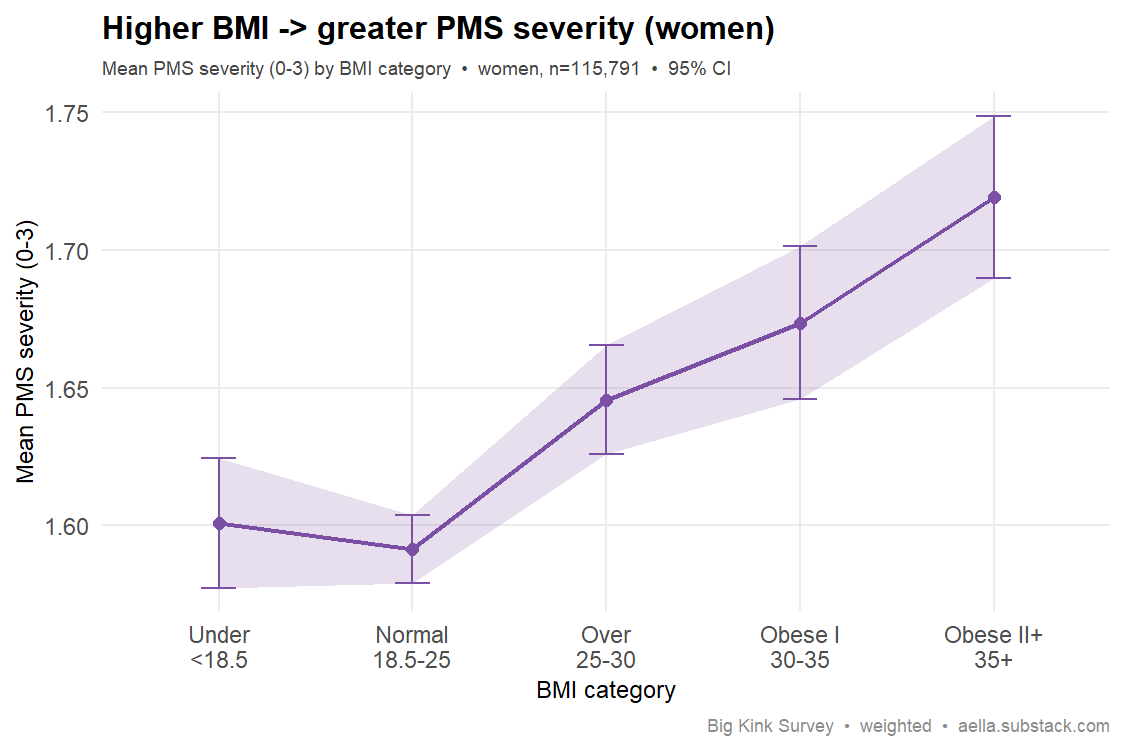
Your data: Mean PMS severity rises 1.60 → 1.72 from normal to obese-II, monotonic with tight CIs. Small effect, same direction as the prospective literature. Depression overlaps it: depression rates climb from 35% of normal-weight women to 58% at obese-II, and within depression strata the BMI gradient shrinks from 0.12 to ~0.04–0.06 points — direction intact, but much of the raw rise travels with depression (which the prospective study controlled for).
Survey question(s) asked
- “Do you get mood-based PMS symptoms during your menstrual cycle?” (tip: “e.g., irritability, anxiety, depression”) — I don't menstruate/I don't know / No (0) / Yes, maybe/slightly (1) / Yes, moderately (2) / Yes, severely (3)
- “What's your height?” — pick list, <5'0" to 6'6+ in 1-inch steps
- “Your weight is closest to:” — pick list, <90lbs to >350lbs in 20lb steps
- Women only (birth sex). BMI was not asked directly — it is computed from the two pick-list items and binned. “I don't menstruate/I don't know” responses are excluded.
40. Sexual desire peaks at ovulation Replicates
The claim: Female sexual desire rises mid-cycle, around ovulation.
Best: Roney & Simmons (2013), Hormones & Behavior. link
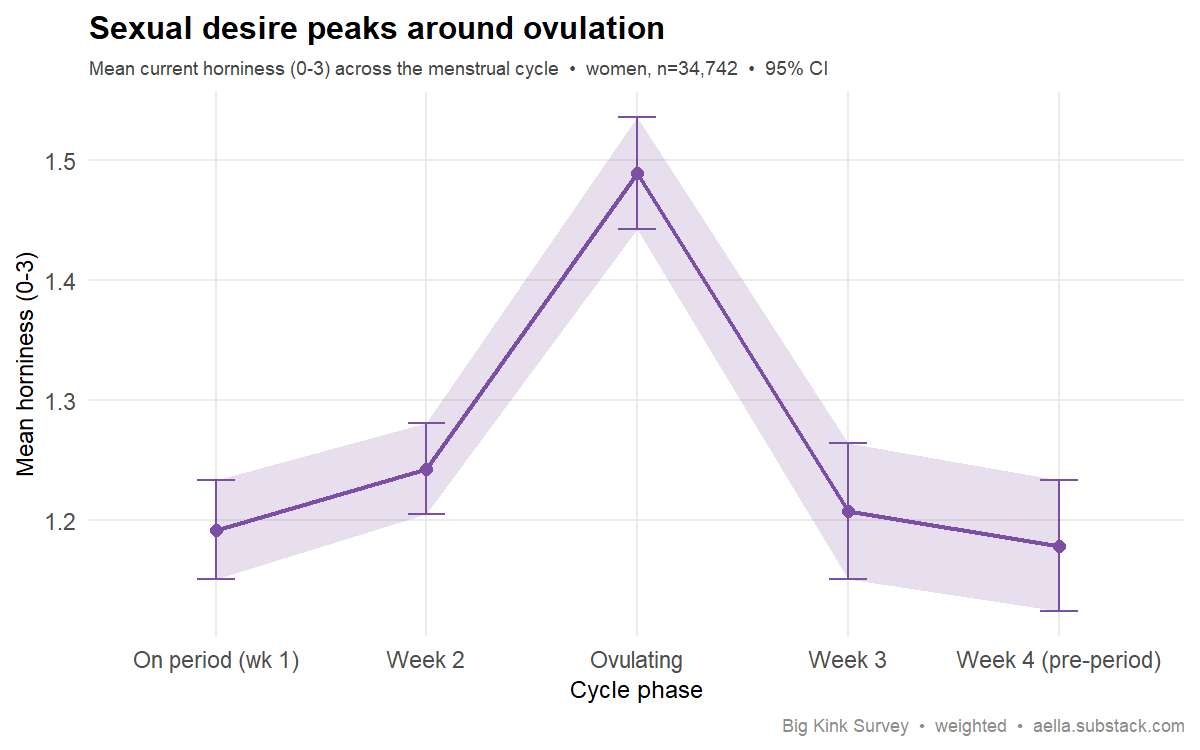
Your data: Clear ovulatory peak — current horniness jumps to 1.49 at "Ovulating" vs ~1.18–1.24 in every other phase. Cross-sectional, but the mid-cycle bump is unmistakable.
Survey question(s) asked
- “Where are you currently at in your menstrual cycle? Options are based on a typical 28 day cycle, but cycle length can change” — Currently on period (week 1) / Week 2 since period / Currently ovulating / Week 3 since period / Week 4 since period (last week before next period); also offered: Don’t want to answer or don’t know / N/A (irregular or don’t get periods) / Am currently pregnant
- “How horny are you right now?” — Not horny at all (0) / A little horny (1) / Moderately horny (2) / Real horny (3)
- The cycle question is asked only of cis women. Phase is self-identified against a typical 28-day cycle (no hormonal or date verification); the chart shows the five phase answers — the don’t-know, irregular/no-periods, and currently-pregnant responses are excluded.
41. Depression → lower libido Not seen
The claim: Depression reduces sexual desire.
Best: Atlantis & Sullivan (2012), J. Sexual Medicine — systematic review & meta-analysis. link · Backup: Gonçalves et al. (2023), Int. J. Impotence Research — systematic review & meta-analysis. link
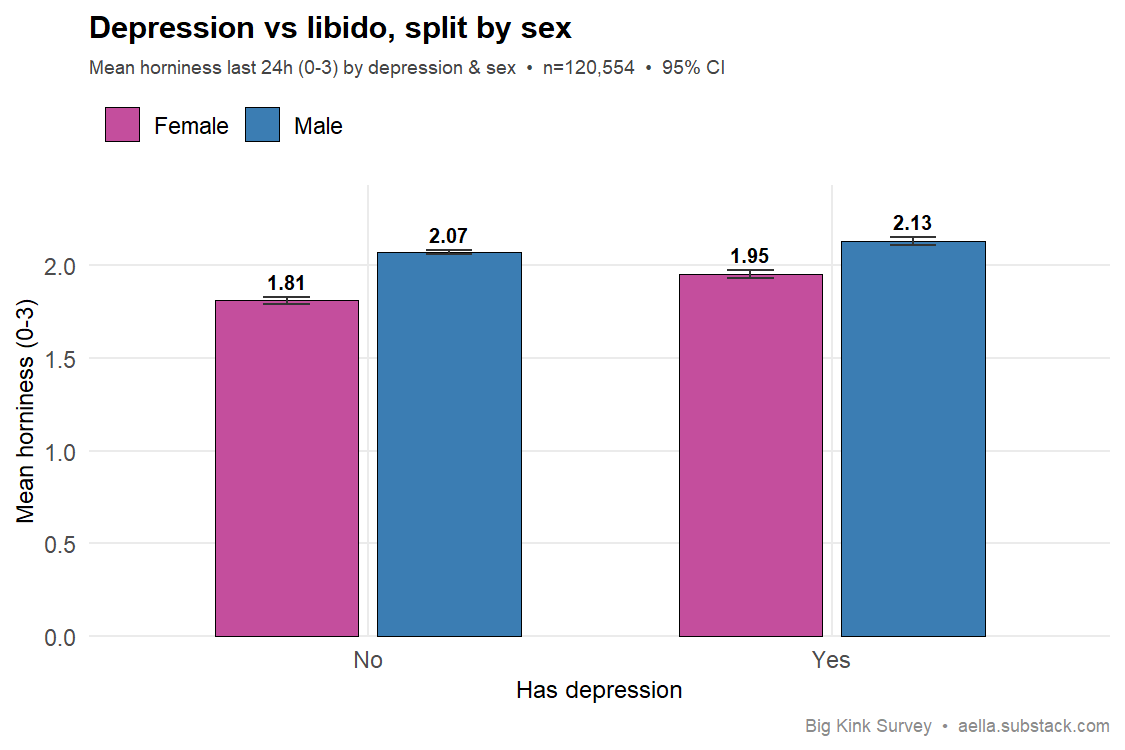
Your data: No effect — and it's not a sex artifact. Both depression (more common in women) and libido (higher in men) differ by sex, so this has to be split. Done properly, depression goes with slightly higher horniness within both sexes (women 1.81 → 1.95, men 2.07 → 2.13) — the opposite of the clinical claim. The likely reason: a one-off self-report ("do you have depression") is a blunt instrument for current depressive state, and self-rated "horniness" isn't clinical low desire/anhedonia. Doesn't replicate here.
Survey question(s) asked
- “Do you have any of the following” — checkbox list of 19 conditions (tip: “Please only check if they're 'moderate to severe'”); this card uses “Depression” checked vs not
- “How horny have you been in the last 24 hours?” — Not horny at all (0) / A little horny (1) / Moderately horny (2) / Real horny (3)
- Depression here is one checkbox in a 19-condition self-report list — not a “have you been diagnosed” question.
42. Hormonal contraception → lower libido Not seen
The claim: The pill reduces sexual desire in some women. (The literature itself is mixed — most studies find no change.)
Best: Pastor et al. (2013), systematic review. link · Backup: Zethraeus et al. (2016), RCT, JCEM. link
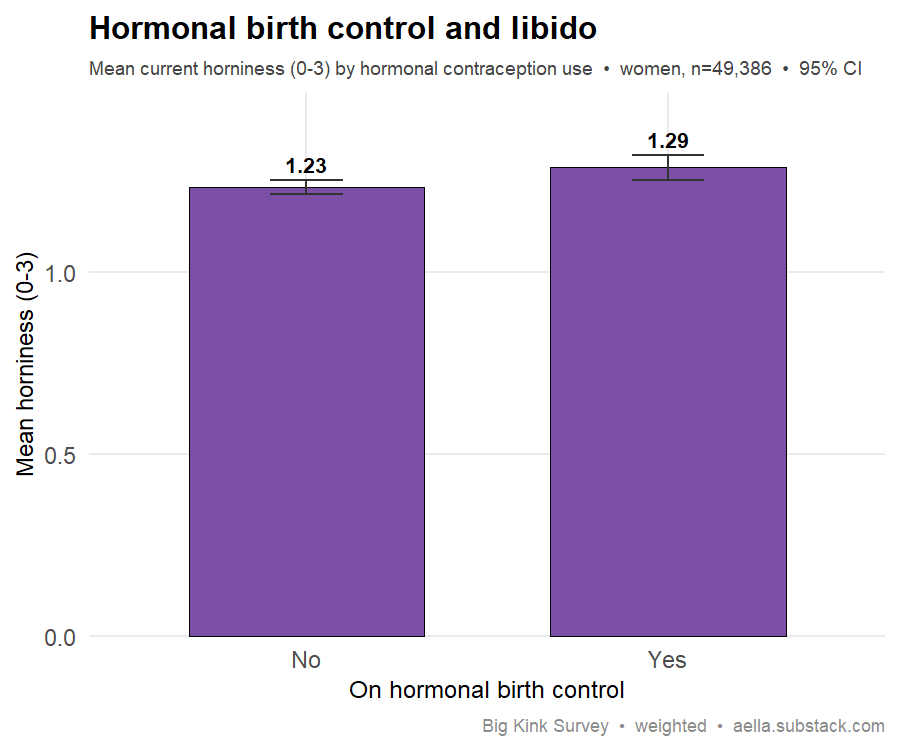
Your data: No reduction — women on hormonal BC report slightly higher horniness (1.29 vs 1.23). Consistent with the "mostly no effect" majority of the literature rather than the suppression hypothesis.
Survey question(s) asked
- “Are you on hormonal birth control? This is the pill or any hormonal implant” — Don’t want to answer / Yes / No
- “How horny are you right now?” — Not horny at all (0) / A little horny (1) / Moderately horny (2) / Real horny (3)
- Asked only of cis women; the chart compares Yes vs No (“don’t want to answer” excluded).
43. Sexual desire declines with age Partial full sample
The claim: Sexual desire / libido declines with age across the lifespan.
Best: Beutel, Stöbel-Richter & Brähler (2008), BJU International (representative, ages 18–93). link
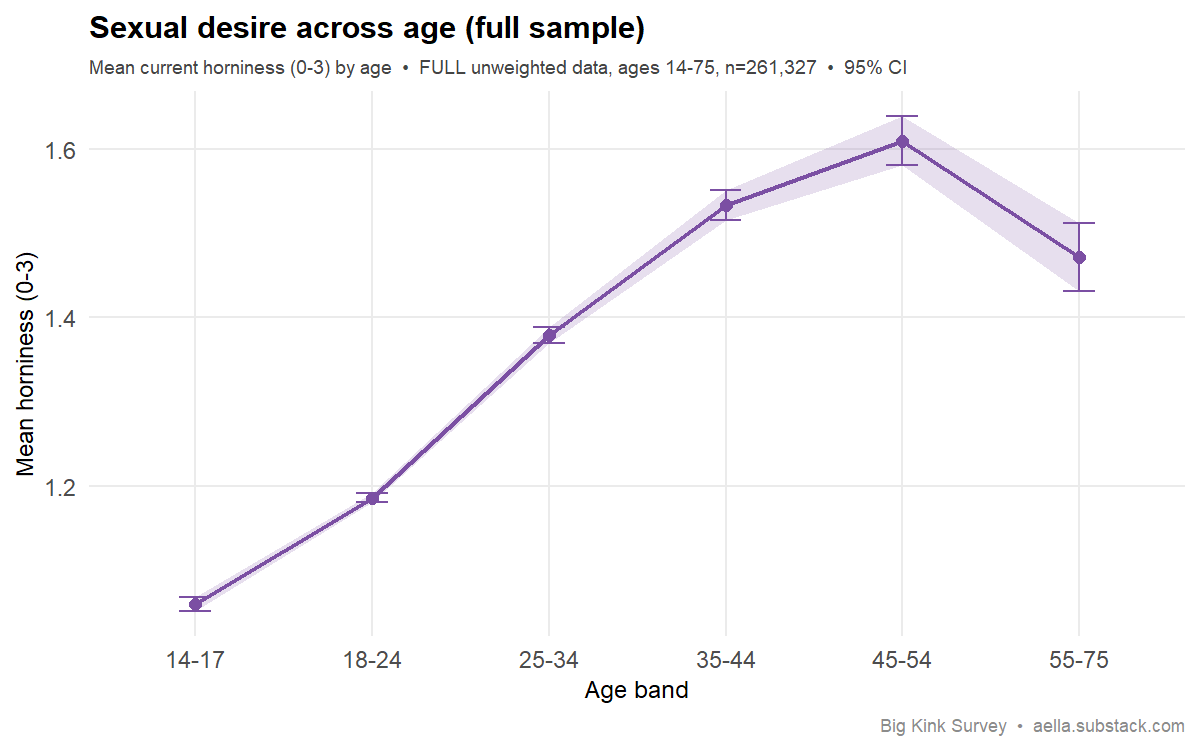
Your data: Re-tested on the full sample (ages 14–75), not the weighted 14–34 slice the rest of the report uses. The literature describes a lifespan decline (its sample spans 18–93). Within each sex, desire rises to a midlife peak — women from 1.05 (14–17) to 1.40 at 35–44, men from 1.07 to 1.71 at 45–54 — then falls: sharply for women at 55+ (1.12, below their 18–24 level), mildly for men (1.60). The pooled line above climbs more steeply (1.06 → 1.61, then 1.47) than either sex alone, because the male share of respondents grows from 36% in the youngest band to 73% in the oldest and men report more desire at every age. The older people who take a kink survey are also an unusually sexual, self-selected group. Partial at best: the decline arrives late — and sharply only for women — so the simple "desire falls with age" isn't what the data show across this range.
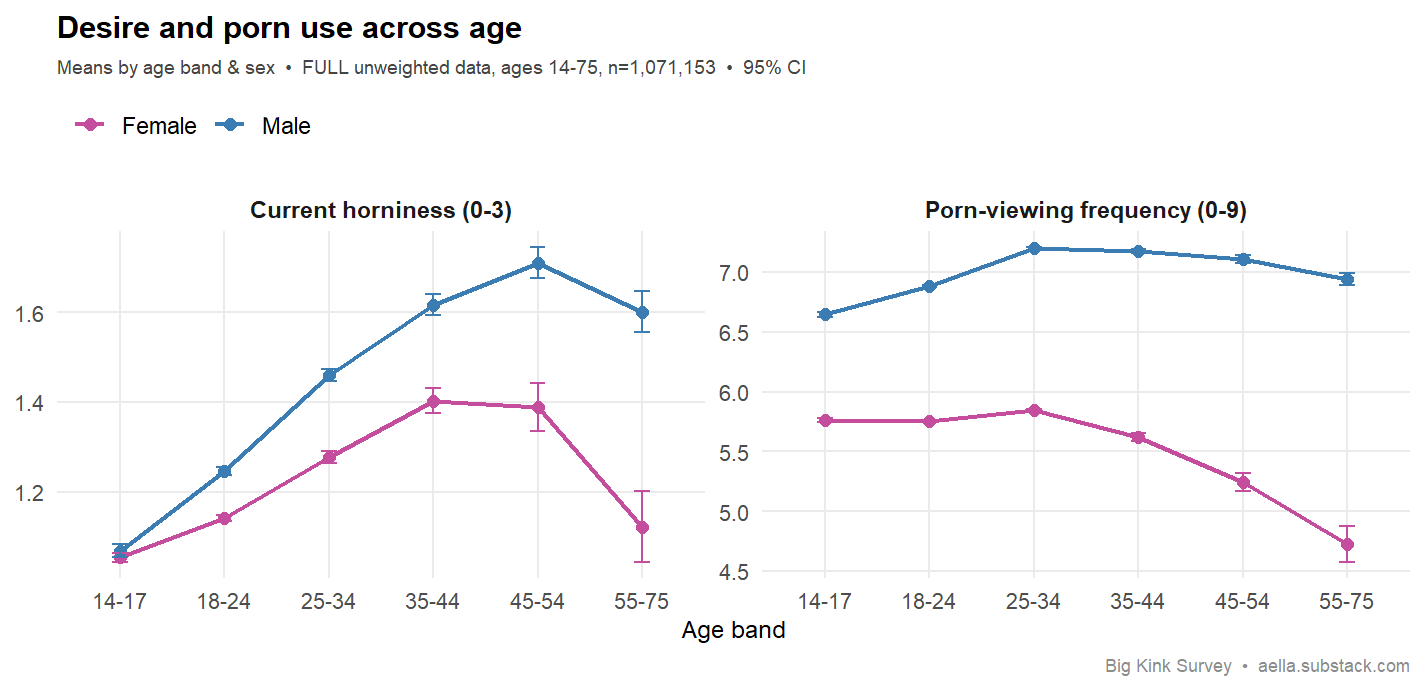
Behaviour alongside desire: The sex-split chart adds porn-viewing frequency alongside desire — for men porn use stays roughly flat across age, and for women it is flat until ~45, then declines (5.5 → 5.2 → 4.8 over the last three bands). (The survey has no masturbation-frequency item — only age of first masturbation — so that one can't be charted.)
Survey question(s) asked
- “How horny are you right now?” — Not horny at all (0) / A little horny (1) / Moderately horny (2) / Real horny (3)
- “How old are you?” — free number entry, binned here into 14–17 / 18–24 / 25–34 / 35–44 / 45–54 / 55–75
- “How often do you watch or read pornographic/erotic content?” (tip: for the purposes of getting aroused) — I don’t (0) / Less than once a year (1) / Once a year (2) / A few times a year (3) / Once a month (4) / A few times a month (5) / Once a week (6) / Multiple times a week (7) / Daily (8) / Multiple times a day (9) — second chart only
- Both charts use the full unweighted sample, ages 14–75 (not the weighted 14–34 slice used elsewhere); the second chart splits by birth sex.
Sexual repertoire & culture
44. Sadism ↔ masochism co-occur Replicates
The claim: Within individuals, enjoying giving pain correlates with enjoying receiving it (not an either/or).
Best: Greitemeyer (2022), Acta Psychologica 230:103715 — finds giving and receiving sexualized pain share a "common core." link · Backup: De Neef et al. (2019), Sexual Medicine — note this review finds the roles are also partly separable (~23% identify as both). link
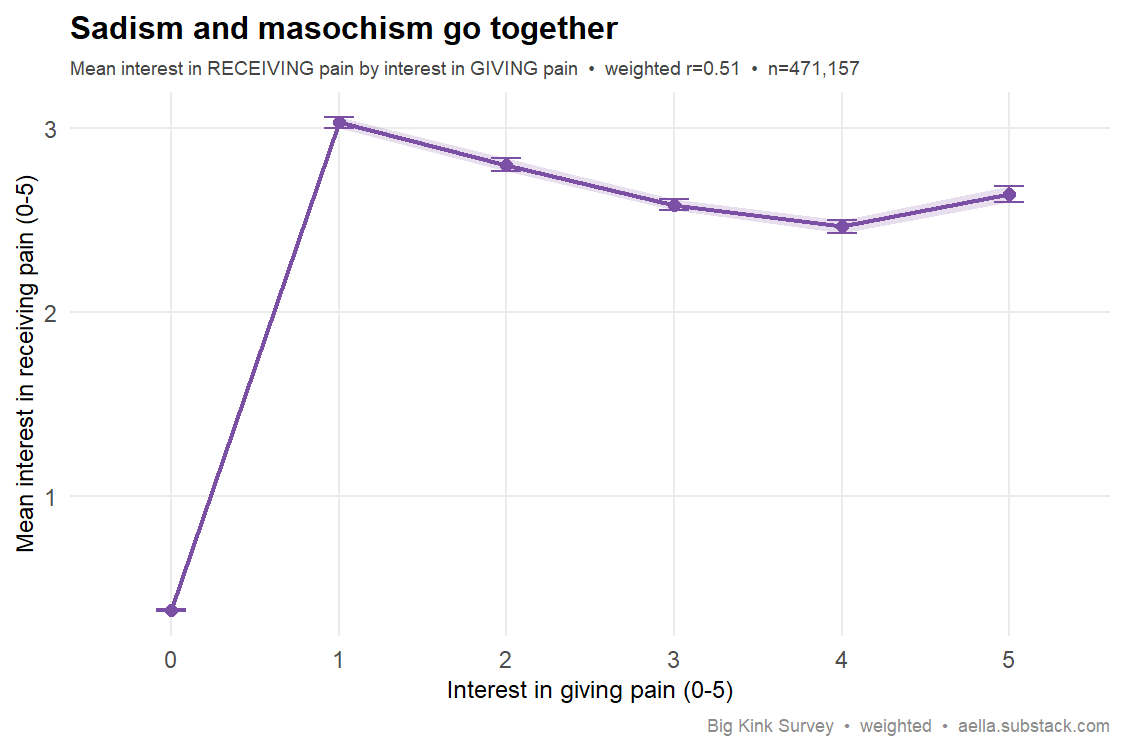
Your data: Strong positive link (weighted r = 0.51): interest in receiving pain climbs steadily with interest in giving it. Switches are the rule, not the exception. Both items sit behind the sadomasochism category gate: the 64% (weighted) who didn't endorse the category count as zero interest in both — by design, since no interest in the category means no interest in its parts — and that (0,0) mass anchors the population-level correlation. Among endorsers the pattern is co-occurrence of roles rather than matched intensity: 65% report some interest in both directions, but how much someone wants to give barely tracks how much they want to receive (weighted r = −0.14) — which fits De Neef's partly-separable roles.
Survey question(s) asked
- “In erotic contexts, I find *giving* pain to others to be:” — Not arousing / Slightly arousing / Somewhat arousing / Moderately arousing / Very arousing / Extremely arousing
- “In erotic contexts, I find *receiving* pain to be:” — same arousal scale
- The raw survey scores these options 0/1/2/3/5/8; the cleaned data stores them as ordinal 0–5, which is what the chart axes show.
- Both items are asked only of respondents who checked “Sadomasochism (spanking, needle play, clamps, torture, etc.)” on the kink-category checklist and rated sadomasochism scenarios above “Not arousing”; everyone else is counted as 0 (“not arousing”) on both items by design.
45. Exhibitionism ↔ voyeurism co-occur Replicates
The claim: Exhibitionistic and voyeuristic interests are positively correlated (paraphilic interests cluster).
Best: Långström & Seto (2006), Archives of Sexual Behavior (Swedish national survey). link
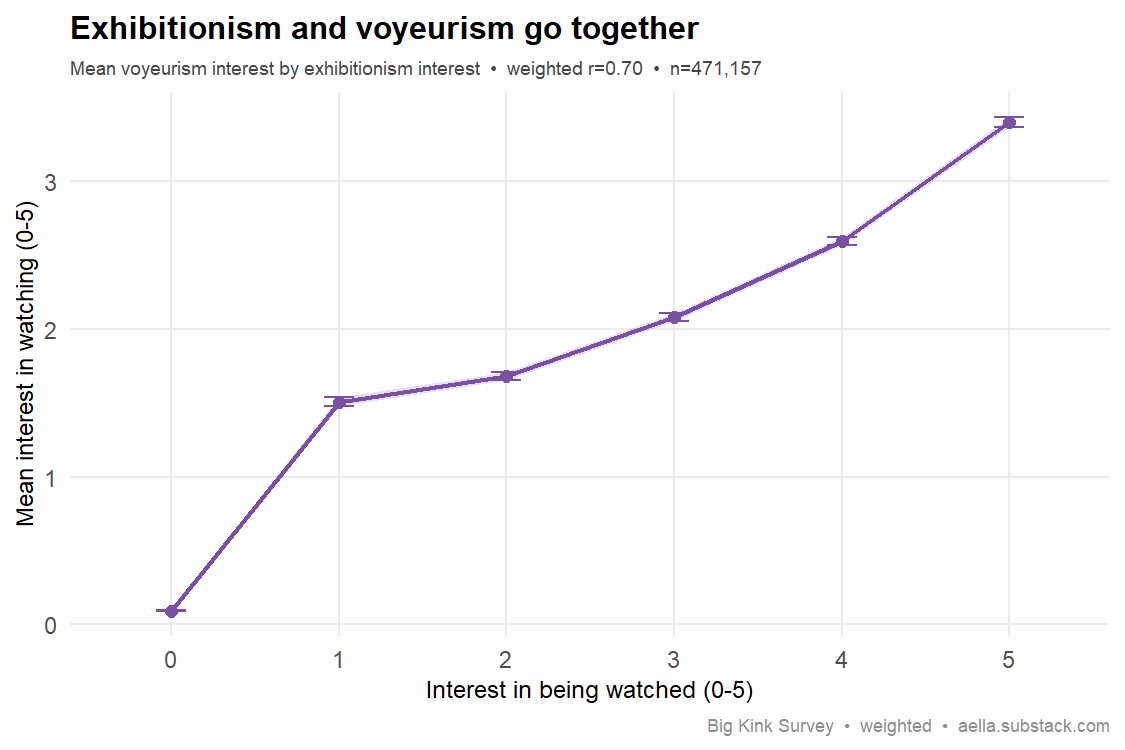
Your data: Strong positive link (weighted r = 0.70): interest in being watched and interest in watching rise together. Among the cleanest correlations here. Both items sit behind the combined exhibitionism/voyeurism category gate: the 57% (weighted) who didn't endorse it count as zero on both by design, which anchors the population-level correlation. The link also holds inside the gate — among respondents with any exhibitionist or voyeurist interest, r = 0.32 with a clearly positive gradient — so the clustering isn't just the shared gate.
Survey question(s) asked
- “I find being a sexual exhibitionist to be:” (tip: This means ‘showing off sexuality’, typically publicly, like streaking or public sex) — Not arousing / Slightly arousing / Somewhat arousing / Moderately arousing / Very arousing / Extremely arousing
- “I find being a voyeur to be:” (tip: This means ‘watching others sexually’, typically publicly or without permission, such as peeping toms) — same arousal scale
- Raw scores 0/1/2/3/5/8 are stored as ordinal 0–5 in the cleaned data (the chart axes).
- Both items are asked only of respondents who checked “Exhibitionism/voyeurism (peeping tom, flashing, public sex, etc.)” on the kink-category checklist; respondents who didn’t check the category are counted as 0 (“not arousing”) on both items by design.
46. Porn use → broader sexual interests Replicates
The claim: More pornography use is associated with a wider, more varied sexual repertoire.
Best: Herbenick, Fu, Wright, Paul, Gradus, Bauer & Jones (2020), “Diverse Sexual Behaviors and Pornography Use,” Journal of Sexual Medicine 17(4):623–633 — nationally representative; greater porn-use frequency associated with engaging in a wider range of sexual behaviors. link Backup: Sun, Bridges, Johnson & Ezzell (2016), “Pornography and the Male Sexual Script,” Archives of Sexual Behavior 45(4):983–994 (porn-shaped sexual preferences). link
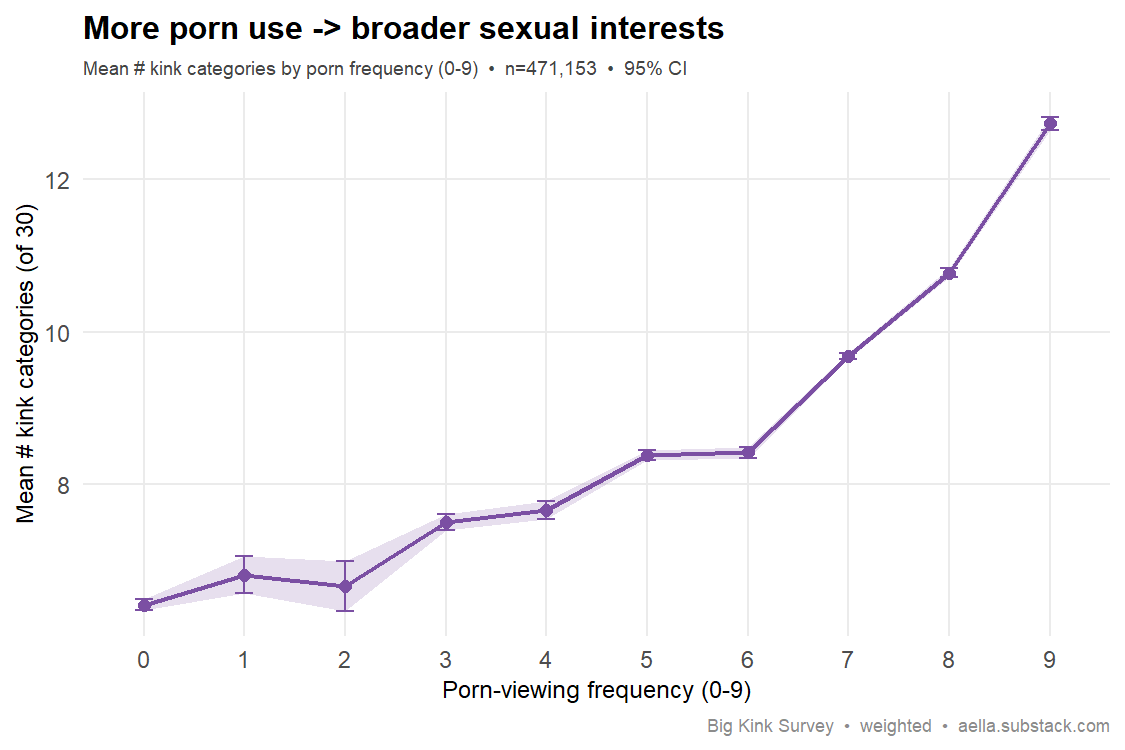
Your data: Strong — kink breadth roughly doubles from light to heavy porn users (6.4 → 12.7). Direction of causality is open (does porn broaden interests, or do broad interests drive porn use?), but the association is robust.
Survey question(s) asked
- “How often do you watch or read pornographic/erotic content?” (tip: for the purposes of getting aroused) — I don’t (0) / Less than once a year (1) / Once a year (2) / A few times a year (3) / Once a month (4) / A few times a month (5) / Once a week (6) / Multiple times a week (7) / Daily (8) / Multiple times a day (9)
- “Common things: Check all the following categories that contain a thing that arouses you.” — checkbox, 17 categories (Bondage, Clothing, Sadomasochism, Power dynamics & D/s, etc.)
- “Uncommon things: Check all the following categories that contain a thing that arouses you.” — checkbox, 13 categories (Genderplay, Transformations, Vore, etc.)
- Kink breadth = the number of categories checked across both lists (0–30); respondents who checked none score 0.
47. Liberalism → more kinks Replicates
The claim: Political liberals have more varied sexual interests; conservatives are more sexually conventional.
Best: McDermott, Hatemi & Crabtree (2017), Personality & Individual Differences. link
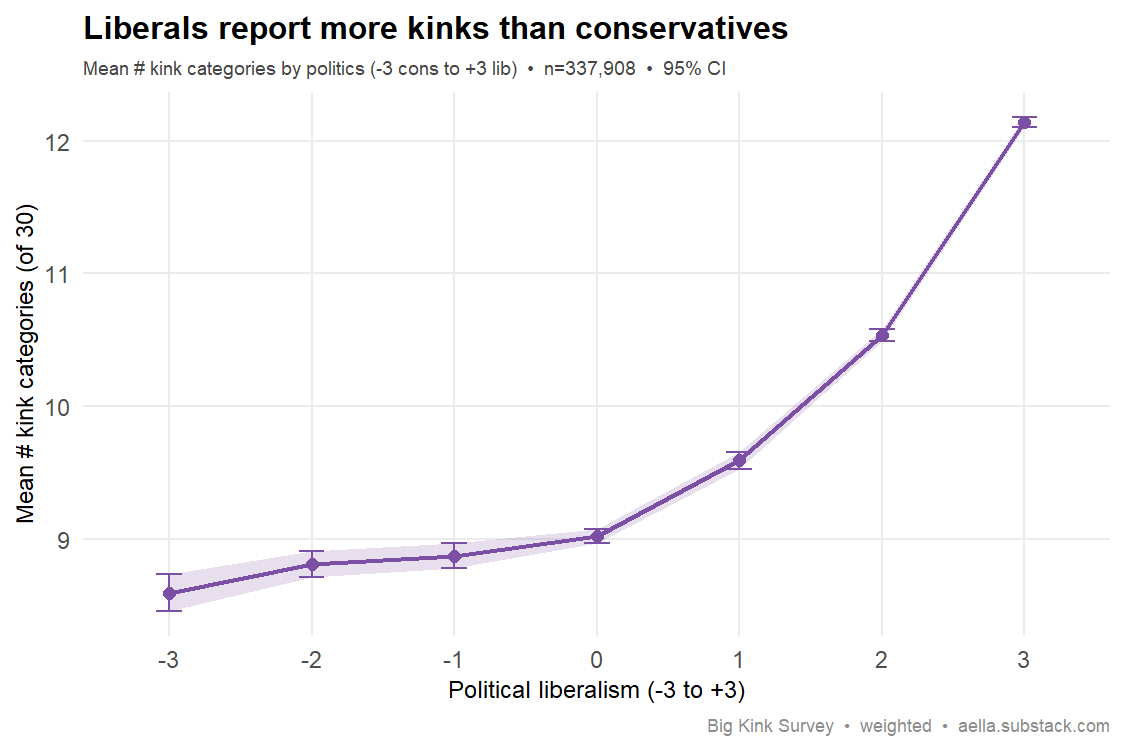
Your data: Kink-category breadth rises from 8.6 (most conservative) to 12.1 (most liberal) — liberals report notably more varied interests. Replicates.
Survey question(s) asked
- “Economically speaking, you tend to be more” — Significantly liberal/left (+3) / Moderately liberal/left (+2) / Slightly liberal/left (+1) / Equally liberal/conservative (0) / Slightly conservative/right (−1) / Moderately conservative/right (−2) / Significantly conservative/right (−3)
- “Socially speaking, you tend to be more” — same 7-point liberal/conservative scale
- “Common things: Check all the following categories that contain a thing that arouses you.” — checkbox, 17 categories
- “Uncommon things: Check all the following categories that contain a thing that arouses you.” — checkbox, 13 categories
- The x-axis is the average of the two politics items (−3 most conservative to +3 most liberal). These items are from earlier survey versions — the survey later condensed politics into a single left/right question.
- Kink breadth = the number of categories checked across both checklists (0–30) — not a self-rating of how broad your interests feel.
48. Religiosity → less porn use Replicates
The claim: More religious people use less pornography.
Best: Perry (2018), J. Sex Research 55(3), “Not Practicing What You Preach” — religiously committed Americans are less likely to view pornography. link · Backup: Wright (2012), J. Sex Research 50(1), “U.S. Males and Pornography, 1973–2010” — religiosity negatively predicts pornography use.
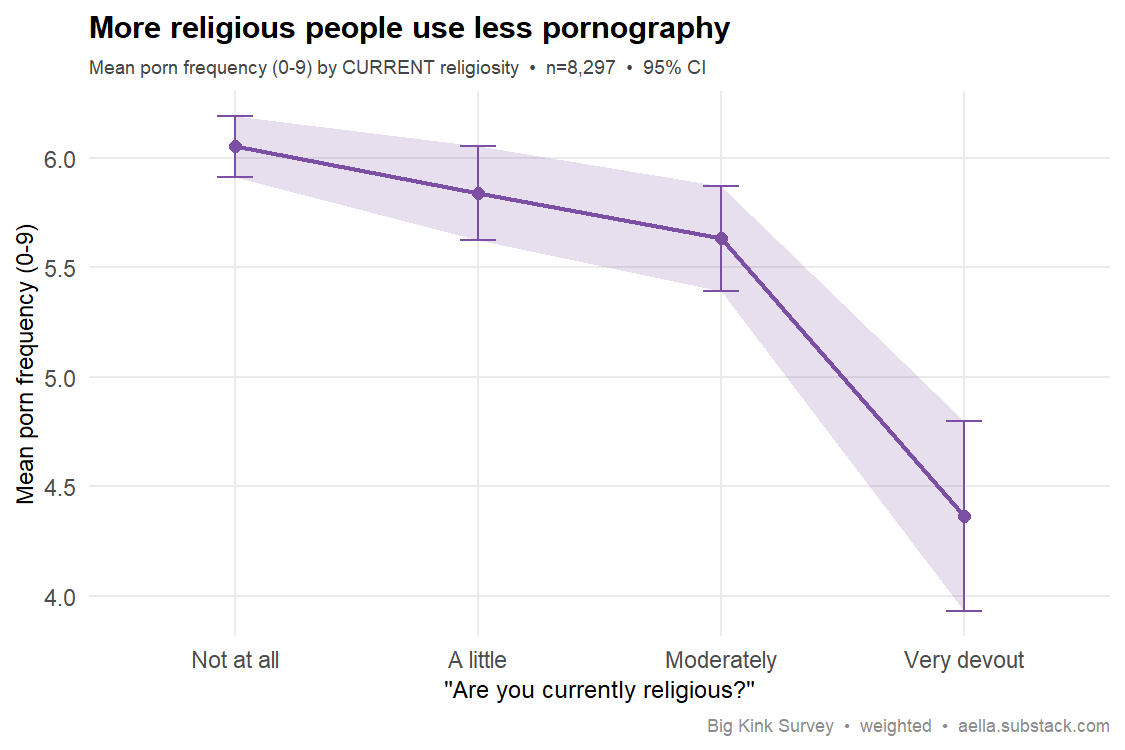
Your data: Using the actual "Are you currently religious?" item, porn frequency falls cleanly with religiosity: 6.05 (not at all) → 5.84 → 5.63 → 4.36 (very devout). Replicates. Construct note: this uses the current-religiosity item (n≈8k; recently added) — present religious commitment, the construct the literature is about. The religion someone was raised in barely moves porn use (denomination means all sit ~5.8–6.3); current devoutness is what does.
Survey question(s) asked
- “Are you currently religious?” (tip: A ‘relationship with Jesus’ does count as religious for this question) — No (0) / A little (1) / Yes, moderately (2) / Yes, very devout (3)
- “How often do you watch or read pornographic/erotic content?” (tip: for the purposes of getting aroused) — I don’t (0) / Less than once a year (1) … Daily (8) / Multiple times a day (9), 10-point frequency scale
- The current-religiosity item is a recent addition to the survey, so this chart covers only the ≈8,000 respondents who were asked it.
Personality & individual differences
49. Neuroticism → more mental illness Replicates
The claim: Neuroticism is the single strongest personality predictor of mental illness (internalizing disorders especially).
Best: Kotov, Gamez, Schmidt & Watson (2010), Psychological Bulletin (meta-analysis, 175 studies). link · Backup: Lahey (2009), American Psychologist. link
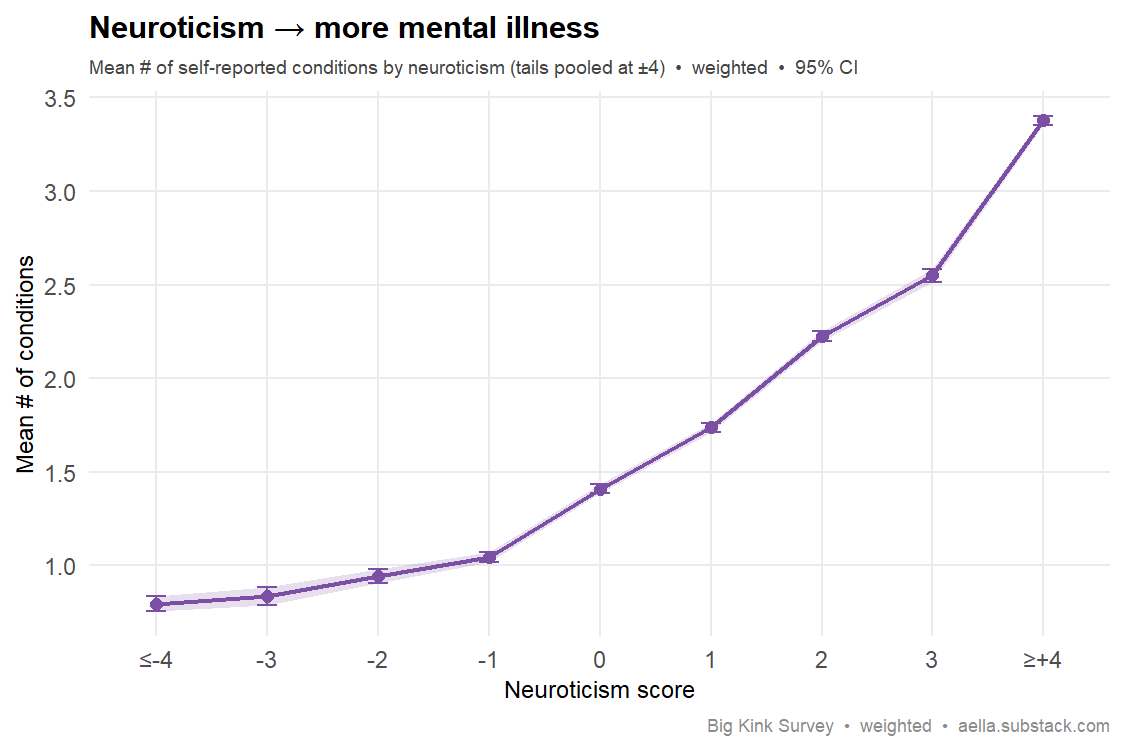
Your data: A steep, clean gradient — mean number of self-reported conditions climbs 0.8 → 3.4 across the neuroticism scale (weighted r ≈ 0.39, and ≈0.34 within each sex). One of the strongest relationships in the whole report.
Survey question(s) asked
- “I worry about things.” — Totally agree (+3) / Agree / Somewhat agree / Neither agree nor disagree (0) / Somewhat disagree / Disagree / Totally disagree (−3)
- “I am relaxed most of the time” — same 7-point agreement scale
- “Do you have any of the following” — checkbox list of 19 conditions (tip: “Please only check if they're 'moderate to severe'”)
- Neuroticism score = “I worry about things.” minus “I am relaxed most of the time” (−6 to +6). The outcome is the number of conditions checked (0–19) — self-reported, not diagnoses.
50. Openness → higher IQ Replicates
The claim: Openness to experience correlates positively with intelligence (r ≈ .2–.3).
Best: Ackerman & Heggestad (1997), Psychological Bulletin 121(2):219–245 (meta-analysis: Openness/typical intellectual engagement correlates positively with intelligence, r ≈ .2–.3). link · Backup: DeYoung, Quilty, Peterson & Gray (2014), Journal of Personality Assessment 96(1):46–52, “Openness to Experience, Intellect, and Cognitive Ability.” link
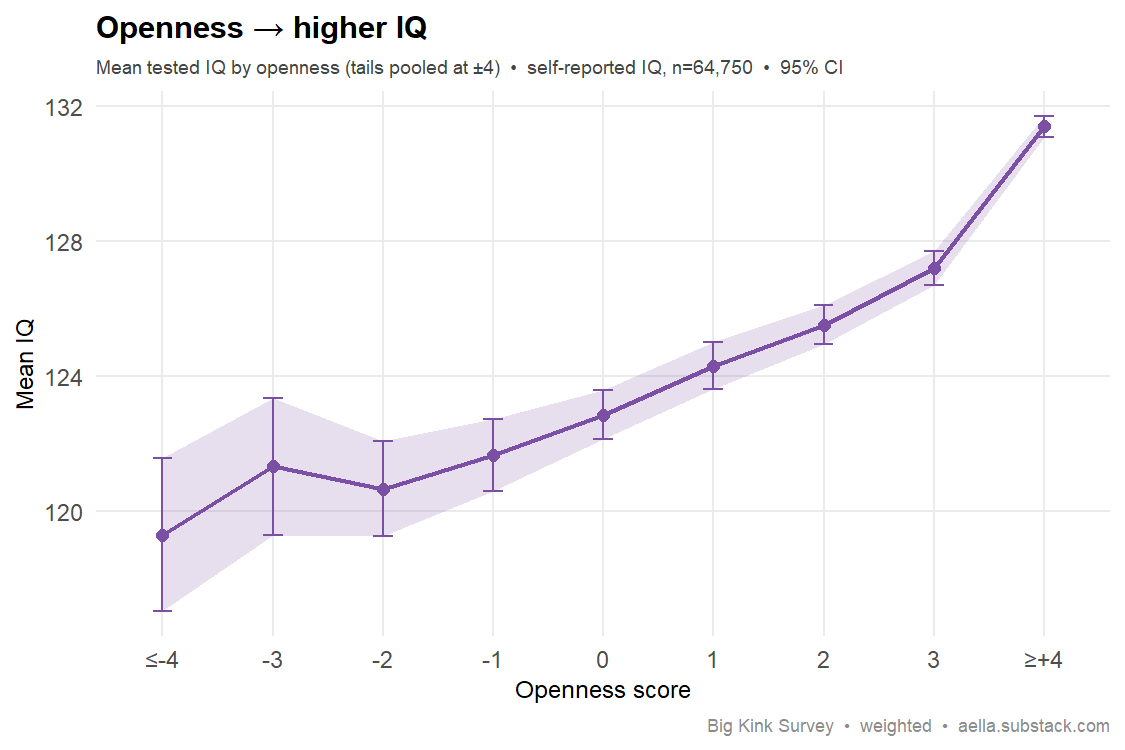
Your data: Mean tested IQ rises 119 → 131 across openness (weighted r ≈ 0.22) — solid replication. Two caveats: the literature pins this more to the "Intellect" aspect than experiential openness, and IQ here is self-reported "tested IQ" (self-selected subsample).
Survey question(s) asked
- “I have excellent ideas” — Totally agree (+3) … Totally disagree (−3), 7-point agreement scale
- “I have difficulty understanding abstract ideas” — same 7-point agreement scale
- “Have you had an officially administered IQ test?” — No / No, but have done a high-quality online test on my own / Yes → if Yes: “Your officially tested IQ result is:” (free number entry)
- Openness score = “I have excellent ideas” minus “I have difficulty understanding abstract ideas” (−6 to +6). IQ comes only from respondents who answered “Yes” (officially administered test); values outside 70–170 are dropped in cleaning.
51. Conscientiousness → fewer mental illnesses Replicates (weak)
The claim: Low conscientiousness is associated with more psychopathology; conscientiousness is broadly protective.
Best: Kotov, Gamez, Schmidt & Watson (2010), Psychological Bulletin. link
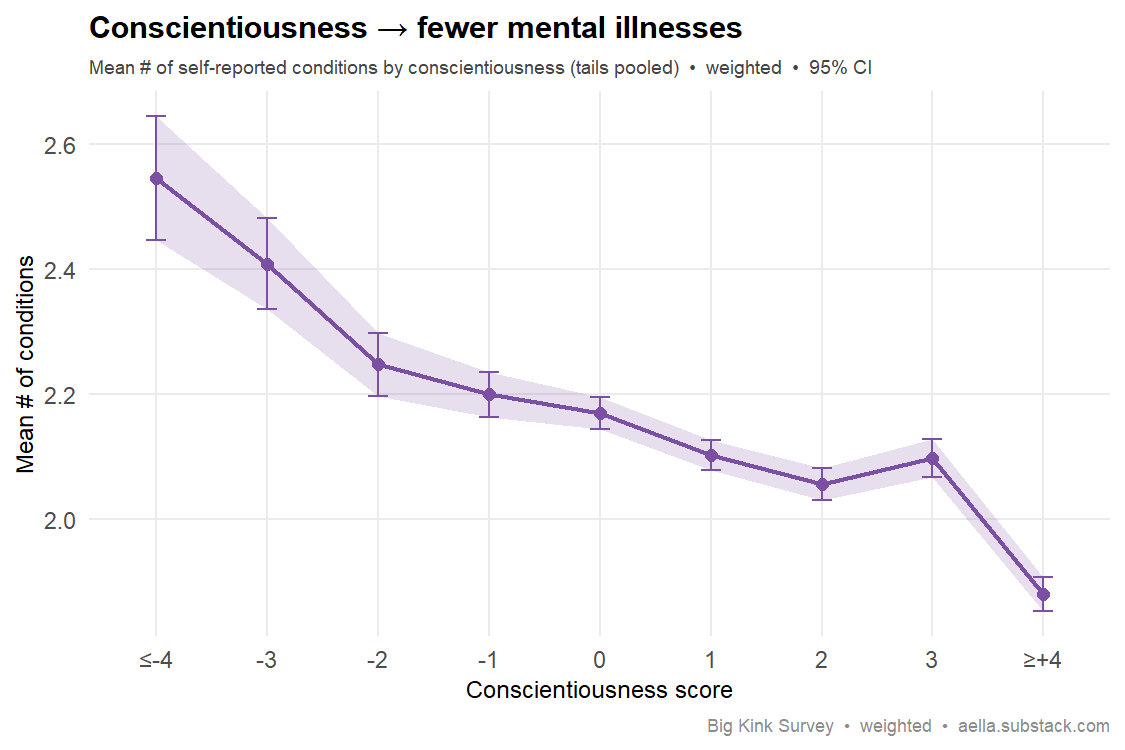
Your data: A weak protective gradient — self-reported conditions fall 2.5 → 1.9 from least to most conscientious (tails pooled; weighted r ≈ −0.05, and −0.06/−0.07 within women/men). The direction matches the literature and holds in both sexes, but the effect is far smaller than the meta-analytic |r| ≈ 0.2–0.4 — the brief two-item conscientiousness measure here likely attenuates it.
Survey question(s) asked
- “I like order” — Totally agree (+3) … Totally disagree (−3), 7-point agreement scale
- “I shirk my duties” — same 7-point agreement scale
- “Do you have any of the following” — checkbox list of 19 conditions (tip: “Please only check if they're 'moderate to severe'”)
- Conscientiousness score = “I like order” minus “I shirk my duties” (−6 to +6). The outcome is the number of conditions checked (0–19).
52. Neuroticism is higher in women Replicates
The claim: Women score higher than men on neuroticism (the largest Big Five sex difference, d ≈ .3–.5).
Best: Costa, Terracciano & McCrae (2001), J. Personality & Social Psychology (26 cultures). link · Backup: Schmitt, Realo, Voracek & Allik (2008), JPSP (55 cultures). link
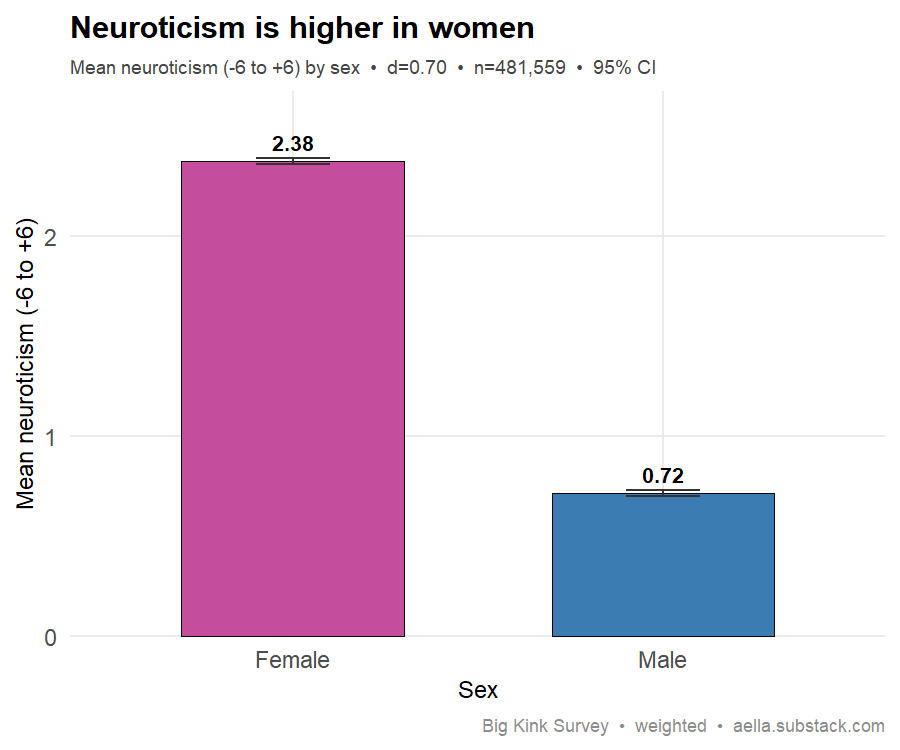
Your data: Women score markedly higher (2.4 vs 0.7; d ≈ 0.7) — at or above the top of the classic sex-difference range.
Survey question(s) asked
- “I worry about things.” — Totally agree (+3) … Totally disagree (−3), 7-point agreement scale
- “I am relaxed most of the time” — same 7-point agreement scale
- “Which category fits you best?” — Man (cis) / Man (trans) / Woman (cis) / Woman (trans) / Nonbinary/other (assigned male at birth) / Nonbinary/other (assigned female at birth)
- Neuroticism score = “I worry about things.” minus “I am relaxed most of the time” (−6 to +6). The chart’s Female/Male groups are birth sex derived from the gender item, not gender identity.
53. Agreeableness is higher in women Replicates
The claim: Women score higher than men on agreeableness (d ≈ .3–.5).
Best: Costa, Terracciano & McCrae (2001), J. Personality & Social Psychology. link
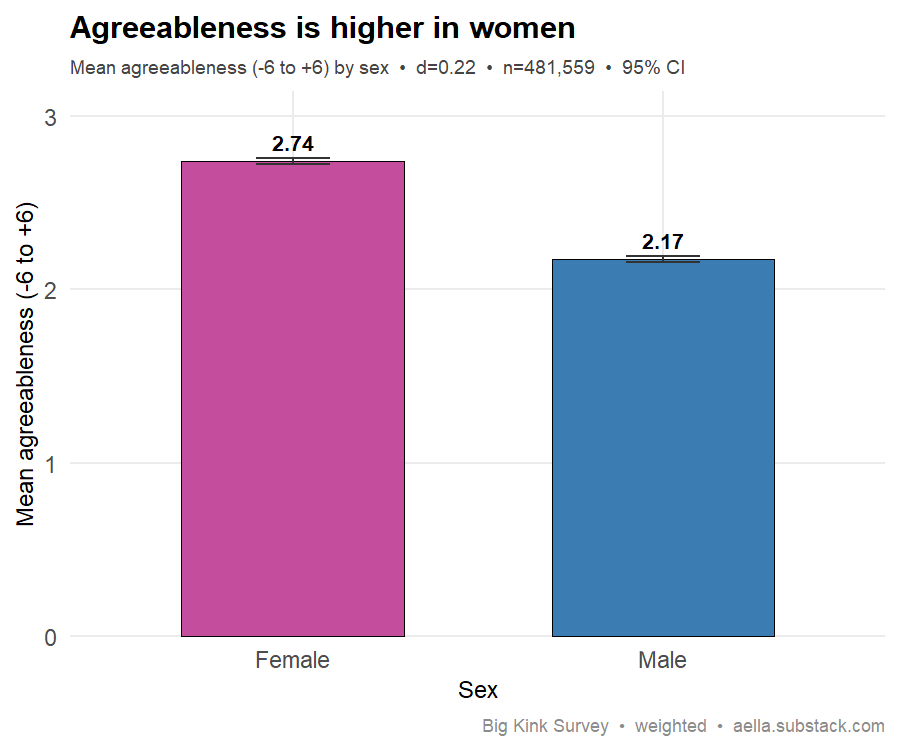
Your data: Women higher (2.7 vs 2.2; d ≈ 0.2) — same direction as the literature, a bit smaller than the neuroticism gap.
Survey question(s) asked
- “I sympathize with others’ feelings” — Totally agree +3 / Agree +2 / Somewhat agree +1 / Neither agree nor disagree 0 / Somewhat disagree −1 / Disagree −2 / Totally disagree −3
- “I feel little concern for others” — same 7-point agree scale
- “Which category fits you best?” — Man (cis) / Man (trans) / Woman (cis) / Woman (trans) / Nonbinary/other (assigned male/female at birth)
- Agreeableness here is a two-item score: the “sympathize” item minus the “little concern” item, giving a −6 to +6 range. The sex comparison uses biological sex derived from the category item.
54. Taller people → higher IQ Replicates (small)
The claim: Height correlates positively with intelligence (small, r ≈ .1–.2, partly within-sex).
Best: Case & Paxson (2008), J. Political Economy ("Stature and status"). link · Backup: Silventoinen et al. (2006), Genes, Brain and Behavior. link
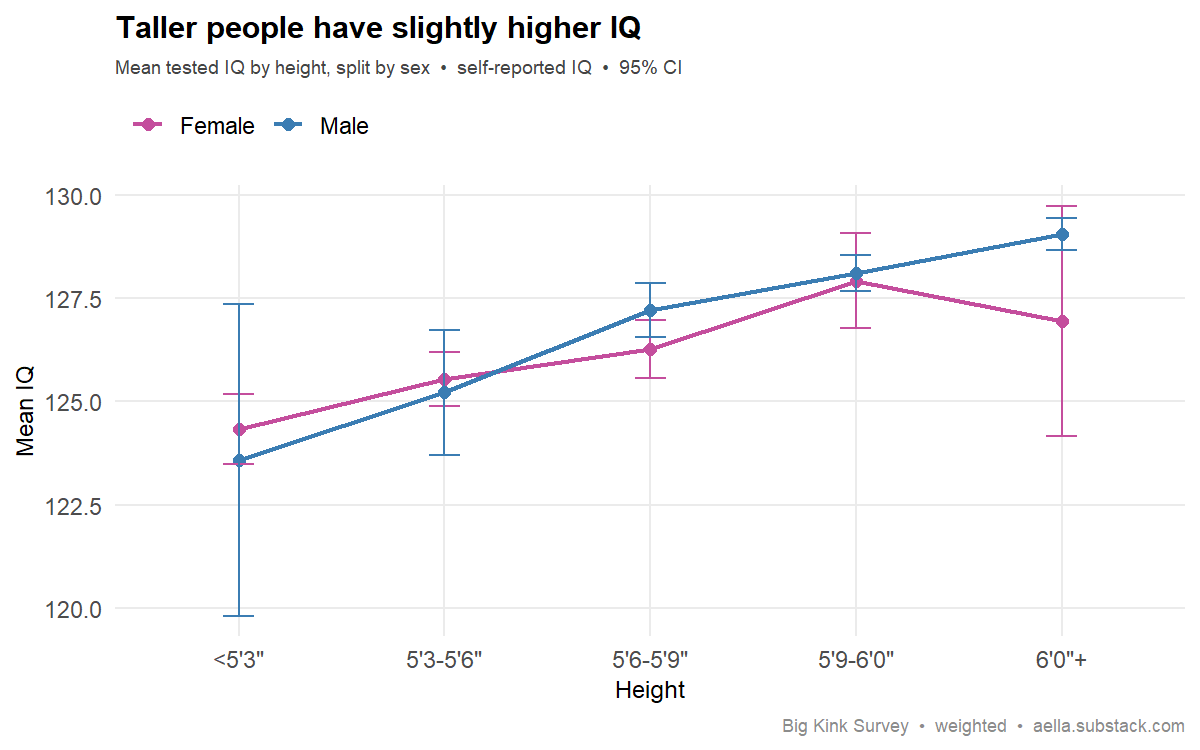
Your data: A small positive height–IQ slope shows up within each sex (≈124 → 129 in men). Worth splitting: men are both taller and report higher tested IQ, so the pooled correlation (r ≈ .10) overstates it; within-sex it's ≈.06, matching the genuinely small effect in the literature.
Survey question(s) asked
- “Have you had an officially administered IQ test?” — No / No, but have done a high-quality online test on my own / Yes
- “Your officially tested IQ result is:” — number, entered freely; only asked if the previous answer was “Yes”
- “What's your height?” — banded options from <5'0" (<152cm) to 6'6+ (198cm) in one-inch steps
- Only respondents reporting an officially administered test are included — the online-test score is a separate field and isn’t used here. Reported scores outside 70–170 are dropped in cleaning. The sex split uses biological sex from the “Which category fits you best?” item.
Mental health & comorbidity
55. Depression ↔ anxiety co-occur Replicates
The claim: Depression and anxiety are highly comorbid — they co-occur far above chance.
Best: Kessler et al. (2005), Archives of General Psychiatry (National Comorbidity Survey-R). link
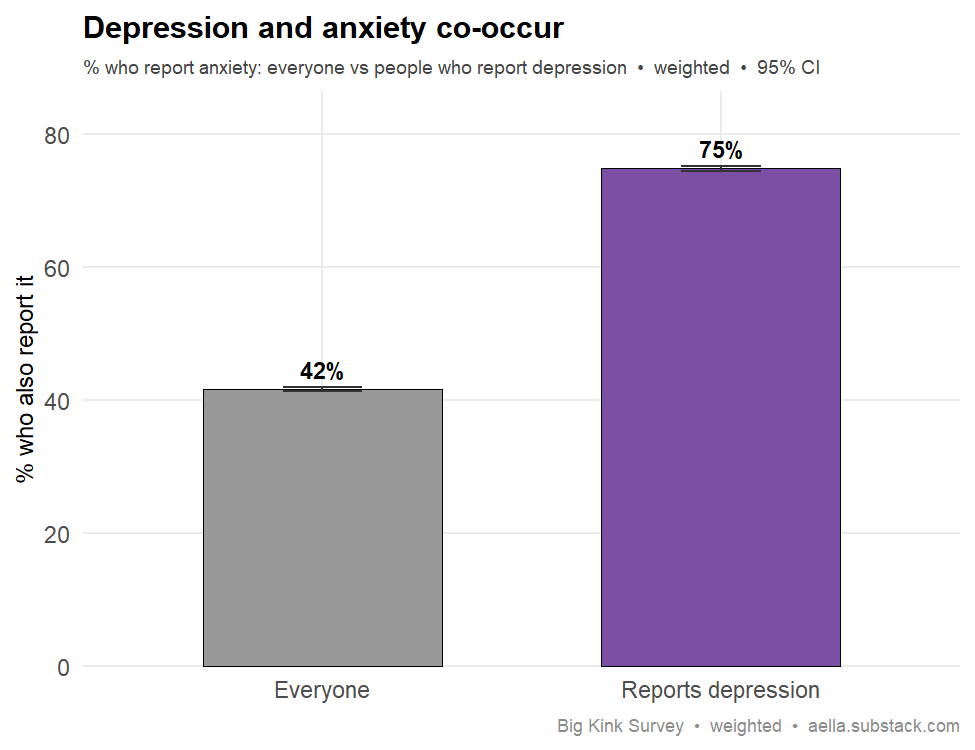
Your data: 75% of people with depression also report anxiety, vs 42% overall — the textbook internalizing comorbidity.
Survey question(s) asked
- “Do you have any of the following” — checkbox list of 21 conditions (tip: “Please only check if they're 'moderate to severe'”); this card uses the “Depression” and “Anxiety” boxes, each checked vs not checked
- Respondents who didn’t check a condition are counted as not having it. This is self-report of having the condition, not a question about clinical diagnosis.
56. Autism ↔ ADHD co-occur Replicates
The claim: ADHD is the most common condition co-occurring with autism.
Best: Lai et al. (2019), The Lancet Psychiatry (meta-analysis of autism comorbidity). link
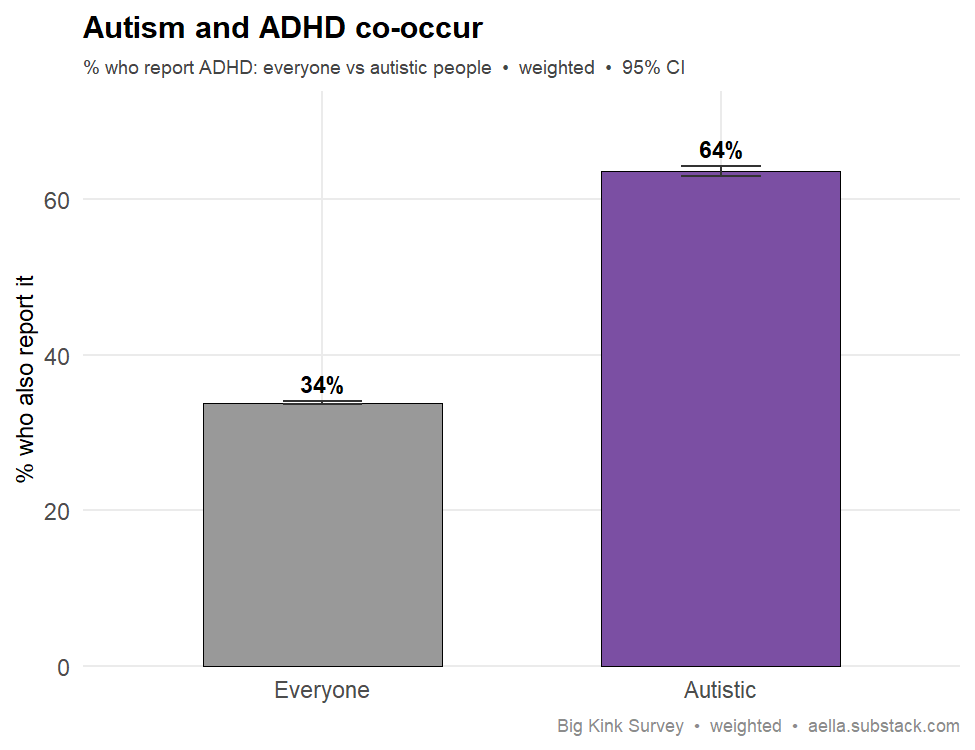
Your data: 64% of autistic respondents also have ADHD, vs 34% overall — exactly the dominant co-occurrence the literature describes.
Survey question(s) asked
- “Do you have any of the following” — checkbox list of 21 conditions (tip: “Please only check if they're 'moderate to severe'”); this card uses the “Autism” and “ADHD” boxes, each checked vs not checked
- Respondents who didn’t check a condition are counted as not having it. This is self-report of having the condition, not a question about clinical diagnosis.
57. Autism → higher anxiety Replicates
The claim: Anxiety disorders are substantially elevated in autistic people.
Best: Lai et al. (2019), The Lancet Psychiatry. link
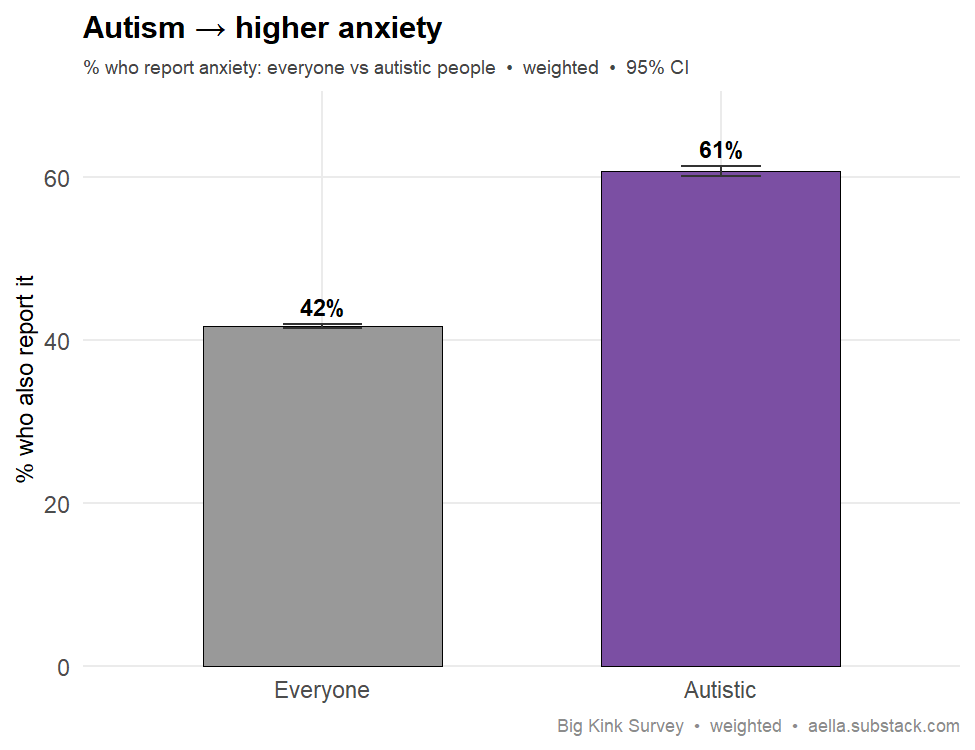
Your data: 61% of autistic respondents report anxiety, vs 42% overall — the elevated-anxiety pattern replicates.
Survey question(s) asked
- “Do you have any of the following” — checkbox list of 21 conditions (tip: “Please only check if they're 'moderate to severe'”); this card uses the “Autism” and “Anxiety” boxes, each checked vs not checked
- Respondents who didn’t check a condition are counted as not having it. This is self-report of having the condition, not a question about clinical diagnosis.
58. Anxiety & depression are higher in women Replicates
The claim: Women have ~1.5–2× the rates of anxiety and depressive disorders (the internalizing sex difference).
Best: McLean et al. (2011), J. Psychiatric Research. link · Backup: Salk, Hyde & Abramson (2017), Psychological Bulletin. link
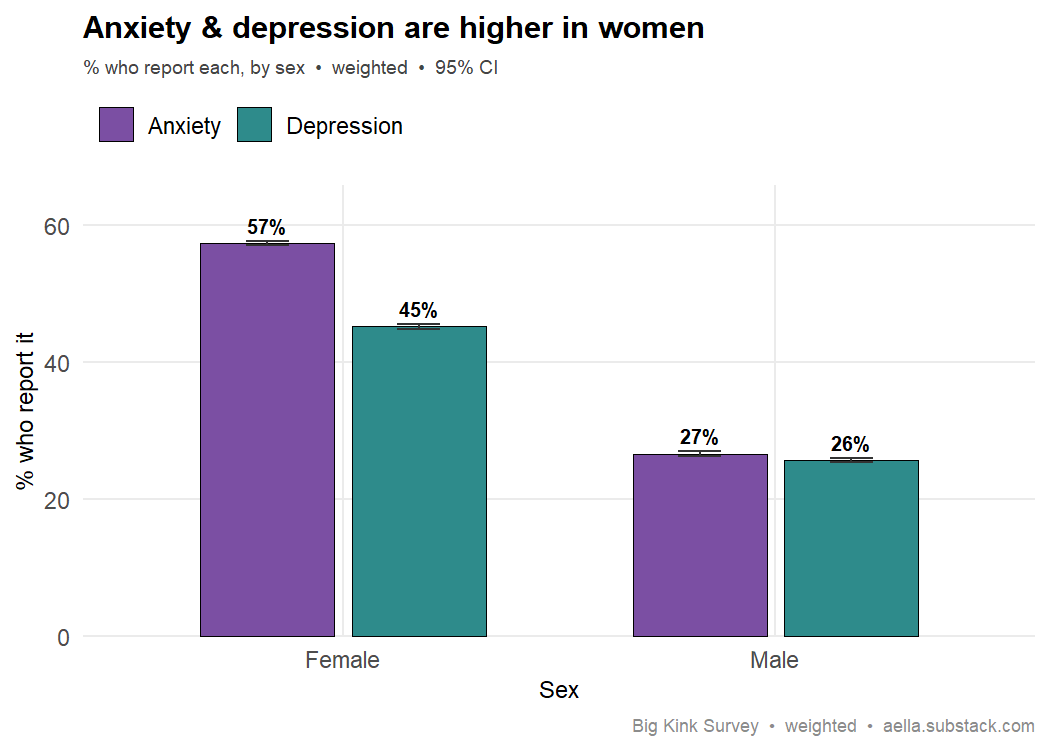
Your data: Both clearly higher in women — anxiety 57% vs 27%, depression 45% vs 26%. Textbook internalizing sex difference.
Survey question(s) asked
- “Do you have any of the following” — checkbox list of 21 conditions (tip: “Please only check if they're 'moderate to severe'”); this card uses the “Anxiety” and “Depression” boxes, each checked vs not checked
- “Which category fits you best?” — Man (cis) / Man (trans) / Woman (cis) / Woman (trans) / Nonbinary/other (assigned male/female at birth); compared as biological female vs male
- Respondents who didn’t check a condition are counted as not having it. This is self-report of having the condition, not a question about clinical diagnosis.
59. Borderline is more common in women Replicates · contested
The claim: BPD is diagnosed far more often in women (~3:1 clinically). Contested: community samples find near-equal prevalence, so the clinical ratio may reflect help-seeking / diagnostic bias.
Best: Skodol & Bender (2003), Psychiatric Quarterly. link · Backup (contests it): Grant et al. (2008), J. Clinical Psychiatry. link
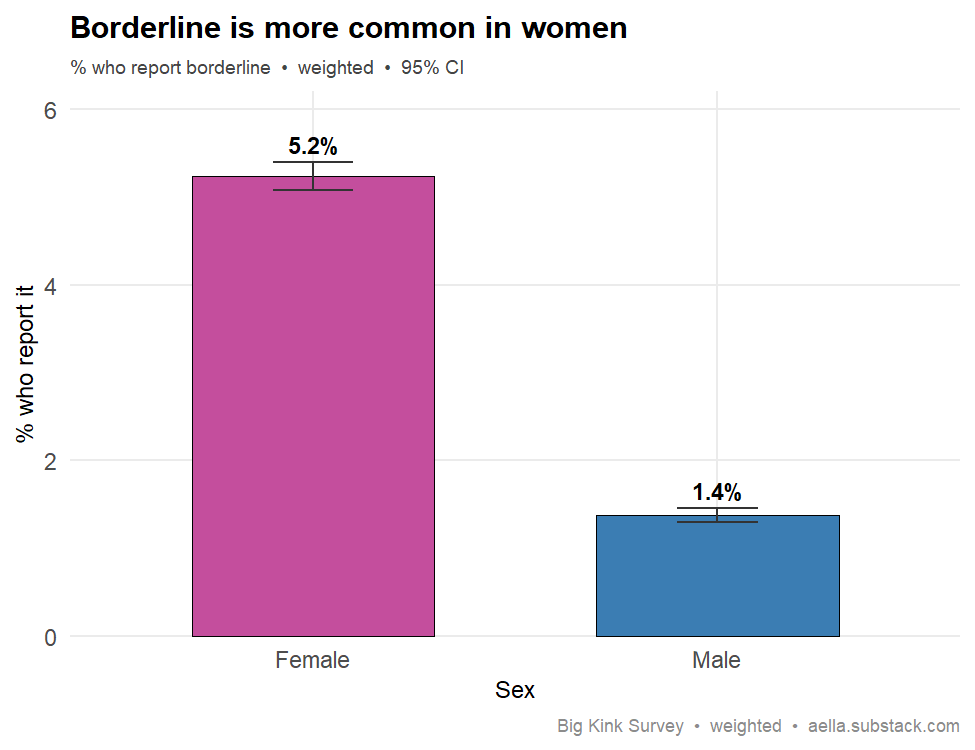
Your data: Women self-report borderline at ~3.7× the male rate (5.2% vs 1.4%) — echoing the clinical pattern. But this is self-identification, not a clinical diagnosis, so it can't separate genuinely higher prevalence from women being readier to self-label as borderline — it echoes the debate rather than settling it.
Survey question(s) asked
- “Do you have any of the following” — checkbox list of 21 conditions (tip: “Please only check if they're 'moderate to severe'”); this card uses the “Borderline” box, checked vs not checked
- “Which category fits you best?” — Man (cis) / Man (trans) / Woman (cis) / Woman (trans) / Nonbinary/other (assigned male/female at birth); compared as biological female vs male
- Respondents who didn’t check the box are counted as not having it. This is self-report of having the condition, not a question about clinical diagnosis — which is exactly the distinction the verdict discusses.
60. Eating disorders are more common in women Replicates
The claim: Eating disorders (anorexia, bulimia) are far more common in women than men.
Best: Hudson, Hiripi, Pope & Kessler (2007), Biological Psychiatry (NCS-R). link
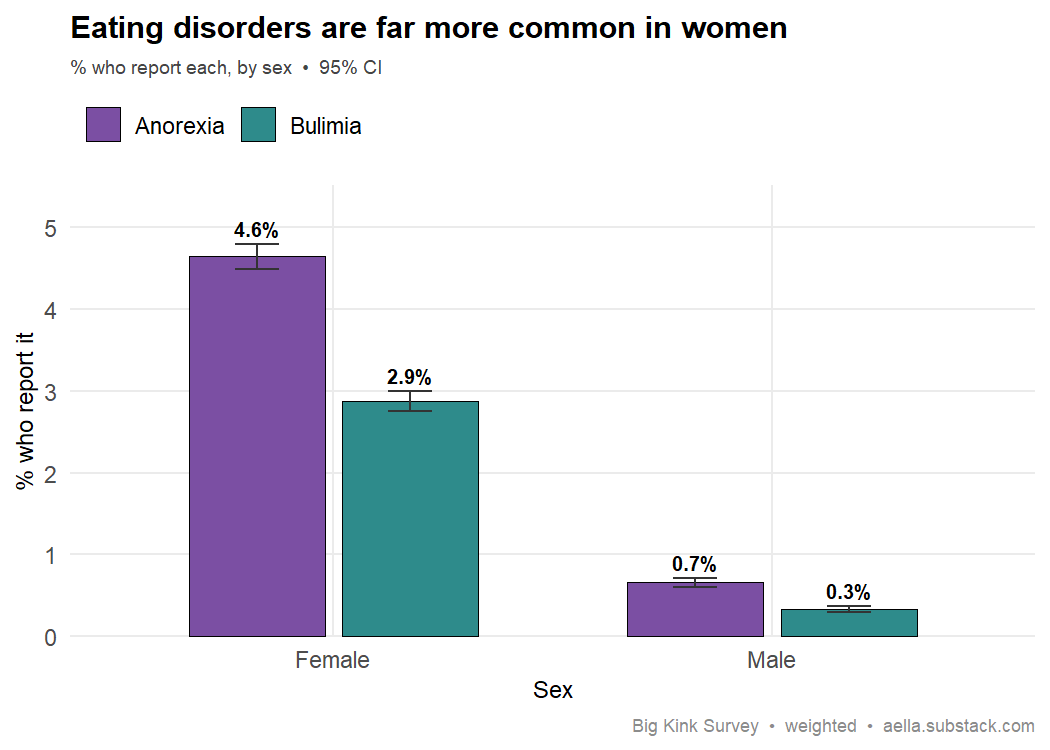
Your data: A strong female skew — anorexia 4.6% vs 0.7%, bulimia 2.9% vs 0.3% (roughly 7–9:1). Textbook eating-disorder sex difference, on self-reported conditions rather than clinical diagnoses.
Survey question(s) asked
- “Do you have any of the following” — checkbox list of 21 conditions (tip: “Please only check if they're 'moderate to severe'”); this card uses the “Anorexia” and “Bulimia” boxes, each checked vs not checked
- “Which category fits you best?” — Man (cis) / Man (trans) / Woman (cis) / Woman (trans) / Nonbinary/other (assigned male/female at birth); compared as biological female vs male
- Respondents who didn’t check a condition are counted as not having it. This is self-report of having the condition, not a question about clinical diagnosis.
More trauma & development
61. Childhood sexual abuse → earlier sexual debut Replicates
The claim: Childhood sexual abuse predicts earlier age at first intercourse.
Best: Noll, Trickett & Putnam (2003), J. Consulting & Clinical Psychology (10-yr prospective; abused females had younger age at first voluntary intercourse, ~14 vs ~15.5, p=.0002). link · Backup: Noll, Shenk & Putnam (2009), J. Pediatric Psychology 34:366 (meta-analytic update; CSA → adolescent pregnancy). link
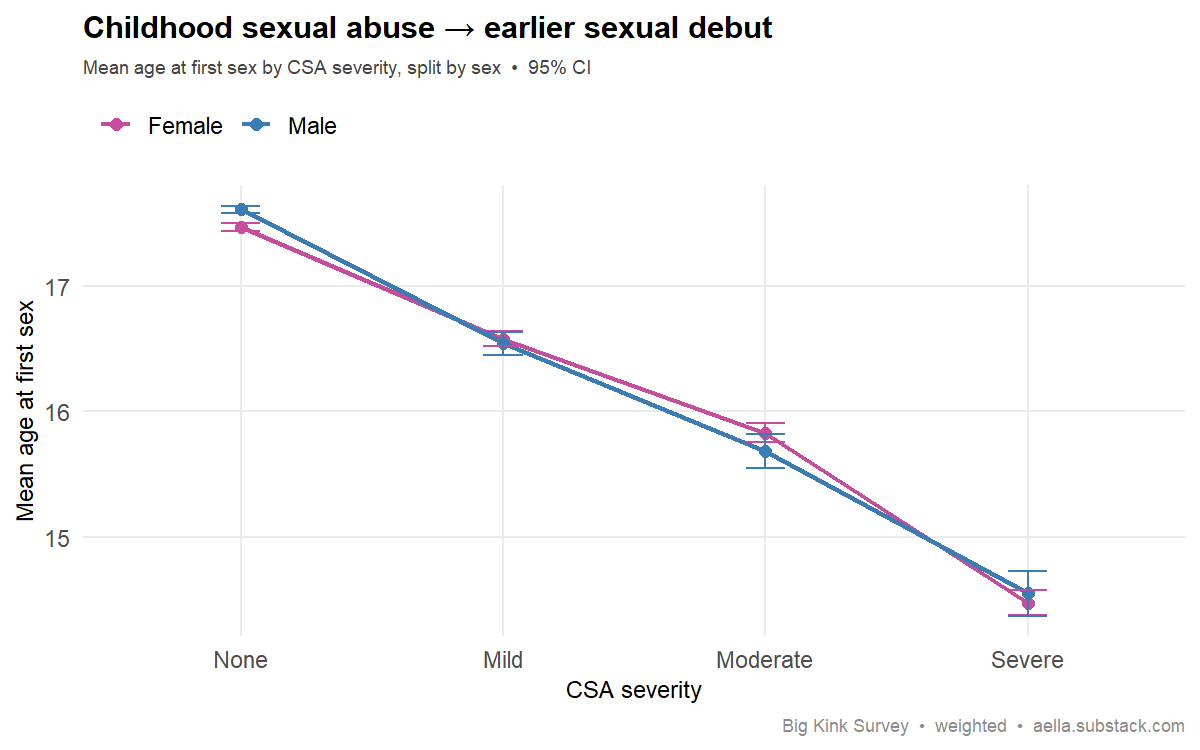
Your data: A strong, steep gradient that's nearly identical in both sexes — mean age at first sex falls from ~17.5 (no abuse) to ~14.5 (severe), about three years earlier. One caveat: the item has no voluntariness qualifier (the cited studies measure first voluntary intercourse), so for abused respondents the first event can be the abuse itself — 33% of the severe group report first intercourse at 12 or younger, vs 1% of the non-abused. Excluding that band, debut is ~16.1 (severe) vs ~17.6 (none): the gradient halves to about 1.5 years but stays clear in both sexes. Replicates.
Survey question(s) asked
- “Did you experience sexual assault in your childhood?” — No / Yes, mild / Yes, moderate / Yes, severe
- “At what age did you first have penetrative sexual intercourse?” — “I haven't had sex”, “12 or younger”, then single years 13–25, then 26–30 / 31–35 / 36–40 / 41+
- “Which category fits you best?” — used to split the lines by biological sex
- Age at first sex is banded: “12 or younger” is coded 11 and the grouped bands are coded at midpoints (26–30→28, 31–35→34, 36–40→38, 41+→45). Respondents answering “I haven't had sex” are excluded.
62. Childhood adversity → higher adult BMI Replicates
The claim: Childhood adversity (ACEs) predicts higher adult BMI / obesity.
Best: Felitti et al. (1998), Am. J. Preventive Medicine (the ACE Study). link · Backup: Danese & Tan (2014), Molecular Psychiatry (meta-analysis, 41 studies, OR ≈ 1.36). link
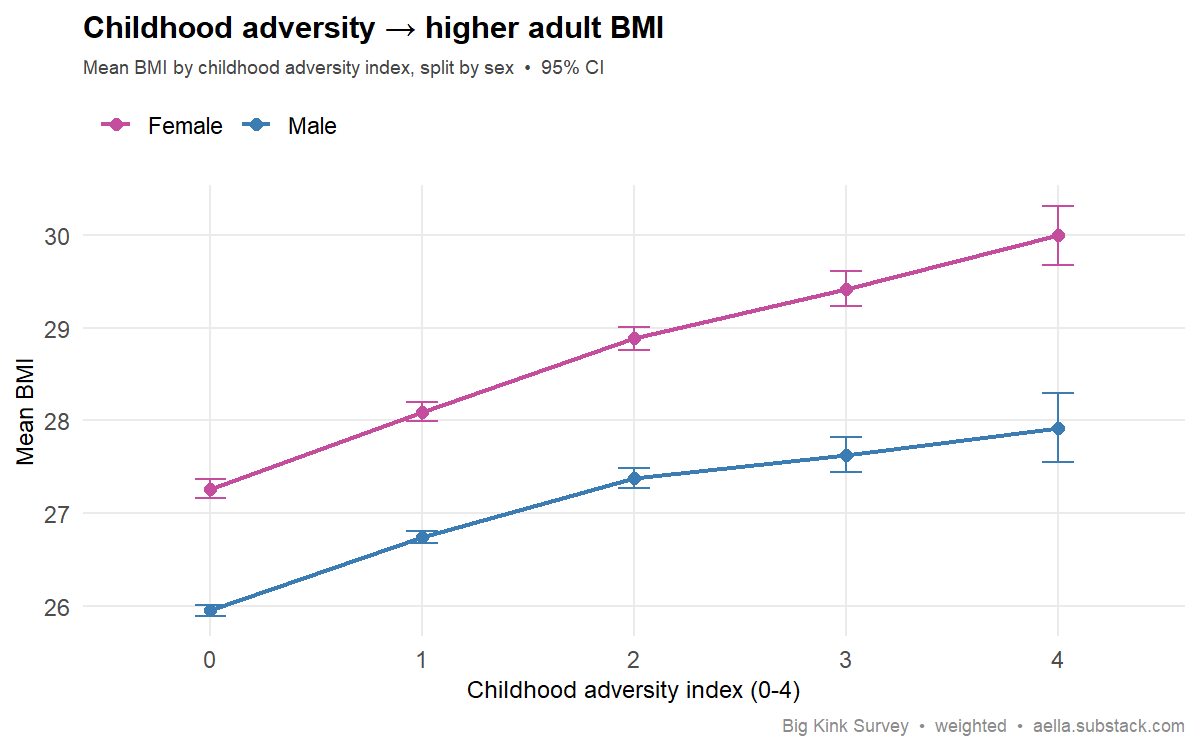
Your data: Mean BMI rises with the adversity index in both sexes — women 27.3 → 30.0 and men 26.0 → 27.9 from 0 to 4 adversities. Modest but monotonic, matching the ACE–obesity dose-response.
Survey question(s) asked
- “Did you experience sexual assault in your childhood?” — No / Yes, mild / Yes, moderate / Yes, severe (any “Yes” counts as one adversity)
- “Which best describes your parents' presence in your lives?” — Both mother and father present / Mother present, father absent / Father present, mother absent / Both mother and father absent (father absent and mother absent each count as one adversity)
- “From the ages of 0-14, how often were you spanked as a form of discipline?” — Never / Rarely / Sometimes / Often / Very regularly (“Often” or “Very regularly” counts as one adversity)
- “How "sexually liberated" was your upbringing?” — Highly repressed / Moderately repressed / Slightly repressed / Equally repressed/liberated / Slightly liberated / Moderately liberated / Highly liberated (“Moderately” or “Highly repressed” counts as one adversity)
- “What's your height?” and “Your weight is closest to:” — banded options (height in one-inch steps, weight in 20-lb steps); BMI is computed from these two items
- The x-axis is a BKS-specific adversity index: the number of the four flags above present (childhood sexual assault, father absent, mother absent, frequent spanking, repressed upbringing), capped at 4. It is not the standard Felitti ACE questionnaire. Lines are split by biological sex.
Intelligence, ideology & religion
63. Religious upbringing → political conservatism Replicates
The claim: More religious people are more politically conservative (strongest on social issues).
Best: see e.g. Malka, Lelkes, Srivastava, Cohen & Miller (2012), Political Psychology 33(2), 275–299, on the religiosity–conservatism association (and how political engagement moderates it). link Backup: Layman & Carmines (1997), Journal of Politics — religiosity tracks conservatism most strongly on cultural/social issues (abortion, homosexuality, moral traditionalism).
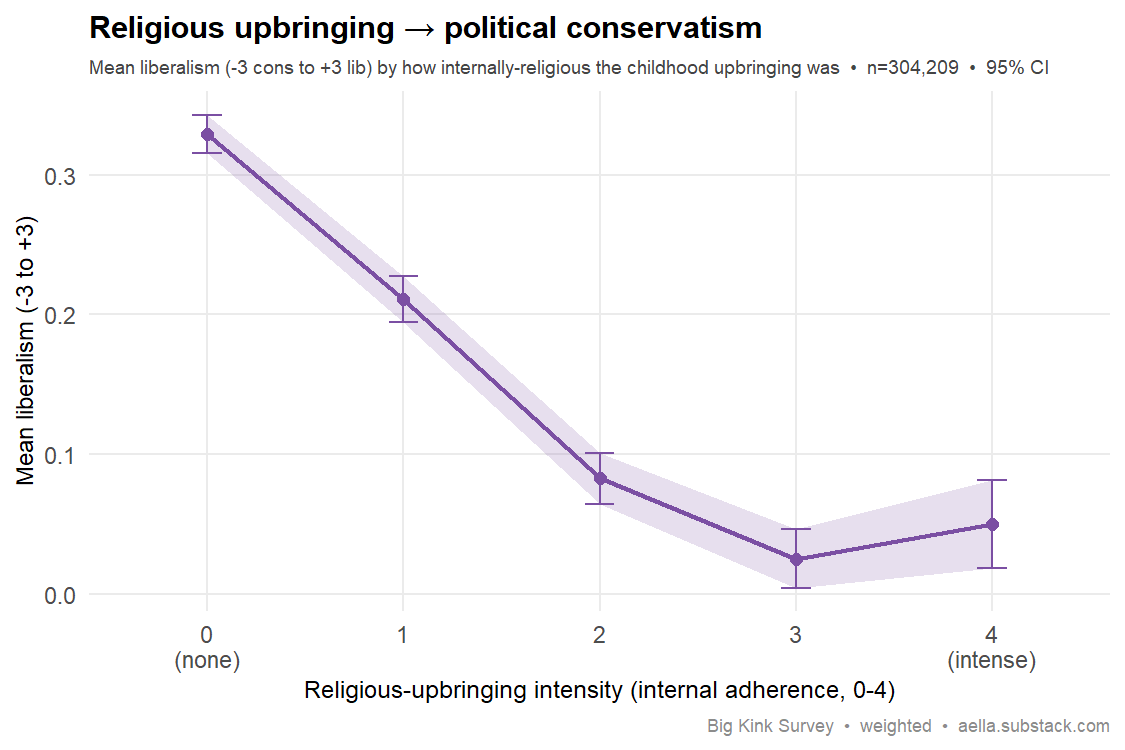
Your data: Mean liberalism falls steadily — +0.33 → +0.21 → +0.08 → +0.03 — as the religious intensity of the childhood upbringing rises, the predicted conservative shift. Construct note: the only religiosity measure that overlaps the politics items is upbringing intensity (how much one's childhood culture emphasized internal religious adherence), not current religiosity — so read this as "religious upbringing → adult conservatism," which is itself well-established.
Survey question(s) asked
- “How important was INTERNAL adherence to the religion? For example: feeling guilty, private prayer, getting "right with god", achieving specific mental states, etc.?” — Not at all important (0) / Slightly important (1) / Moderately important (2) / Very important (3) / Absolutely essentially important (4)
- “Socially speaking, you tend to be more” — Significantly liberal/left (+3) … Equally liberal/conservative (0) … Significantly conservative/right (−3)
- “Economically speaking, you tend to be more” — same 7-point scale
- The adherence item asks about the religion the respondent was raised in and was only asked of respondents whose childhood religion wasn’t “None or performative/casual religion” — it measures upbringing, not current religiosity.
- The liberalism score is the mean of the social and economic items (−3 conservative to +3 liberal). These two politics questions were later condensed into a single item, so this card covers respondents from the two-question era.
64. Women are more religious than men Not seen
The claim: Women are more religious than men — one of the most robust findings in the psychology of religion.
Best: Miller & Stark (2002), American Journal of Sociology 107(6), 1399–1423, “Gender and Religiousness: Can Socialization Explanations Be Saved?” link · Backup: Pew Research Center (2016), The Gender Gap in Religion Around the World. link
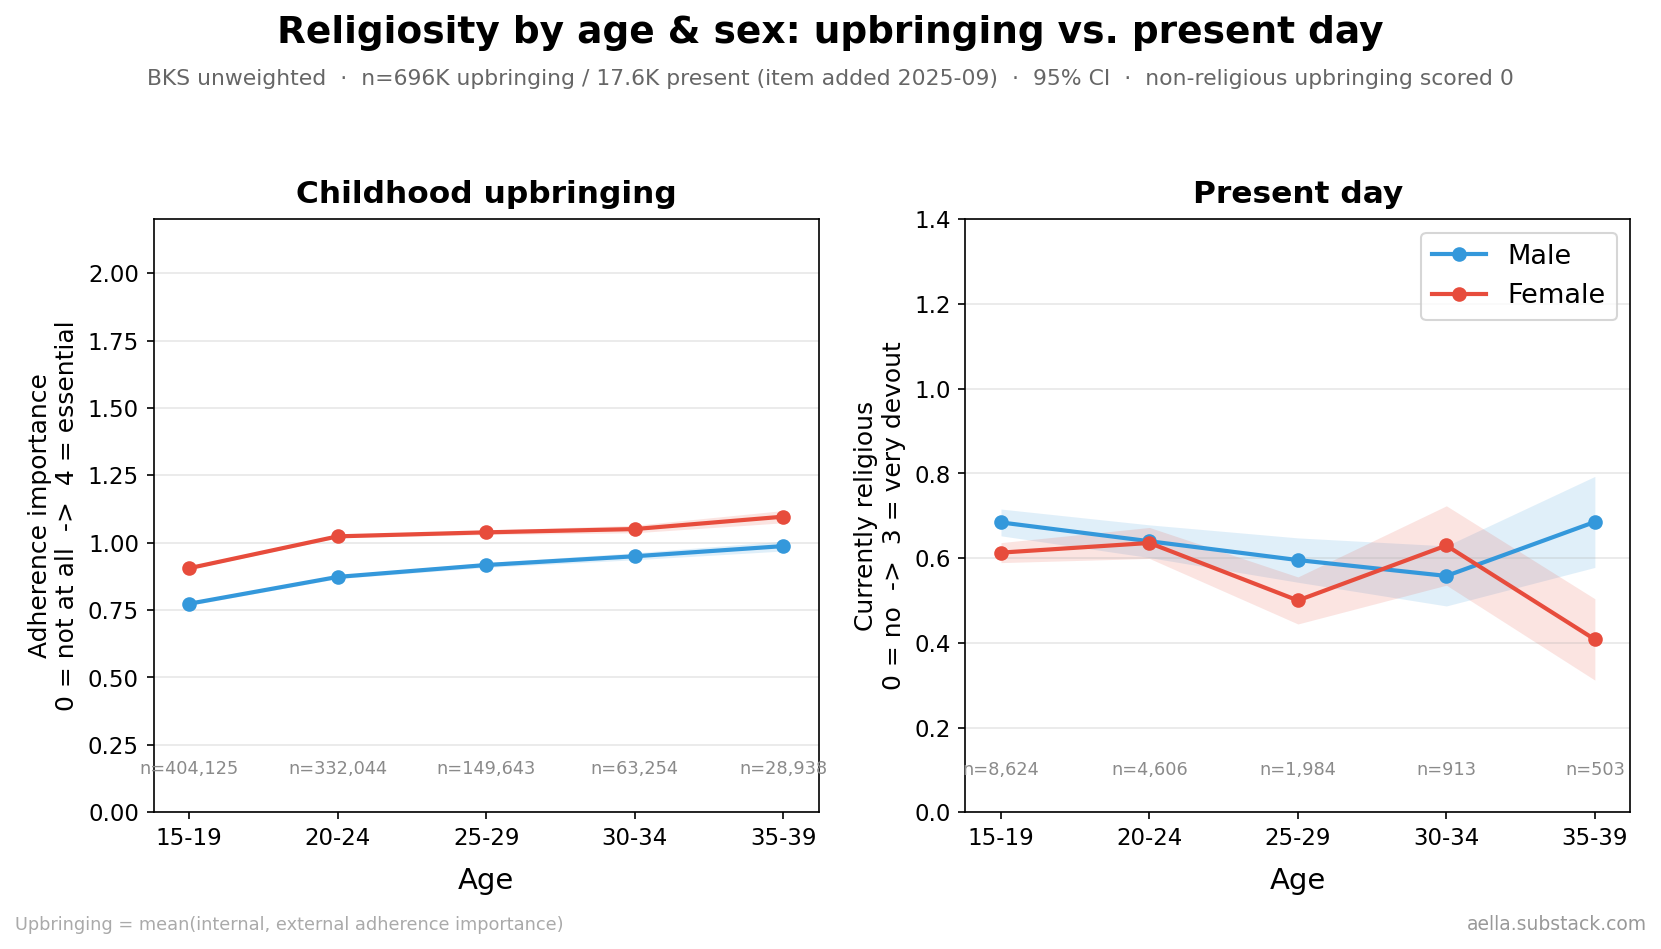
Women are raised more religiously than men at every age (left panel), but by adulthood the gap is gone — present-day religiosity shows no female advantage (right). The classic “women are more religious” pattern is a childhood-upbringing effect, not a current-belief one. (BKS unweighted; upbringing n = 696K, present n = 17.6K, item added 2025-09; shaded 95% CI; upbringing means computed among those raised in a religion.)
Your data: Not seen — essentially no sex gap in current religiosity. On the "Are you religious now?" item (0–3) the difference is trivial and flips sign with the analysis basis: population-weighted, women edge ahead (0.95 vs 0.92; n≈8,300); on the full unweighted sample men do (0.65 vs 0.60; n≈17,760). Either way the gap is ≤0.05 on a 0–3 scale — nothing like the textbook female-religiosity gap. The one place women clearly lead is upbringing: they were raised more religious (1.46 vs 1.31 on the 0–4 childhood item), but that early gap doesn't carry into adult religiosity in this sample. The likely reason: this is a heavily secular, liberal, self-selected sample with little religious variance. Self-report, cross-sectional.
Survey question(s) asked
- “Are you currently religious?” — No (0) / A little (1) / Yes, moderately (2) / Yes, very devout (3) (tip: “A 'relationship with Jesus' does count as religious for this question”)
- “How important was INTERNAL adherence to the religion? For example: feeling guilty, private prayer, getting "right with god", achieving specific mental states, etc.?” — Not at all important (0) / Slightly important (1) / Moderately important (2) / Very important (3) / Absolutely essentially important (4)
- “Which category fits you best?” — Man (cis) / Man (trans) / Woman (cis) / Woman (trans) / Nonbinary/other (assigned male/female at birth); compared as biological female vs male
- The adherence item is the “childhood upbringing” measure: it asks about the religion the respondent was raised in and was only asked of respondents whose childhood religion wasn’t “None or performative/casual religion”. It was retired from the survey in March 2026.
- The “Are you currently religious?” item was added to the survey in September 2025, which is why the present-day panel has a much smaller n than the upbringing panel.
65. Higher IQ → more liberal Replicates (weak)
The claim: Higher intelligence predicts more socially liberal attitudes (small effect, mostly social rather than economic).
Best: Deary, Batty & Gale (2008), Psychological Science ("Bright children become enlightened adults"). link · Backup: Kanazawa (2010), Social Psychology Quarterly. link
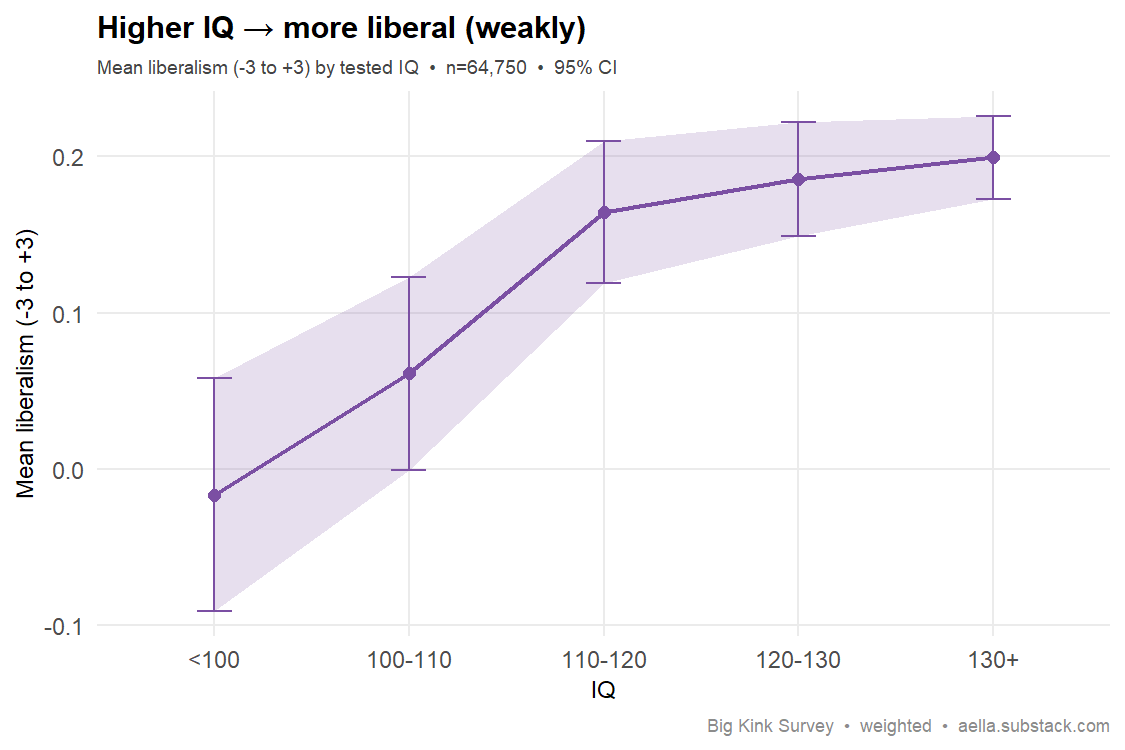
Your data: Mean liberalism climbs from −0.02 (IQ <100) to +0.20 (IQ 130+) — a small but consistent shift toward liberal, in the predicted direction. (Self-reported IQ.)
Survey question(s) asked
- “Have you had an officially administered IQ test?” — No / No, but have done a high-quality online test on my own / Yes
- “Your officially tested IQ result is:” — number, entered freely; only asked if the previous answer was “Yes”
- “Socially speaking, you tend to be more” — Significantly liberal/left (+3) … Equally liberal/conservative (0) … Significantly conservative/right (−3)
- “Economically speaking, you tend to be more” — same 7-point scale
- The liberalism score is the mean of the social and economic items (−3 to +3). IQ comes only from respondents reporting an officially administered test (online-test scores are a separate field, not used); reported scores outside 70–170 are dropped in cleaning.
66. Openness → less religious Not seen full sample
The claim: Openness predicts lower religiosity. The established effect is itself small and direction-dependent (openness relates negatively to fundamentalism but positively to "quest"/spiritual religiosity).
Best: Saroglou (2002), Personality & Individual Differences (meta-analysis). link · Backup: Saroglou (2010), Pers. & Social Psychology Review. link
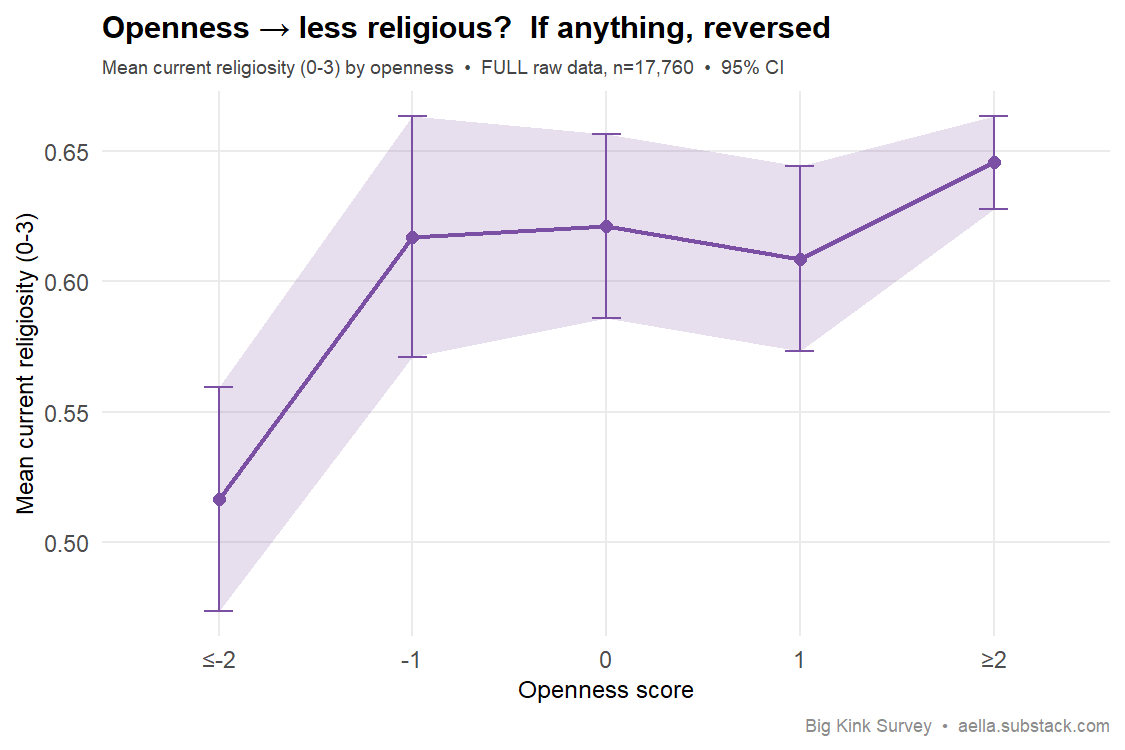
Your data: If anything reversed — on the true current-religiosity item (full raw sample, n≈18k), religiosity nudges up with openness (0.52 at low openness → 0.65 at high). Not the predicted negative link, but fully consistent with the literature's point that open people lean toward exploratory/"quest" religiosity rather than away from religion wholesale.
Survey question(s) asked
- “I have excellent ideas” — +3 Totally agree … −3 Totally disagree (7-point)
- “I have difficulty understanding abstract ideas” — same 7-point agreement scale
- “Are you currently religious?” (tip: “A 'relationship with Jesus' does count as religious for this question”) — No / A little / Yes, moderately / Yes, very devout (coded 0–3)
- Openness here is a 2-item score: the “excellent ideas” rating minus the “abstract ideas” rating (range −6 to +6) — it mostly captures the intellect facet, not the full Big Five openness construct.
67. Religiosity → fewer sexual partners Weak full sample
The claim: More religious people have fewer sexual partners / more restricted sexual behavior.
Best: Regnerus & Uecker (2011), Premarital Sex in America (Oxford Univ. Press). link Backup: Hagen, Thompson & Williams (2018), “Religiosity Reduces Sexual Aggression and Coercion in a Longitudinal Cohort of College Men,” J. for the Scientific Study of Religion — greater religiosity prospectively predicted less promiscuity. link
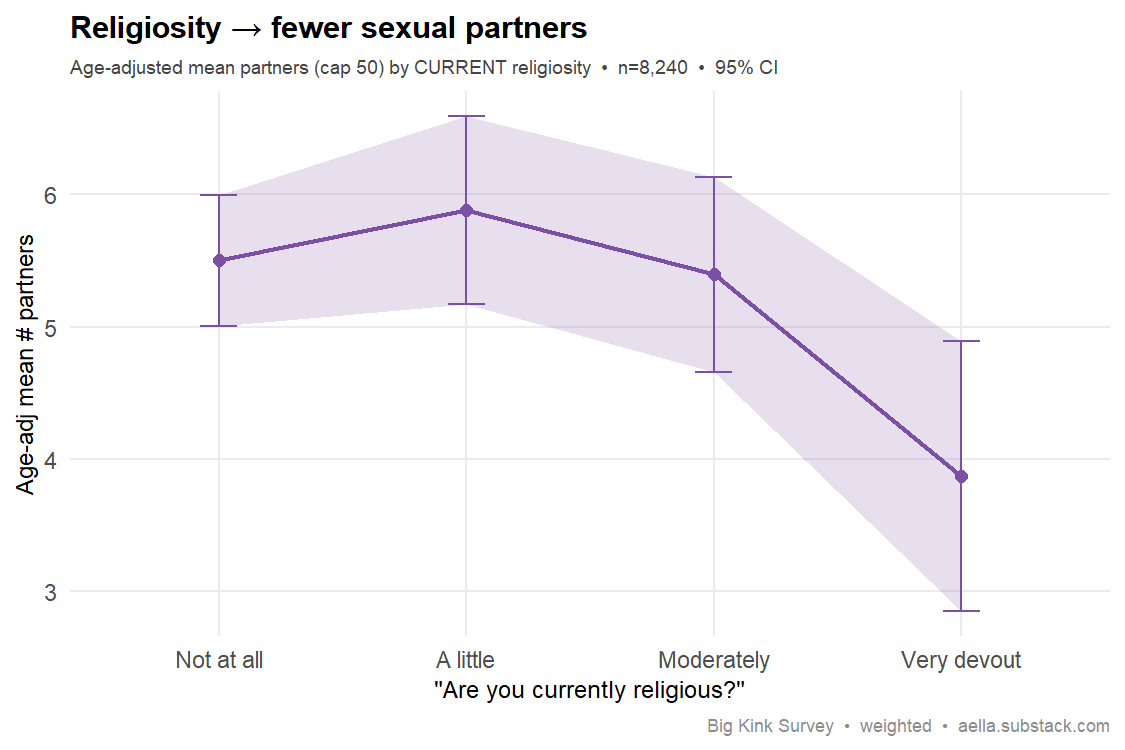
Your data: Weak but consistent. More-religious respondents report somewhat fewer partners: the age-adjusted rank correlation is −0.06 on current religiosity (n≈18k) and −0.06 to −0.07 on the religious-upbringing items (n≈690k). Mean partners (capped at 50) fall steadily across the four current-religiosity levels — 4.2 → 3.8 → 3.7 → 3.1 on the full unweighted sample — while in the population-weighted chart the drop concentrates at the very-devout end. The adult median drops from 2 (not religious) to 1 (very devout), though the full-sample median is 1 in every group: the gap lives mostly in the tail, not the typical respondent. Both sexes show it (women −0.07, men −0.05). Self-report, cross-sectional, heavily secular sample.
Survey question(s) asked
- “Are you currently religious?” (tip: “A 'relationship with Jesus' does count as religious for this question”) — No / A little / Yes, moderately / Yes, very devout (coded 0–3)
- “How many people have you had sex with?” (tip: “By your definition of 'sex' - this typically means penetration, and sometimes includes oral sex.”) — free-entry number, capped at 50 for this analysis
- The parenthetical “upbringing” correlation uses two older items — “How important was EXTERNAL adherence to the religion? …” and “How important was INTERNAL adherence to the religion? …” (Not at all important … Absolutely essentially important, 0–4) — which were removed from the live survey on 3/25/26; only historical responses are used.
Psychiatric comorbidity
68. OCD ↔ anxiety co-occur Replicates
The claim: OCD is highly comorbid with anxiety disorders. (Nosologically, DSM-5 moved OCD into its own OC-spectrum chapter, but the empirical comorbidity is robust.)
Best: Ruscio, Stein, Chiu & Kessler (2010), Molecular Psychiatry (NCS-R). link
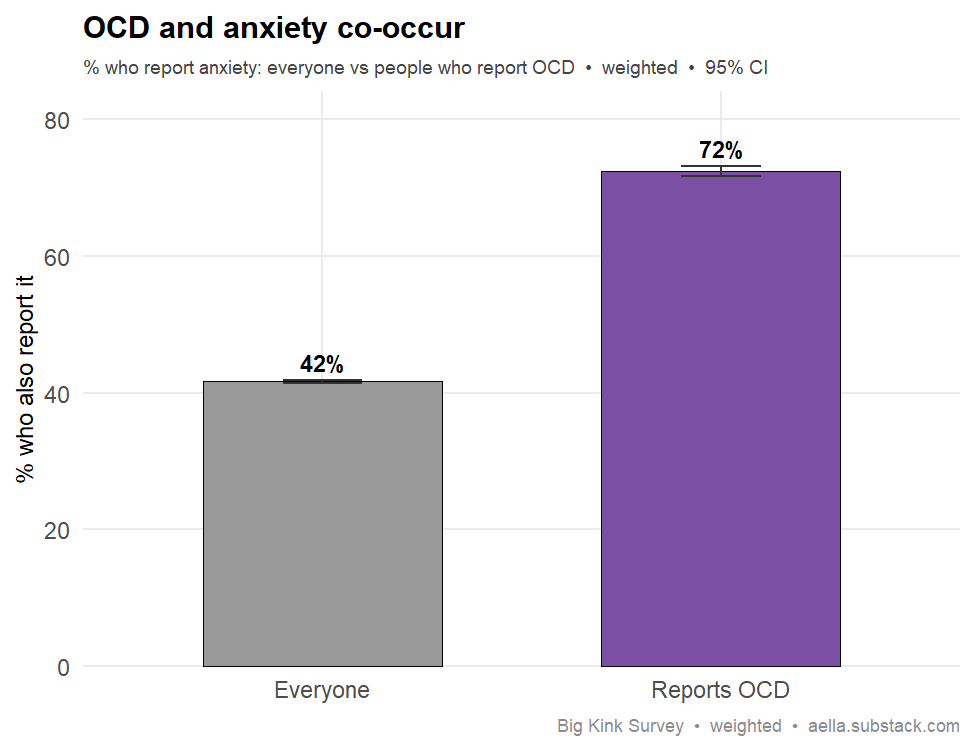
Your data: 72% of people with OCD also report anxiety, vs 42% overall — the expected strong comorbidity.
Survey question(s) asked
- “Do you have any of the following” (checkbox; tip: “Please only check if they're 'moderate to severe'”) — “OCD” checked vs not, and “Anxiety” checked vs not (two options from the same 19-condition list)
- Conditions are self-reported by checking a box — not a clinical-diagnosis question; respondents who didn't check an option are counted as not having it.
69. Bipolar ↔ ADHD co-occur Replicates
The claim: Bipolar disorder and ADHD are highly comorbid, with shared genetic/familial basis.
Best: Schiweck et al. (2021), Neuroscience & Biobehavioral Reviews (meta-analysis, 71 studies). link · Backup: Faraone, Biederman & Wozniak (2012), Am. J. Psychiatry. link
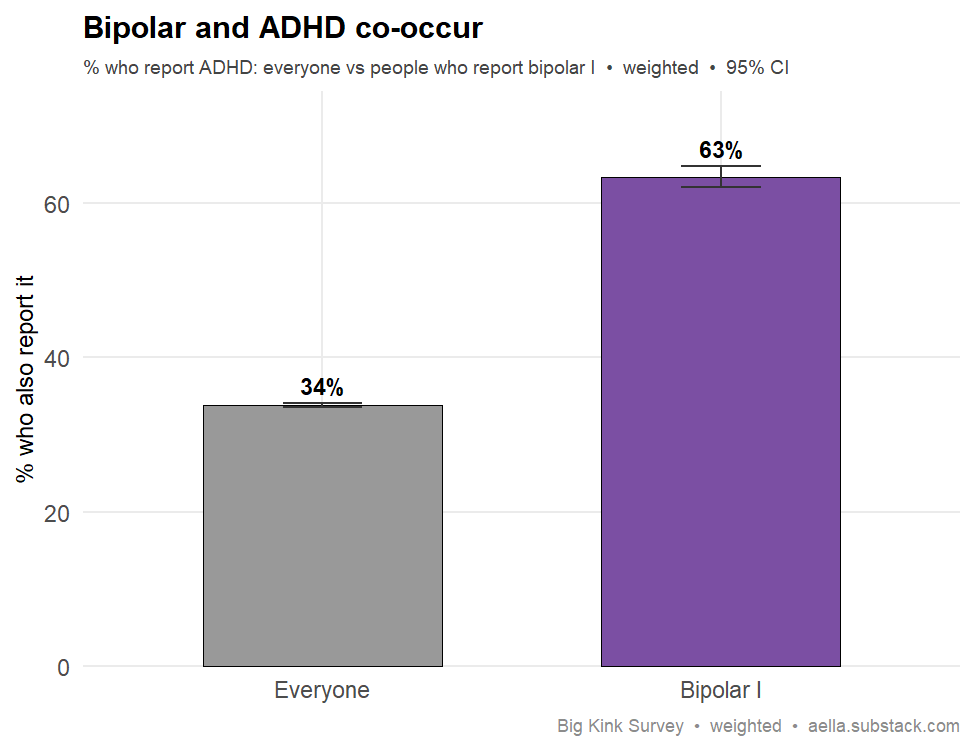
Your data: 63% of people with bipolar I also report ADHD, vs 34% overall — the elevated comorbidity replicates.
Survey question(s) asked
- “Do you have any of the following” (checkbox; tip: “Please only check if they're 'moderate to severe'”) — “Bipolar I” checked vs not, and “ADHD” checked vs not (two options from the same 19-condition list)
- The list has separate “Bipolar I” and “Bipolar II” options; only Bipolar I is used here. Conditions are self-reported by checkbox, not diagnosis questions; unchecked = counted as not having it.
70. PTSD ↔ depression co-occur Replicates
The claim: PTSD and depression are highly comorbid (likely shared diathesis), roughly half of PTSD cases have comorbid depression.
Best: Kessler et al. (1995), Archives of General Psychiatry (National Comorbidity Survey). link
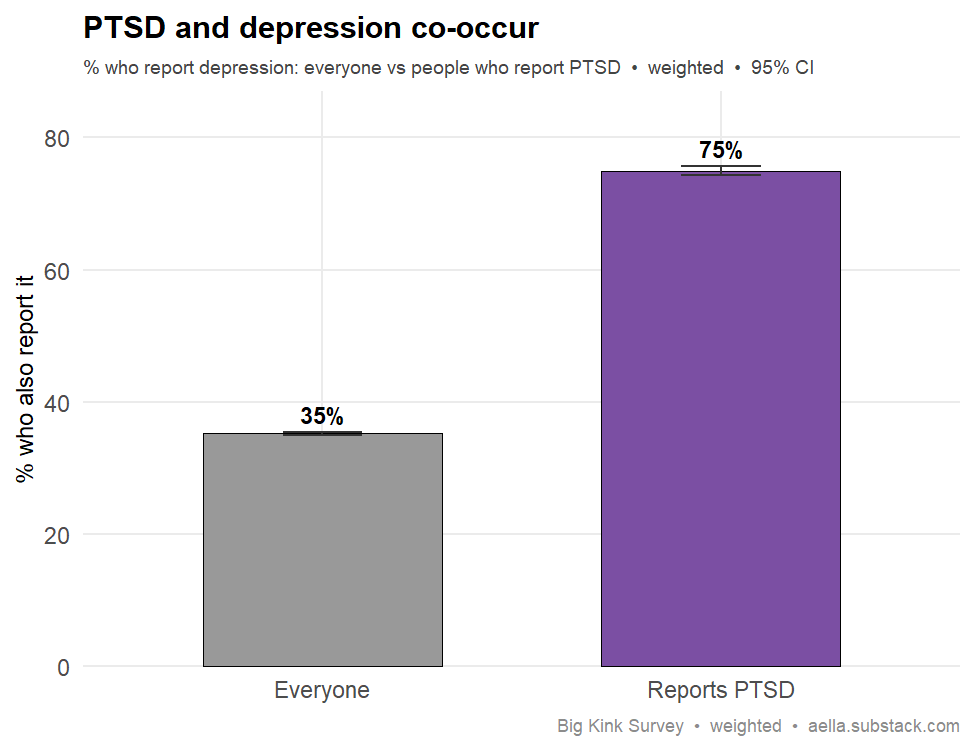
Your data: 75% of people with PTSD also report depression, vs 35% overall — a strong comorbidity.
Survey question(s) asked
- “Do you have any of the following” (checkbox; tip: “Please only check if they're 'moderate to severe'”) — “PTSD” checked vs not, and “Depression” checked vs not (two options from the same 19-condition list)
- Conditions are self-reported by checking a box — not a clinical-diagnosis question; respondents who didn't check an option are counted as not having it.
71. Borderline PD ↔ PTSD co-occur Replicates
The claim: Borderline personality disorder and PTSD are highly comorbid (both trauma-linked).
Best: Pagura et al. (2010), J. Psychiatric Research (NESARC). link
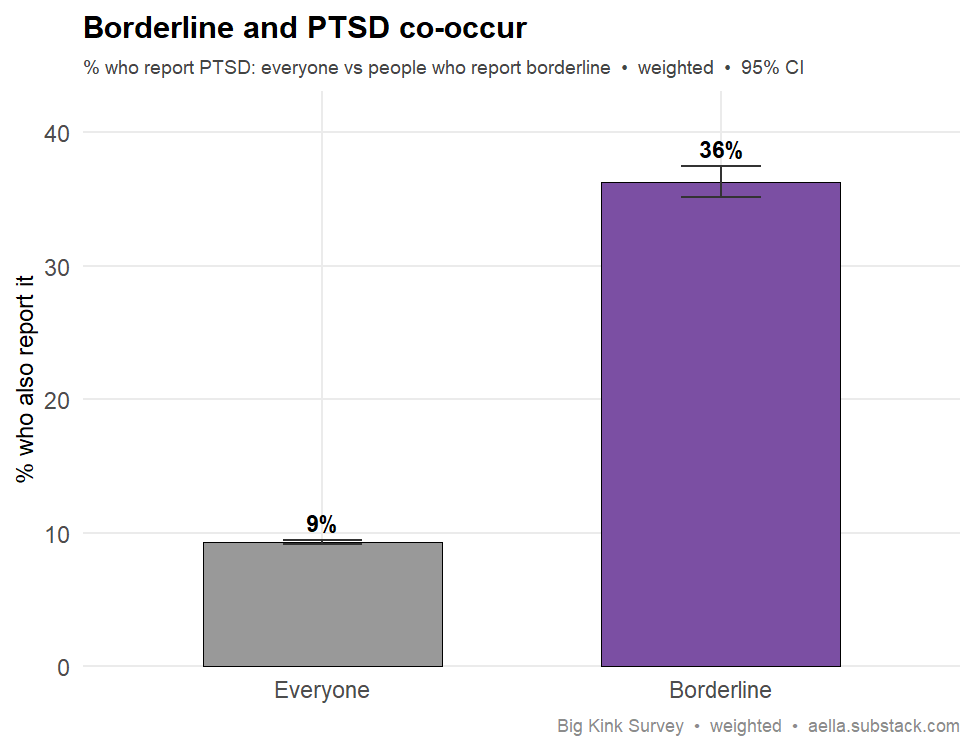
Your data: 36% of people with borderline PD also report PTSD, vs 9% overall — a 4× elevation, matching the literature.
Survey question(s) asked
- “Do you have any of the following” (checkbox; tip: “Please only check if they're 'moderate to severe'”) — “Borderline” checked vs not, and “PTSD” checked vs not (two options from the same 19-condition list)
- The survey option is labeled simply “Borderline”. Conditions are self-reported by checkbox, not diagnosis questions; unchecked = counted as not having it.
72. Childhood sexual abuse → complex PTSD Replicates
The claim: Complex PTSD is specifically tied to prolonged/repeated childhood trauma, so CSA should predict it strongly.
Best: Cloitre et al. (2013), Eur. J. Psychotraumatology. link
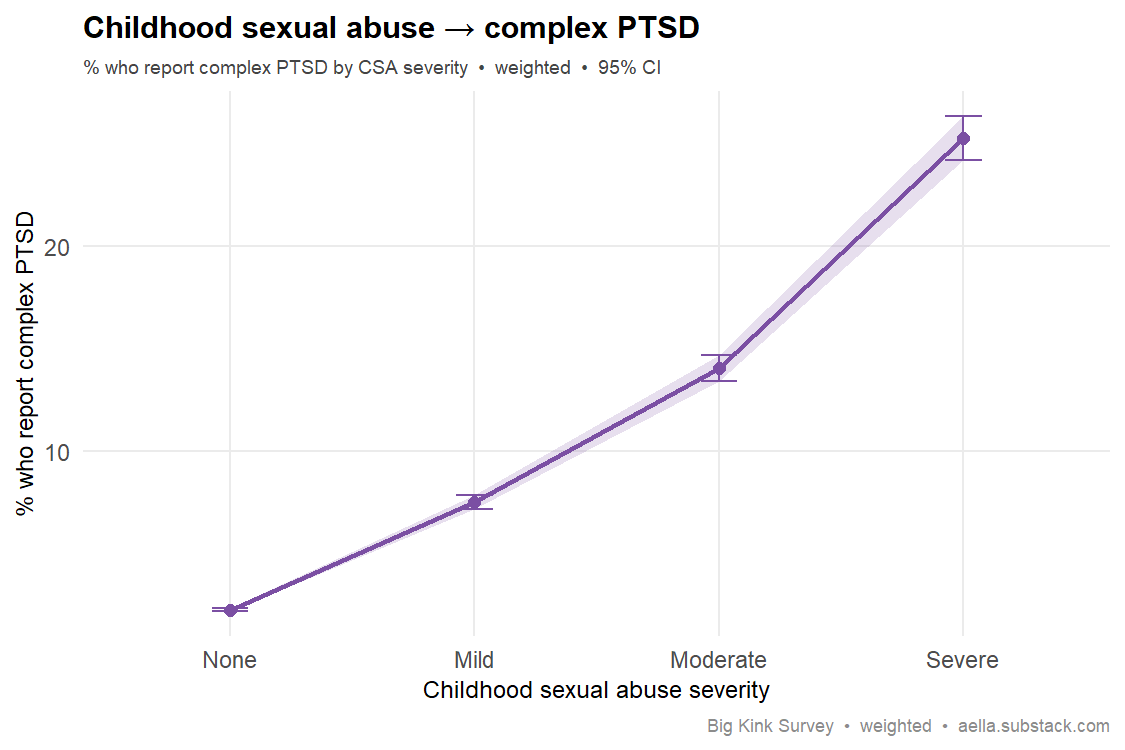
Your data: A steep dose-response — complex-PTSD prevalence climbs 2% → 8% → 14% → 25% across CSA severity. Exactly the gradient the CPTSD construct predicts.
Survey question(s) asked
- “Do you have any of the following” (checkbox; tip: “Please only check if they're 'moderate to severe'”) — “C-PTSD” checked vs not (one option from a 19-condition list)
- “Did you experience sexual assault in your childhood?” — No / Yes, mild / Yes, moderate / Yes, severe (coded 0–3)
- C-PTSD is self-reported by checking a box — not a clinical-diagnosis question; respondents who didn't check it are counted as not having it.
Mental health by sex & orientation
73. Body dysmorphia by sex Diverges
The claim: Body dysmorphic disorder is — per population studies — roughly equal by sex (only a slight female excess), unlike most appearance-related disorders.
Best: Buhlmann et al. (2010), Psychiatry Research 178(1):171-5 (German nationwide survey, N=2,510; BDD ~1.9% women vs ~1.4% men). link
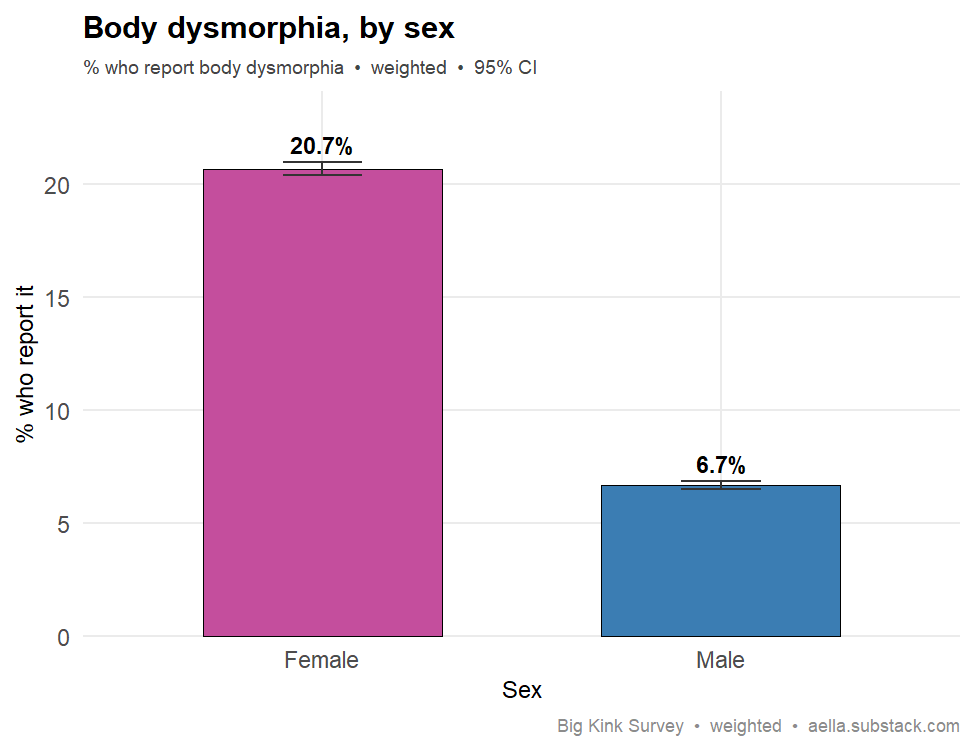
Your data: Diverges from the literature. Where representative samples find rough parity, BKS shows a strong female skew — 20.7% of women vs 6.7% of men report having BDD (~3:1). Likely a sample effect (kink-survey women report far more conditions across the board), so read the levels with caution; the sex ratio here is not what population data show.
Survey question(s) asked
- “Do you have any of the following” (checkbox; tip: “Please only check if they're 'moderate to severe'”) — “Body Dysmorphia” checked vs not (one option from a 19-condition list), split by biological sex
- This is self-labeling, not a diagnosis question — relevant to the card's own caution about reading the levels; respondents who didn't check the option are counted as not having it.
74. Antisocial PD is higher in men Replicates
The claim: Antisocial personality disorder / psychopathy is more common in men (~3:1).
Best: Compton et al. (2005), Journal of Clinical Psychiatry (NESARC) — antisocial syndromes significantly more common in men. link Backup: Alegria et al. (2013), Personality Disorders: Theory, Research & Treatment (NESARC, sex differences in ASPD). link
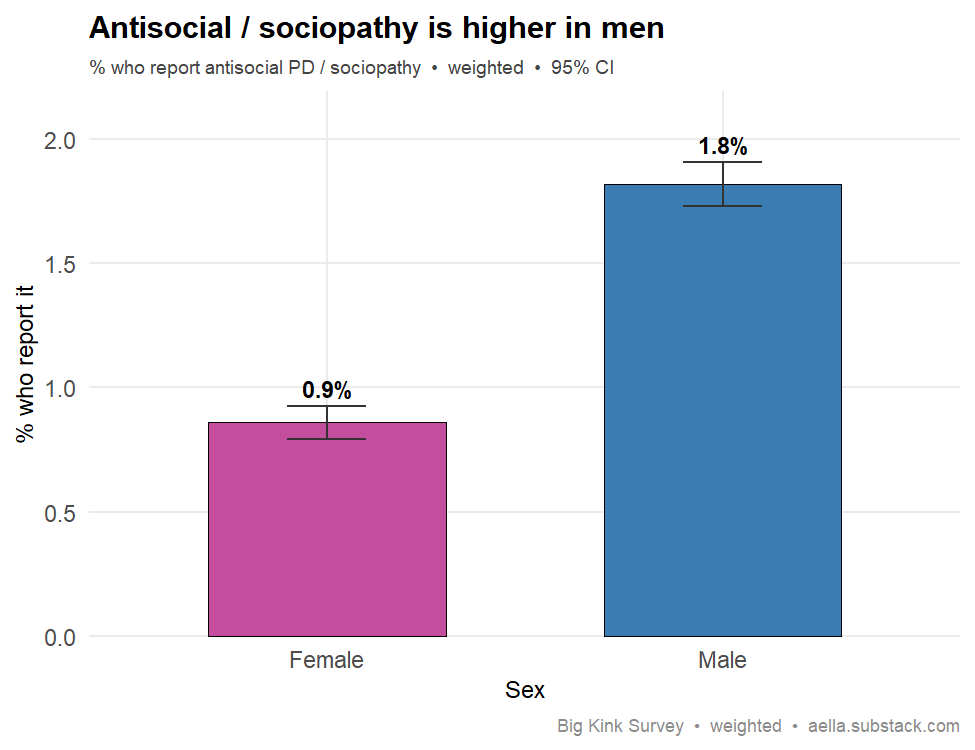
Your data: Men report antisocial PD / sociopathy at twice the rate of women (1.8% vs 0.9%) — the male preponderance replicates, and it's one of the few conditions that skews male in this sample.
Survey question(s) asked
- “Do you have any of the following” (checkbox; tip: “Please only check if they're 'moderate to severe'”) — “Sociopathy” checked vs not (one option from a 19-condition list), split by biological sex
- The survey option is the lay label “Sociopathy” — there is no “antisocial personality disorder” item; self-reported by checkbox, not a diagnosis question.
75. PTSD is higher in women Replicates
The claim: Women have ~2× the odds of PTSD vs men, despite lower overall trauma exposure.
Best: Tolin & Foa (2006), Psychological Bulletin 132(6):959–992 (meta-analysis, 25 years of research). link
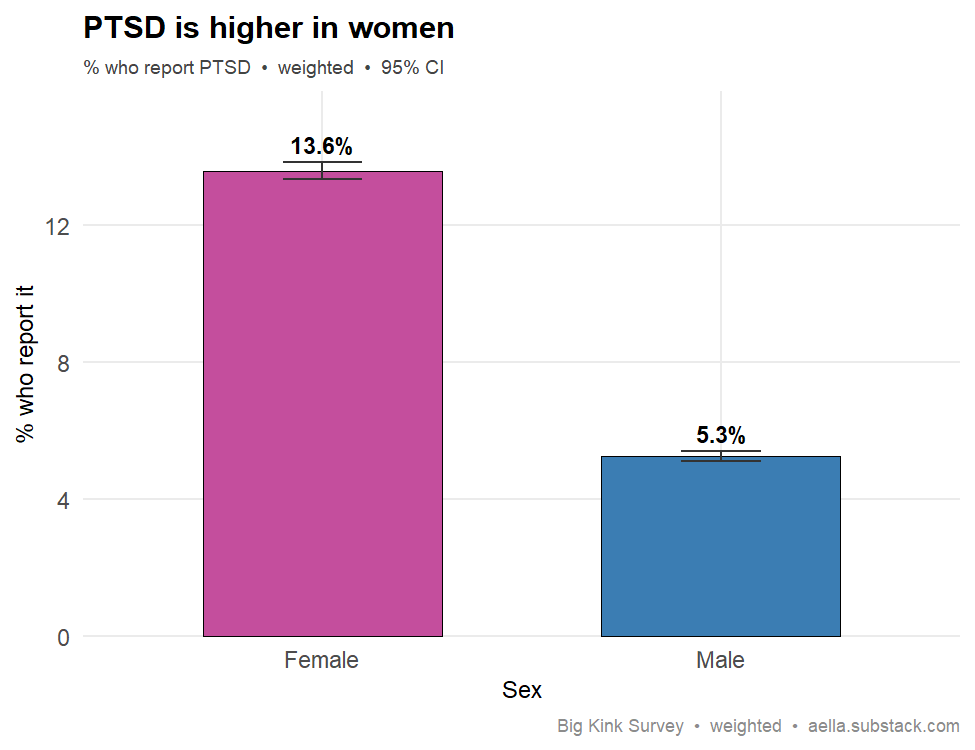
Your data: Women report PTSD at 13.6% vs men's 5.3% — about 2.6×, squarely in the meta-analytic range.
Survey question(s) asked
- “Do you have any of the following” (checkbox; tip: “Please only check if they're 'moderate to severe'”) — “PTSD” checked vs not (one option from a 19-condition list), split by biological sex
- Self-reported by checkbox, not a diagnosis question; respondents who didn't check the option are counted as not having it.
76. Sexual minorities → more mental illness Replicates
The claim: Gay, lesbian and bisexual people have higher rates of mental illness than heterosexuals (minority stress) — and bisexuals often fare worst of all ("bisexual disadvantage").
Best: King et al. (2008), BMC Psychiatry (meta-analysis). link · Backup: Ross et al. (2018), J. Sex Research (bisexual disadvantage). link
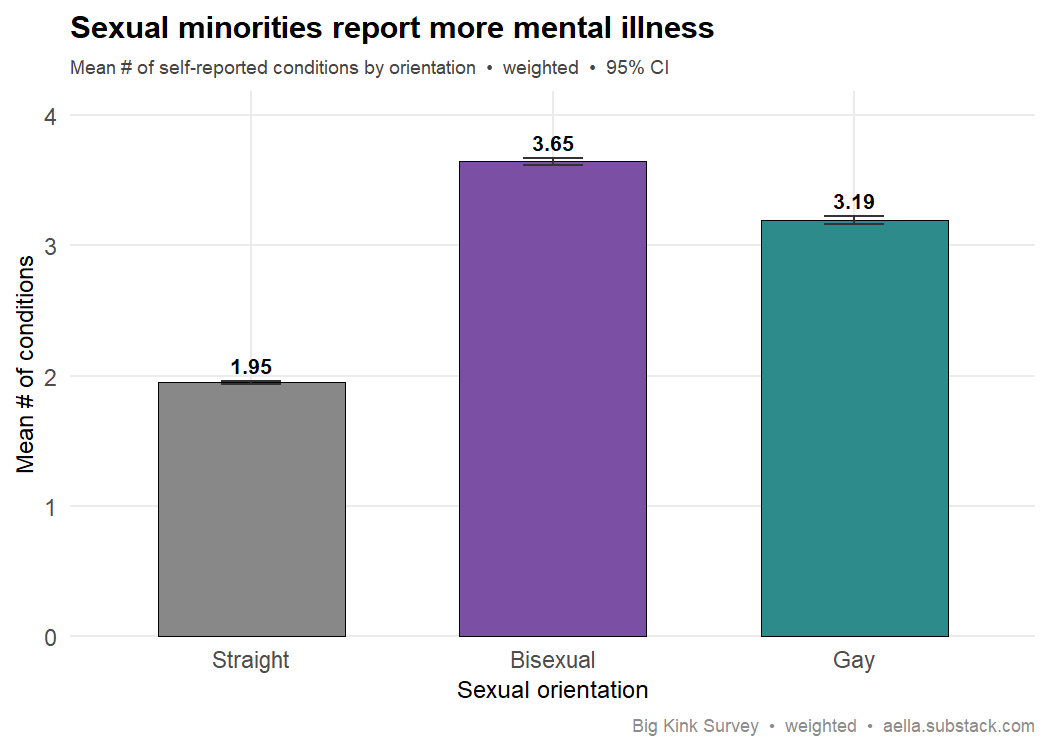
Your data: Mean # of self-reported conditions: straight 1.95, gay/lesbian 3.19, bisexual 3.65 — non-straight people report far more mental illness, and bisexuals the most, matching both the minority-stress and bisexual-disadvantage findings.
Survey question(s) asked
- “You're sexually attracted to people with___” — Penises, exclusively / Penises, mostly / Penises, slightly / Both equally / Vaginas, slightly / Vaginas, mostly / Vaginas, exclusively (7-point)
- “You're more sexually attracted to people who appear visually” — Totally masculine … Totally feminine (7-point)
- “Do you have any of the following” (checkbox; tip: “Please only check if they're 'moderate to severe'”) — outcome is the number of the 19 listed conditions checked
- Straight/Bisexual/Gay here are derived from these two attraction items relative to birth sex — not a self-identification question. Conditions are self-reported by checkbox, not diagnoses.
Psychopathology & mating
77. Borderline PD → more sexual partners Replicates age-adjusted
The claim: Borderline PD is associated with impulsive sexuality and more partners.
Best: Sansone & Sansone (2011), "Sexual behavior in borderline personality: a review," Innovations in Clinical Neuroscience 8(2):14–18 (review). link
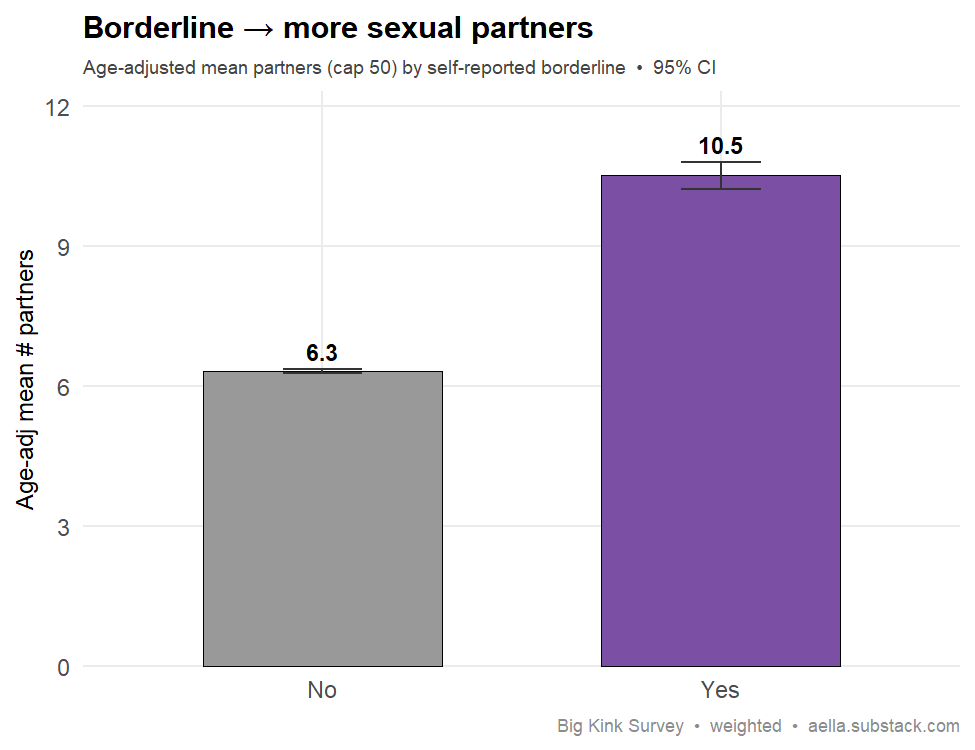
Your data: Age-adjusted mean partners 10.5 (borderline PD) vs 6.3 (not) — a large impulsive-sexuality gap, as the review describes.
Survey question(s) asked
- “Do you have any of the following” (checkbox; tip: “Please only check if they're 'moderate to severe'”) — “Borderline” checked vs not (one option from a 19-condition list)
- “How many people have you had sex with?” (tip: “By your definition of 'sex' - this typically means penetration, and sometimes includes oral sex.”) — free-entry number, capped at 50 and age-adjusted for this analysis
- Borderline is self-reported by checkbox, not a diagnosis question; respondents who didn't check it are counted as not having it.
78. Bipolar → more sexual partners Replicates age-adjusted
The claim: Bipolar disorder is associated with hypersexuality (esp. in manic/hypomanic states) and more partners.
Best: Kopeykina et al. (2016), J. Affective Disorders (review). link
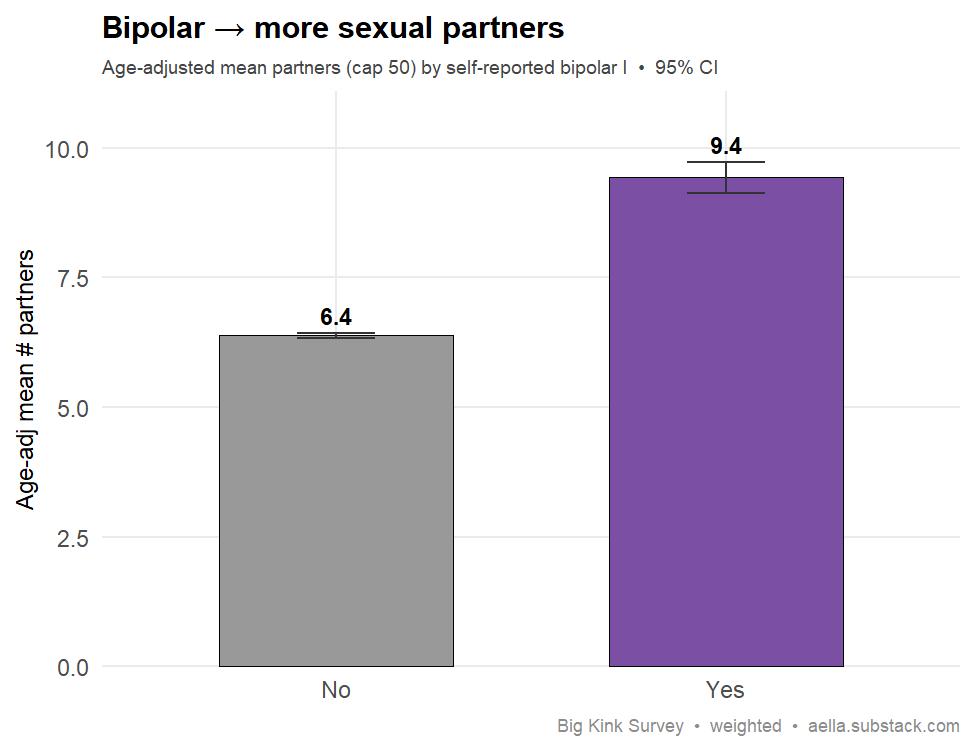
Your data: Age-adjusted mean partners 9.4 (bipolar I) vs 6.4 (not) — consistent with the hypersexuality literature (though "hypersexuality" is defined inconsistently across studies).
Survey question(s) asked
- “Do you have any of the following” (checkbox; tip: “Please only check if they're 'moderate to severe'”) — “Bipolar I” checked vs not (one option from a 19-condition list)
- “How many people have you had sex with?” (tip: “By your definition of 'sex' - this typically means penetration, and sometimes includes oral sex.”) — free-entry number, capped at 50 and age-adjusted for this analysis
- The list has separate “Bipolar I” and “Bipolar II” options; only Bipolar I is used here. Self-reported by checkbox, not a diagnosis question.
79. Antisocial traits → more sexual partners Sex-dependent (men) full sample
The claim: Psychopathy / Dark-Triad traits predict unrestricted sociosexuality and more partners (short-term mating strategy).
Best: Jonason, Li, Webster & Schmitt (2009), “The Dark Triad: Facilitating a short-term mating strategy in men,” European Journal of Personality, 23(1), 5–18. link
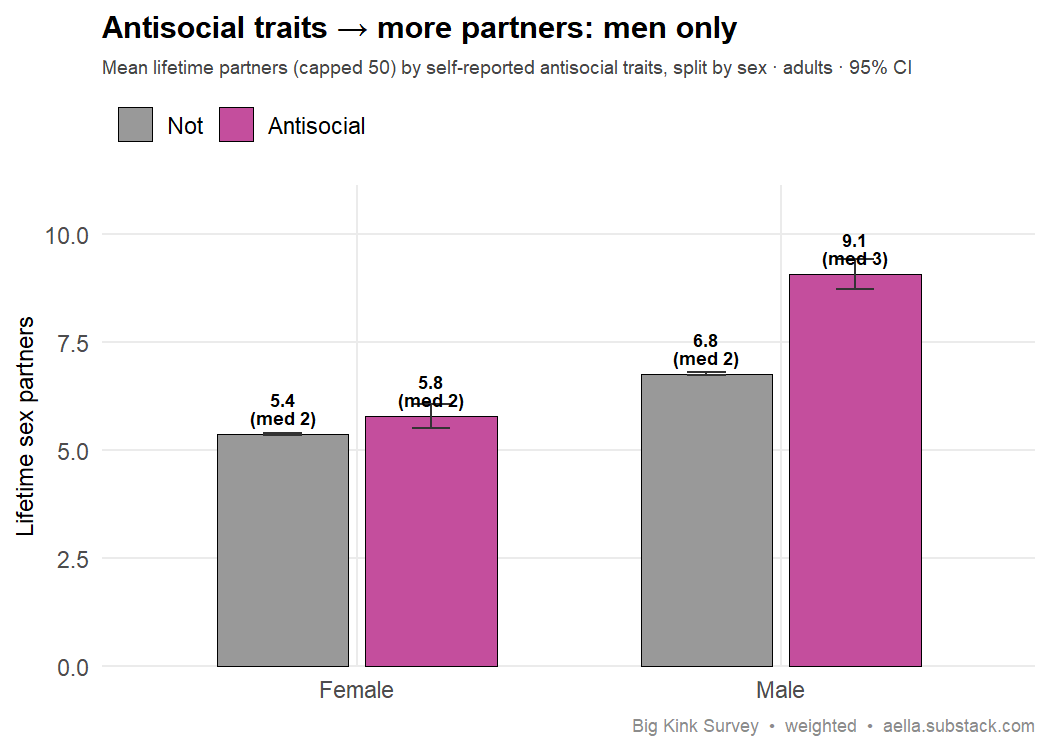
Your data: Sex-dependent — real in men, not women. Pooled, the median partner count looks identical (2 vs 2) — which on its own looks like a mean artifact — but that pools a large female majority showing no effect (median 2 vs 2; cap-50 5.4 vs 5.8) with men who genuinely do: men reporting antisocial/sociopathic traits have a higher median (3 vs 2) and cap-50 mean (9.1 vs 6.8) than other men. So the unrestricted short-term-mating pattern shows up where the literature centres it — in men — but doesn't generalise to women here, and stays modest. Self-report (not clinical), cross-sectional.
Survey question(s) asked
- “Do you have any of the following” (checkbox, 19 conditions; tip: “Please only check if they're 'moderate to severe'”) — the option “Sociopathy” checked vs not
- “How many people have you had sex with?” (tip: “By your definition of 'sex' - this typically means penetration, and sometimes includes oral sex.”) — free numeric entry
- “Antisocial” here means the respondent checked “Sociopathy” on this self-report checklist — it is not a diagnosis question and never mentions ASPD.
80. Openness → more sexual partners Replicates (weak) age-adjusted
The claim: Openness to experience predicts more sexual partners. (The weakest of the Big-Five mating links.)
Best: Schmitt & Shackelford (2008), Evolutionary Psychology (46 nations). link
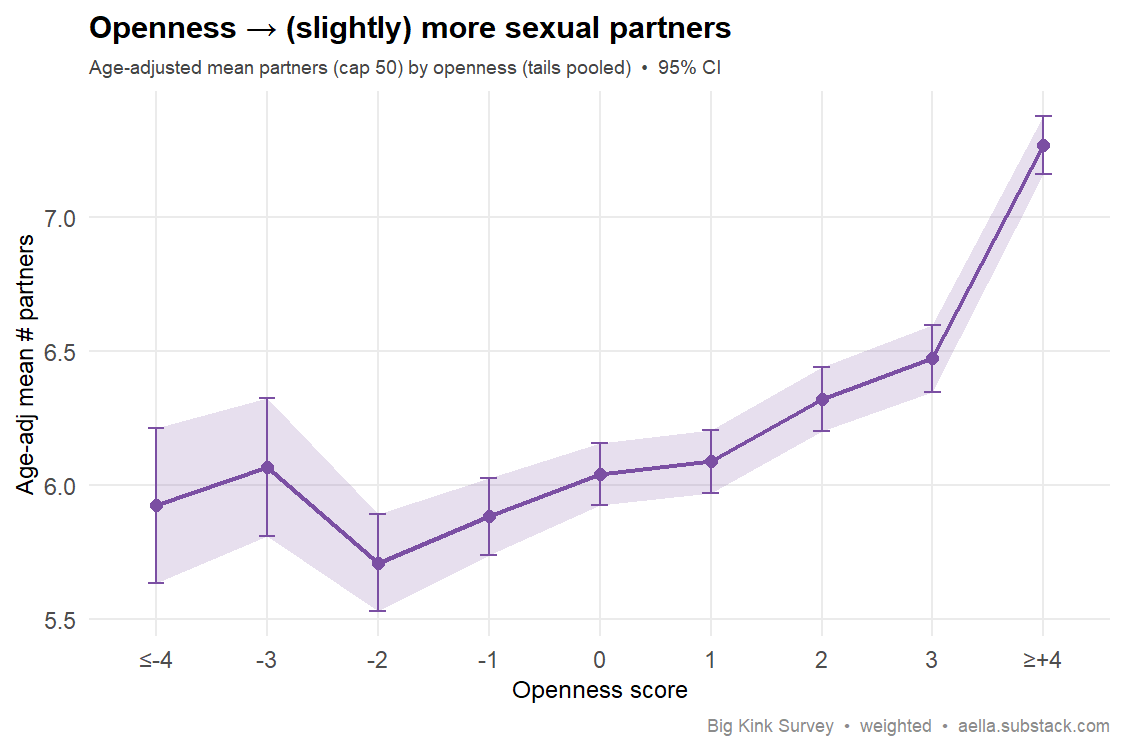
Your data: Weak but real once age is handled. Raw, more-open people report more partners: Spearman +0.14 among adults (n≈881k), with capped means rising 4.8 → 5.9 → 7.7 across openness tertiles and medians 1 → 2 → 3. Age explains part of that — older adults are both more open and have more partners — but only about half: adjusting for age leaves a rank correlation of +0.07 (+0.10 in men, +0.06 in women), and the age-adjusted means in the chart still climb across the openness range. A small positive link survives the control — consistent with openness being the weakest of the Big-Five mating predictors: present, just modest.
Survey question(s) asked
- “I have excellent ideas” — Totally agree (+3) … Totally disagree (−3), 7-point agreement scale
- “I have difficulty understanding abstract ideas” — same 7-point agreement scale
- “How many people have you had sex with?” (tip: “By your definition of 'sex' - this typically means penetration, and sometimes includes oral sex.”) — free numeric entry
- “Openness” is a 2-item proxy: agreement with “I have excellent ideas” minus agreement with “I have difficulty understanding abstract ideas” (range −6 to +6) — a short IPIP-style measure, not a full Big-Five Openness scale.
Kink & sexual interests
81. Bisexual people report the most kink Replicates
The claim: Bisexual / non-monosexual people report more varied sexual interests than heterosexuals.
Best: Richters et al. (2008), J. Sexual Medicine — Australian national survey (N=19,307); past-year BDSM engagement 14.2% among bisexual vs 1.8% overall. link · Backup: Lehmiller (2018), Tell Me What You Want (US fantasy survey, N≈4,175) — non-monosexual respondents report more varied fantasies.
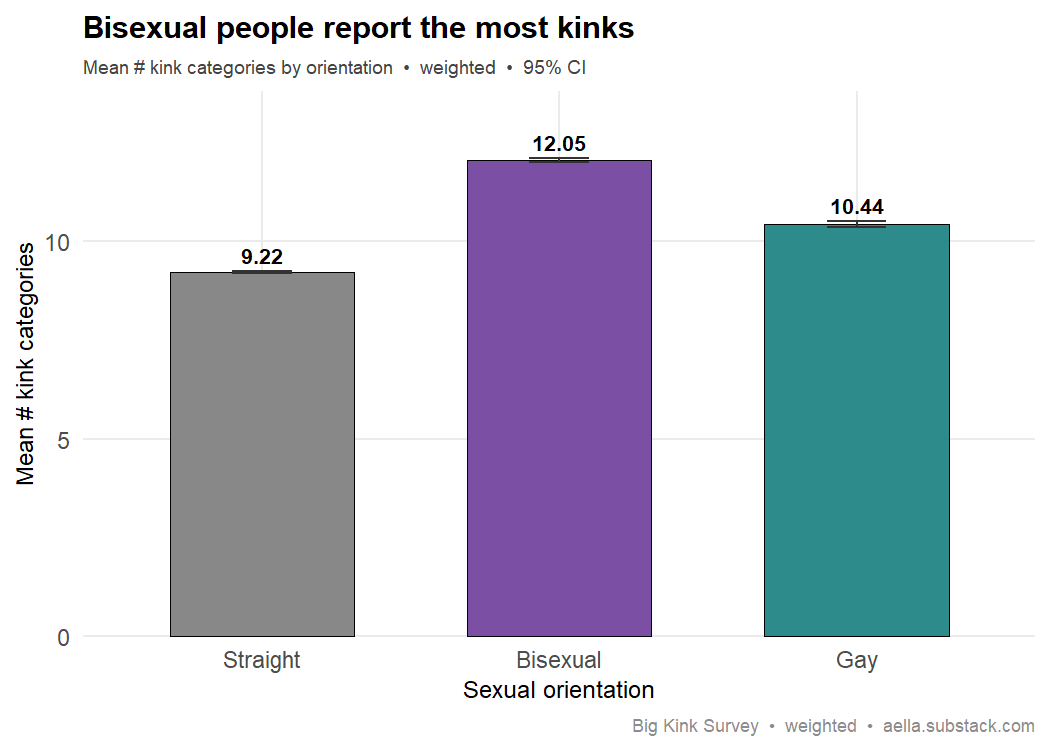
Your data: Mean kink categories: straight 9.2, gay/lesbian 10.4, bisexual 12.1 — bisexual respondents endorse the widest range, as the varied-interests literature suggests.
Survey question(s) asked
- “You're sexually attracted to people with___” — Penises, exclusively / Penises, mostly / Penises, slightly / Both equally / Vaginas, slightly / Vaginas, mostly / Vaginas, exclusively
- “You're more sexually attracted to people who appear visually” — Totally masculine … Totally feminine, 7-point
- “Common things: Check all the following categories that contain a thing that arouses you.” — checkbox, 17 categories (Bondage, Clothing, Humiliation, Sadomasochism, …)
- “Uncommon things: Check all the following categories that contain a thing that arouses you.” — checkbox, 13 categories (Bestiality/creatures, Genderplay, Vore, …)
- Straight/Bisexual/Gay here are derived from the two attraction items relative to birth sex — not a self-identification question.
- Kink breadth = the number of categories checked across the two lists (0–30).
82. Cuckolding interest is higher in men Replicates
The claim: Cuckolding / partner-sharing fantasies are more common in men than women.
Best: Lehmiller (2018), Tell Me What You Want (Da Capo; popular survey of 4,175 US adults). · Backup: Joyal, Cossette & Lapierre (2015), “What Exactly Is an Unusual Sexual Fantasy?”, J. Sexual Medicine 12(2):328–340. link
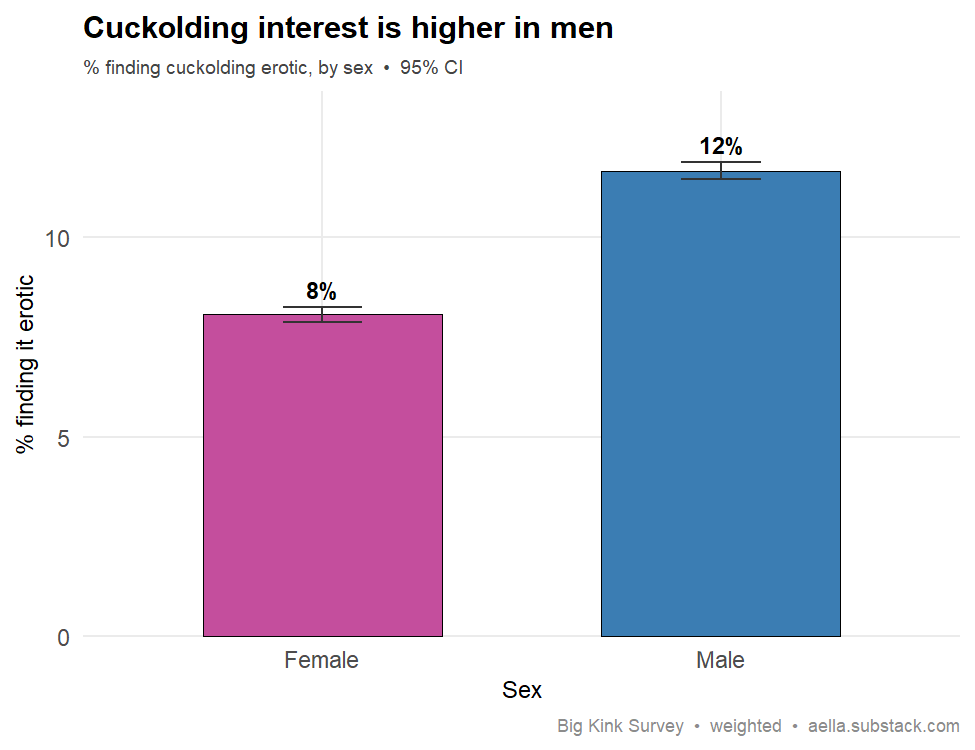
Your data: 11.7% of men vs 8.1% of women find cuckolding erotic — men higher, as reported (Lehmiller's survey found a similar male skew). The best published figure is from a popular book, so treat the magnitude loosely; the direction is well supported.
Survey question(s) asked
- “Common things: Check all the following categories that contain a thing that arouses you.” — checkbox; the category “Multiple partners (hotwifing, gangbangs, freeuse, threesomes, etc.)”
- “I find sexual scenarios involving multiple partners to be:” — Not arousing / Slightly / Somewhat / Moderately / Very / Extremely arousing
- “Which of the following do you find erotic?” — checkbox including “Cuckolding” (alongside Bukkake, Cheating, Gang bangs, Freeuse, …)
- The Cuckolding checkbox was shown only to respondents who checked the Multiple partners category and rated it at least “Slightly arousing”; everyone else is counted as 0 / no interest, so the percentages are shares of all men and all women.
83. Romance is a bigger erotic theme for women Replicates
The claim: Women's eroticism is more relational/romantic; affection and romance feature more in women's fantasies than men's.
Best: Leitenberg & Henning (1995), Psychological Bulletin (classic review). link
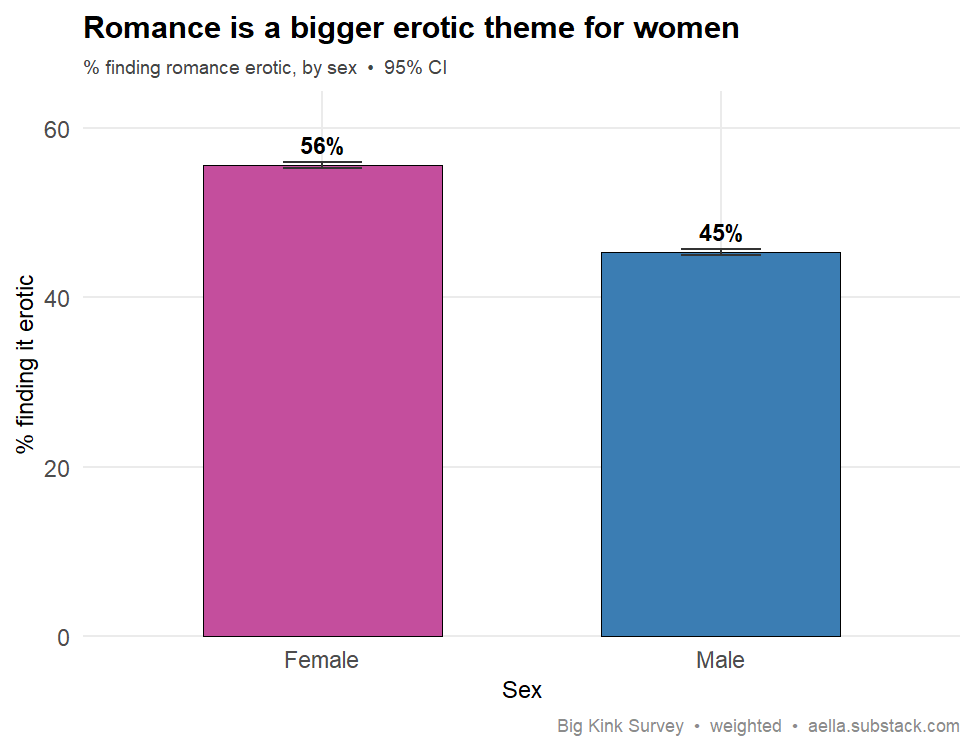
Your data: 55.6% of women vs 45.4% of men find romance erotic — women lean more romantic, matching the relational-eroticism finding.
Survey question(s) asked
- “Common things: Check all the following categories that contain a thing that arouses you.” — checkbox; the category “Gentleness (caretaking, healing, tantra, etc.)”
- “I find sexual scenarios involving gentleness to be:” — Not arousing / Slightly / Somewhat / Moderately / Very / Extremely arousing
- “Which of the following do you find erotic?” — checkbox including “Romance” (alongside Cuddling, Affection, Tantra, Caretaker/caretakee dynamics, …)
- The Romance checkbox was shown only to respondents who checked the Gentleness category and rated it at least “Slightly arousing”; everyone else is counted as 0 / no interest, so the percentages are shares of all men and all women.
84. Dominance ↔ sadism, submission ↔ masochism Replicates
The claim: Paraphilic interests cohere — arousal to dominating tracks sadism (giving pain), arousal to submitting tracks masochism (receiving pain).
Best: Schippers, Smid, Huckelba, Hoogsteder, Beekman & Smit (2021), Journal of Sexual Medicine 18(9):1615–1631 — factor analysis of unusual sexual interests yielding distinct, coherent "submission/masochism" and "dominance/sadism" factors. link Backup: Schippers, Smid, Hoogsteder & de Vogel (2024), Sexual Abuse — replication of the same factor structure in a representative population sample.
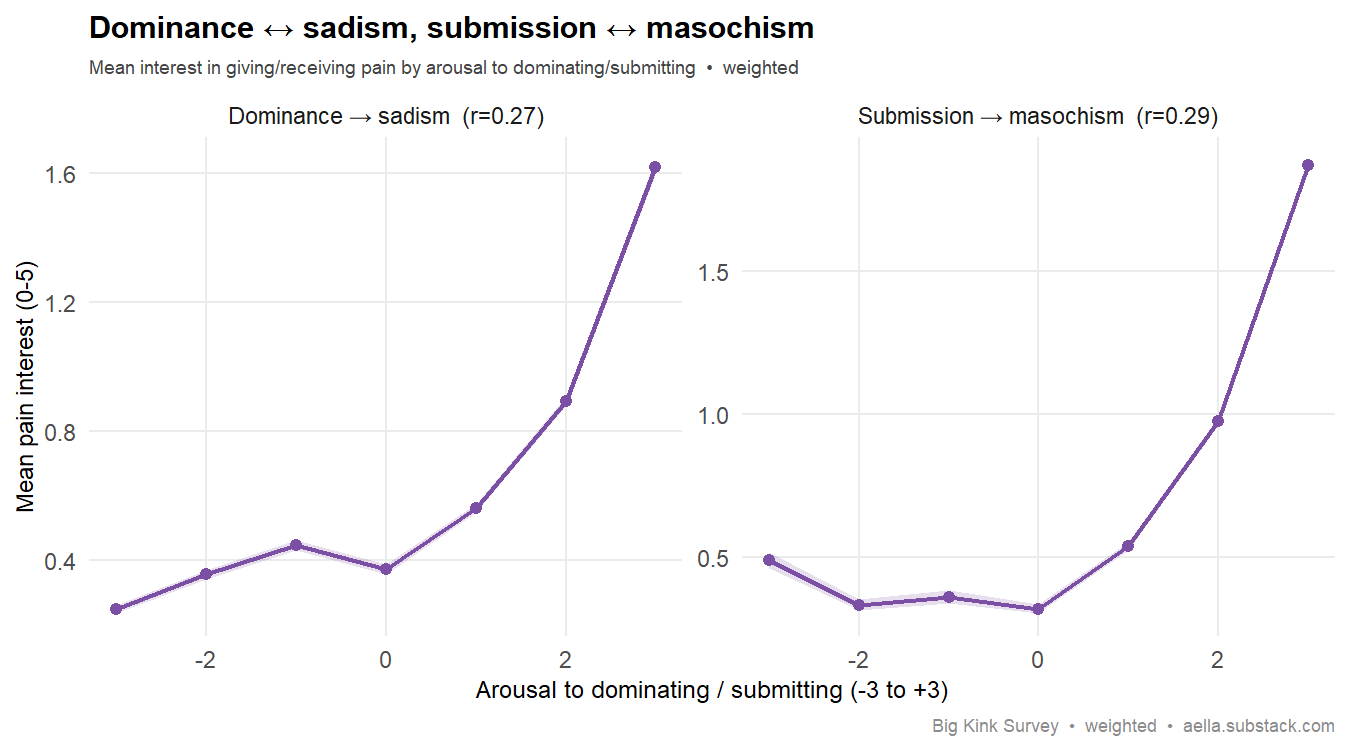
Your data: Interest in giving pain rises steadily with arousal to dominating (r = 0.27), and interest in receiving pain rises with arousal to submitting (r = 0.29) — the predicted role coherence.
Survey question(s) asked
- “I am aroused by being dominant in sexual interactions” — Totally agree (+3) … Totally disagree (−3), 7-point; asked of everyone
- “I am aroused by being submissive in sexual interactions” — same 7-point agreement scale
- “In erotic contexts, I find *giving* pain to others to be:” — Not arousing / Slightly / Somewhat / Moderately / Very / Extremely arousing
- “In erotic contexts, I find *receiving* pain to be:” — same arousal scale
- The two pain items were shown only to respondents who checked “Sadomasochism (spanking, needle play, clamps, torture, etc.)” on the fetish checklist and rated it at least “Slightly arousing”; everyone else is counted as “Not arousing” (0).
- The arousal scale's raw values {0,1,2,3,5,8} are stored as ordinal 0–5 in the analysis data.
Ideology & personality
85. Openness → social (not economic) liberalism Replicates (weak)
The claim: Openness predicts the social/cultural liberal dimension specifically, more than economic liberalism.
Best: Malka, Soto, Inzlicht & Lelkes (2014), Journal of Personality and Social Psychology 106(6):1031–1051 — the openness/security-needs dimension predicts cultural (social) conservatism specifically, while running the opposite way on economic attitudes. link Backup: Gerber, Huber, Doherty, Dowling & Ha (2010), American Political Science Review 104(1):111–133 — Big Five traits relate to economic vs. social attitudes differently across issue domains. link
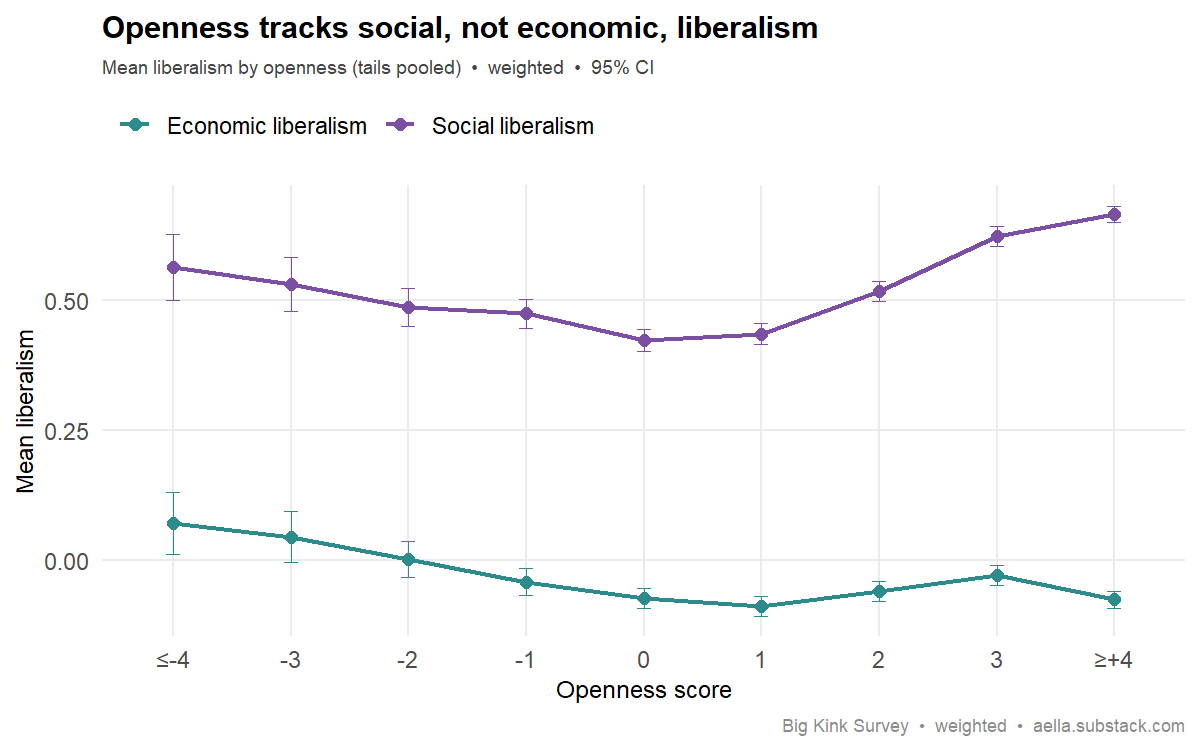
Your data: The dissociation is there, but small. On the population-weighted sample (chart) social liberalism rises with openness (r = +0.05) while economic liberalism is flat (r = −0.01). On the full unweighted sample (n≈1.0M) both raw correlations are positive (+0.08 social, +0.05 economic — the two axes themselves correlate 0.71), but the unique associations tell the same story: controlling each axis for the other, social keeps +0.06 while economic falls to ≈0. Openness tracks the social axis specifically, as the literature predicts — the effect is just weak.
Survey question(s) asked
- “I have excellent ideas” — Totally agree (+3) … Totally disagree (−3), 7-point agreement scale
- “I have difficulty understanding abstract ideas” — same 7-point agreement scale
- “Openness” is a 2-item proxy: agreement with the first item minus agreement with the second (range −6 to +6) — not a full Big-Five Openness scale.
- The social-liberalism and economic-liberalism scores come from multi-item scales asked in an earlier version of the survey (the politics section was later condensed to a single question); their exact wording is not in the current survey source, so it is not quoted here.
86. Conscientiousness → less porn Replicates (weak)
The claim: Lower conscientiousness predicts more (problematic) pornography use. (Conscientiousness is a minor predictor; neuroticism is stronger.)
Best: Bőthe et al. (2019), Sexual Addiction & Compulsivity. link
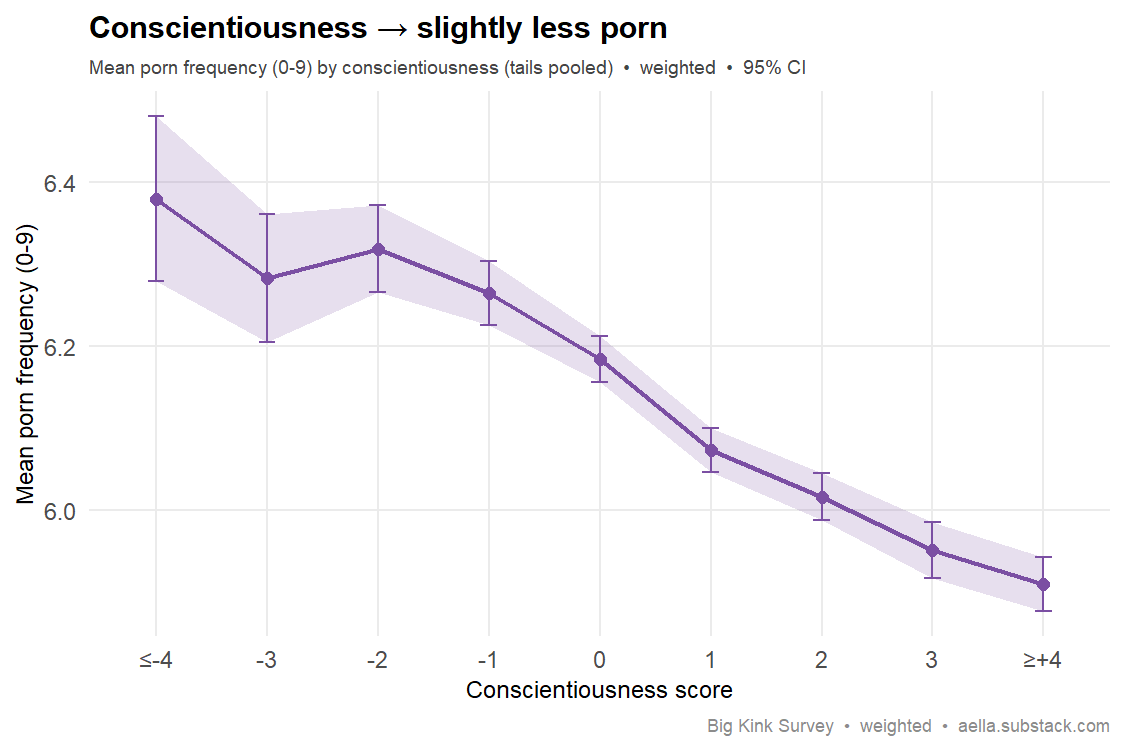
Your data: Porn frequency drifts down with conscientiousness (r ≈ −0.05) — the predicted direction, but small, consistent with conscientiousness being a weak correlate.
Survey question(s) asked
- “I like order” — Totally agree (+3) … Totally disagree (−3), 7-point agreement scale
- “I shirk my duties” — same 7-point agreement scale
- “How often do you watch or read pornographic/erotic content?” (tip: “for the purposes of getting aroused”) — I don't (0) / Less than once a year (1) / Once a year / A few times a year / Once a month / A few times a month / Once a week / Multiple times a week / Daily / Multiple times a day (9)
- “Conscientiousness” is a 2-item proxy: agreement with “I like order” minus agreement with “I shirk my duties” (range −6 to +6) — not a full Big-Five scale.
87. Conservatism → fewer partners Not seen full sample
The claim: Political conservatism predicts fewer sexual partners / more restricted sexual behavior.
Best: Hatemi, Crabtree & McDermott (2017), “The relationship between sexual preferences and political orientations,” Personality & Individual Differences, 105, 318–325. link
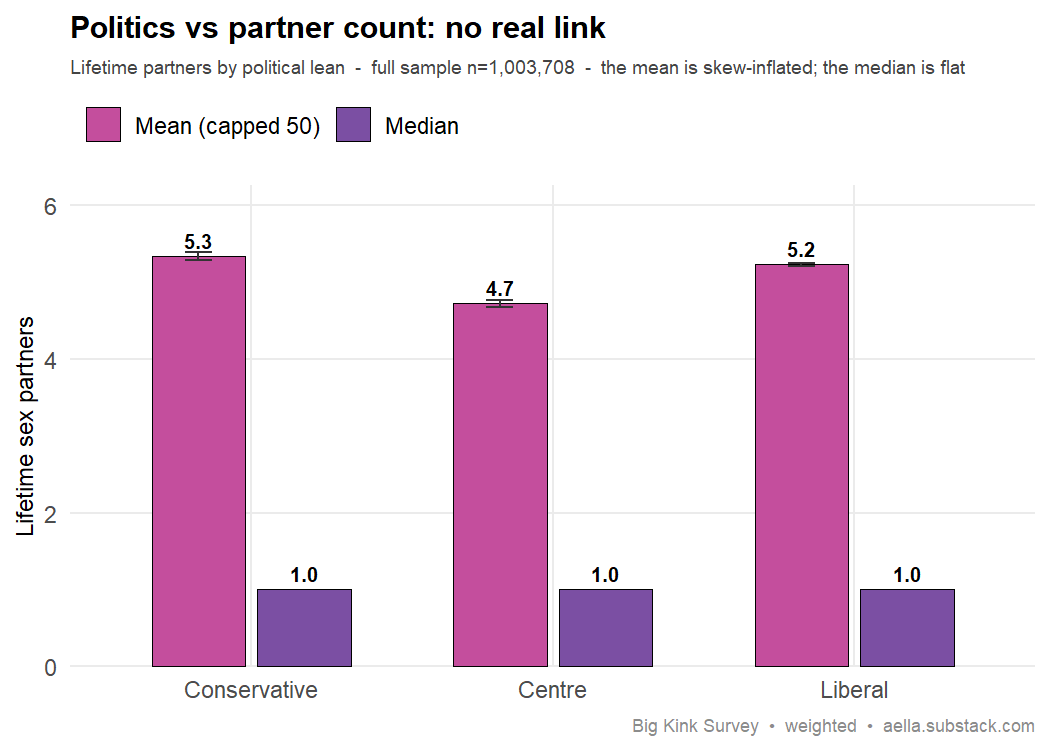
Your data: Essentially flat — no real link either way. The literature says conservatism predicts a more restricted sex life and fewer partners; we see neither that nor a credible reversal. Partner counts are extremely right-skewed (most people report 1–2, a long tail report dozens), so the mean is treacherous here — a handful of very-high-count respondents in a small cell can drag its average around, which is how spurious "conservatives have more" patterns arise. By the robust measures the relationship is ~zero: the median lifetime partner count is identical for conservatives, centrists and liberals (1 in the full sample, 2 among adults 18+), and even the mean (capped at 50) is flat — conservatives 5.3 vs liberals 5.2, with centrists actually lowest (4.7). The rank (Spearman) correlation with liberalism is +0.06 on the well-powered social/economic-liberalism scale (n≈1.0M) but −0.02 on a single self-placement item (n≈58k) — tiny either way, with the sign depending on which measure you use. Bottom line: in this heavily-liberal, kink-skewed sample, political orientation and partner count are basically unrelated — the conservative-restriction effect doesn't appear, and neither does a real reversal.
Survey question(s) asked
- “Politically speaking, you tend to be more:” (tip: “In the western sphere of politics”) — Significantly liberal/left (+3) / Moderately liberal/left / Slightly liberal/left / Equally liberal/conservative (0) / Slightly conservative/right / Moderately conservative/right / Significantly conservative/right (−3)
- “How many people have you had sex with?” (tip: “By your definition of 'sex' - this typically means penetration, and sometimes includes oral sex.”) — free numeric entry
- The chart and the well-powered correlation (n≈1.0M) use a composite liberalism score: the average of social-liberalism and economic-liberalism scales asked in an earlier version of the survey, whose exact wording is not in the current survey source and so is not quoted here. The single self-placement item above is the smaller (n≈58k) secondary measure.
Gender identity
88. Gender-diverse → more mental illness Replicates
The claim: Transgender and nonbinary people report much higher rates of mental illness than cisgender people (gender minority stress).
Best: Klinger et al. (2024), Child & Adolescent Psychiatry & Mental Health. link · Theory: Meyer (2003), Psychological Bulletin. link
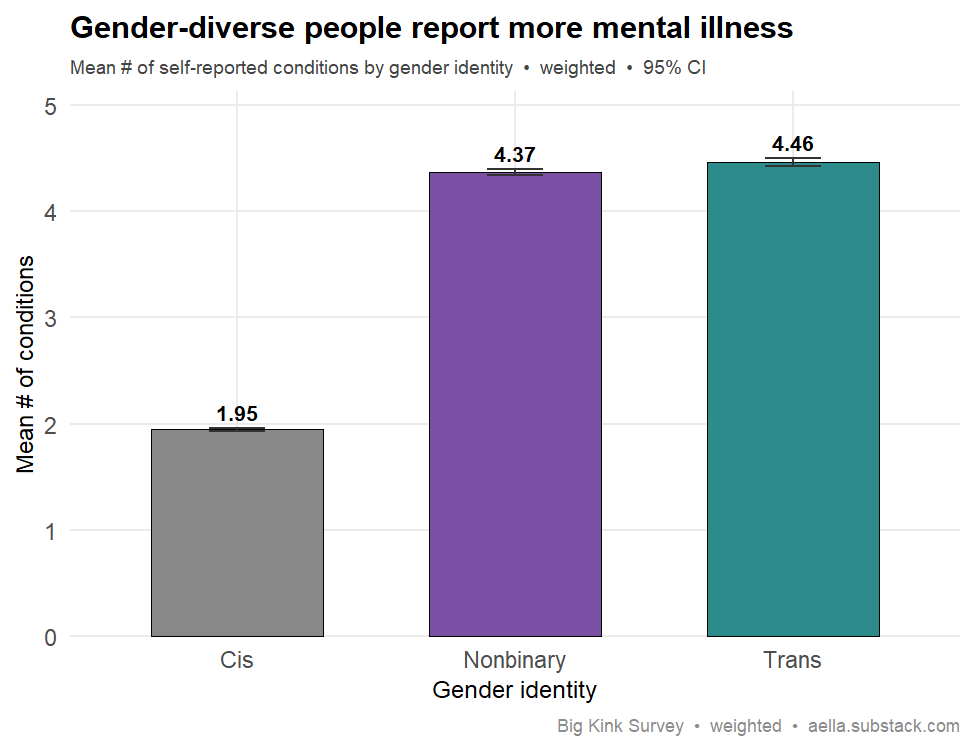
Your data: Gender-diverse people report ~2x more mental-health conditions: weighted means cis 1.95, nonbinary 4.37, trans 4.46 (n≈481k). The gap survives natal-sex matching — e.g. trans women 4.06 vs cis men 1.60 (2.5x), NB-AFAB 4.68 vs cis women 2.74 (1.7x) — so it is not merely a sex confound. Conditions are self-reported (moderate-to-severe, undiagnosed), consistent with minority stress.
Survey question(s) asked
- “Which category fits you best?” — Man (cis) / Man (trans) / Woman (cis) / Woman (trans) / Nonbinary/other (assigned male at birth) / Nonbinary/other (assigned female at birth)
- “Do you have any of the following” (checkbox; tip: “Please only check if they're 'moderate to severe'”) — 19 conditions: ADHD, Anorexia, Anxiety, Autism, Bipolar I, Bipolar II, Body Dysmorphia, Borderline, Bulimia, C-PTSD, Depersonalization/derealization, Depression, Disassociative Identity Disorder, OCD, PTSD, Schizophrenia, Social anxiety, Sociopathy, Substance Abuse Disorder
- The outcome is the number of conditions checked (0–19). It is a self-report checklist — not a diagnosis question. Cis / trans / nonbinary groups collapse the six gender options; natal sex comes from the same item.
89. Gender-diverse → much more autism Replicates
The claim: Autism is far more common among transgender/gender-diverse people (the autism–gender-diversity link).
Best: Warrier et al. (2020), Nature Communications (5 datasets, N≈642k). link
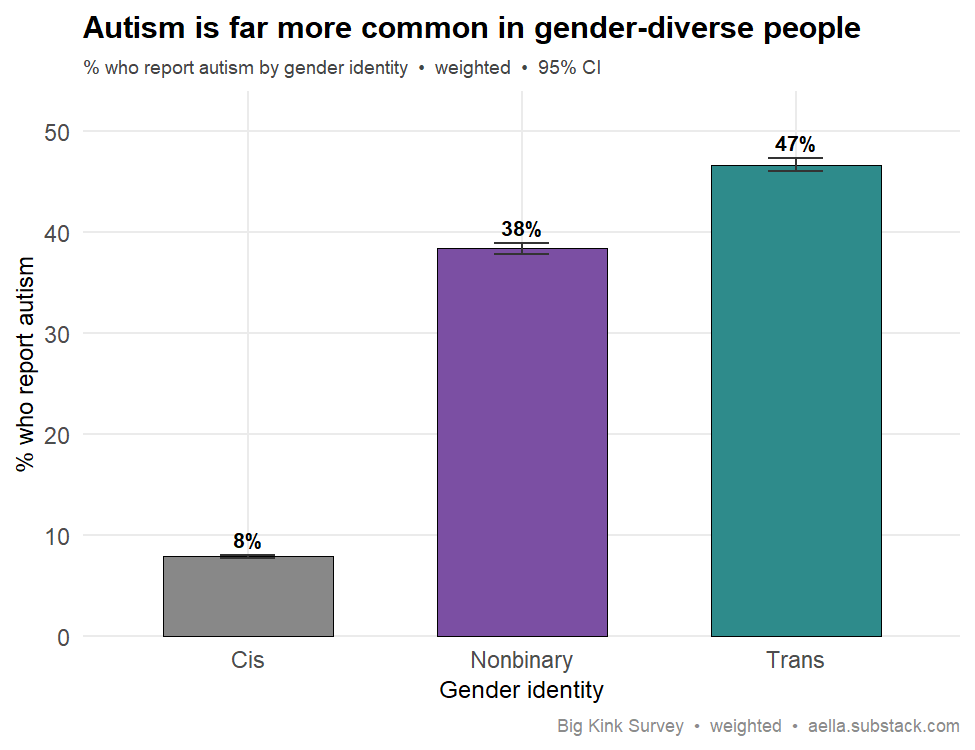
Your data: Self-reported (moderate-to-severe) autism is ~5–6x more common in gender-diverse people: cis 7.9% vs nonbinary 38.4% vs trans 46.7% (weighted). The link survives a birth-sex split: cis rates are near-identical by sex (M 8.7%, F 7.0%) and the elevation holds within every gender category regardless of natal sex, so it is not a male-skew artifact. Self-report, not clinical diagnosis.
Survey question(s) asked
- “Which category fits you best?” — Man (cis) / Man (trans) / Woman (cis) / Woman (trans) / Nonbinary/other (assigned male at birth) / Nonbinary/other (assigned female at birth)
- “Do you have any of the following” (checkbox, 19 conditions; tip: “Please only check if they're 'moderate to severe'”) — the option “Autism” checked vs not
- Self-report checklist, not a diagnosis question. Cis / trans / nonbinary groups collapse the six gender options; natal sex comes from the same item.
90. Gender-diverse → more kink Replicates
The claim: Gender-diverse people report more varied sexual interests / kink than cisgender people. (Weakly established in the literature — present as suggestive.)
Best: Brown, Barker, Friedrich & Rahman (2026), “A Survey of the United Kink-dom,” Journal of Sex Research 63(3):412–430 — in this UK survey of paraphilic-interest groups, over 25% of participants identified as non-cisgender, and groups were more likely to hold non-cisgender identities. link (single survey; suggestive)
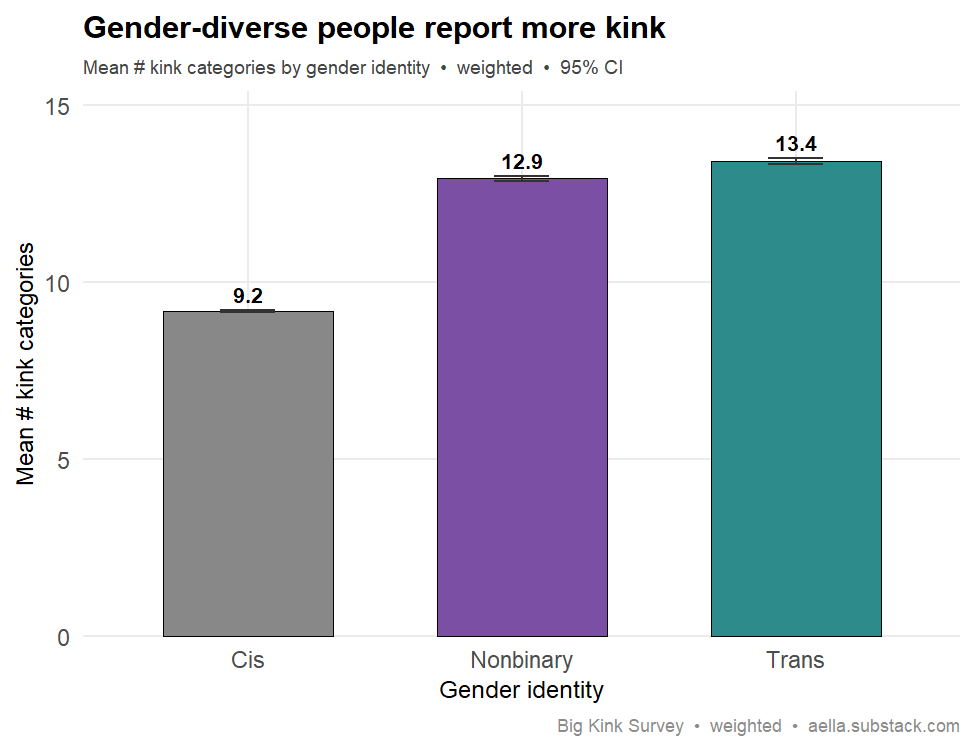
Your data: Gender-diverse respondents endorse markedly more kink categories: weighted-mean 9.2 (cis) vs 12.9 (nonbinary) and 13.4 (trans), n=481k. The gap survives a birth-sex split (within both AMAB and AFAB strata, cis ≈9 vs gender-diverse 12–15), so it is not a sex-composition artifact. The in-sample effect is clean and large; the external literature remains only suggestive.
Survey question(s) asked
- “Which category fits you best?” — Man (cis) / Man (trans) / Woman (cis) / Woman (trans) / Nonbinary/other (assigned male at birth) / Nonbinary/other (assigned female at birth)
- “Common things: Check all the following categories that contain a thing that arouses you.” — checkbox, 17 categories (Bondage, Clothing, Humiliation, Sadomasochism, …)
- “Uncommon things: Check all the following categories that contain a thing that arouses you.” — checkbox, 13 categories (Bestiality/creatures, Genderplay, Vore, …)
- Kink breadth = the number of categories checked across the two lists (0–30). Cis / trans / nonbinary groups collapse the six gender options; natal sex comes from the same item.
91. Gender-diverse → mostly non-heterosexual Replicates
The claim: Transgender/nonbinary people are predominantly not heterosexual.
Best: Reisner, Choi, Herman, Bockting, Krueger & Meyer (2023), "Sexual orientation in transgender adults in the United States," BMC Public Health 23:1799. link
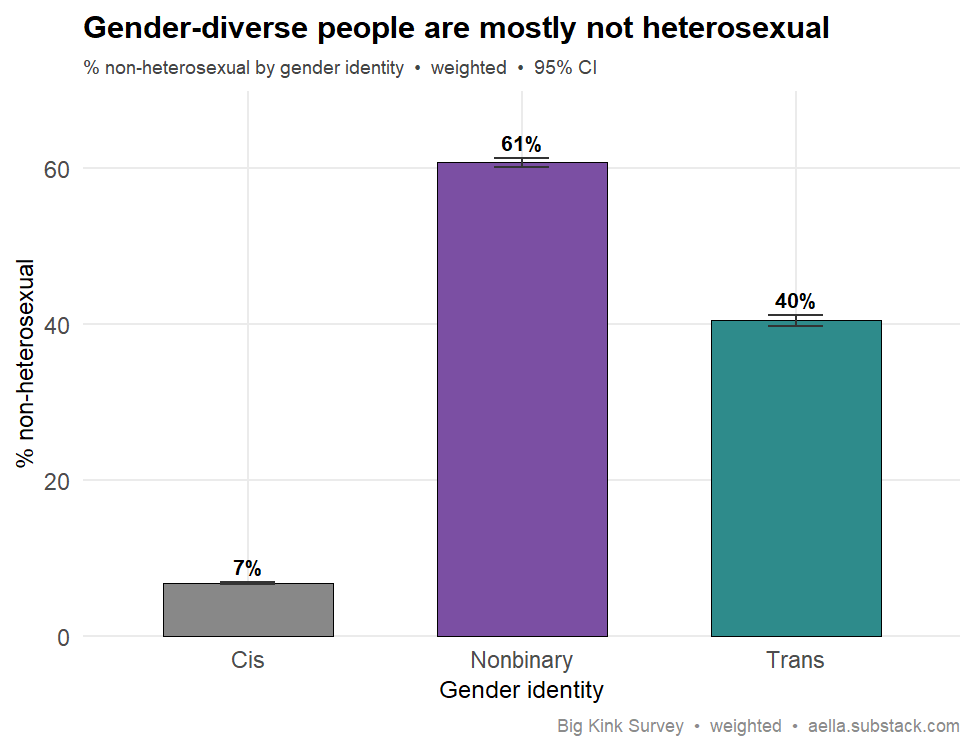
Your data: Gender-diverse respondents skew strongly non-heterosexual: weighted %non-straight is 6.8% for cis vs 60.7% nonbinary and 40.4% trans (n≈482k). Robust to weighting (cis raw 17.8%→6.8%; NB/trans nearly unchanged). Construct note: orientation here is attraction-based and classified relative to natal sex, not gender identity — a trans woman attracted only to men counts as gay here but as straight in identity-based surveys like the cited one, so the trans figure is not directly comparable to the literature. Reclassifying binary trans respondents relative to gender identity instead pushes trans non-heterosexuality to ≈81% (trans women and trans men alike). Under either coding — and especially the literature-comparable one — gender-diverse respondents are far less heterosexual than cis.
Survey question(s) asked
- “Which category fits you best?” — Man (cis) / Man (trans) / Woman (cis) / Woman (trans) / Nonbinary/other (assigned male at birth) / Nonbinary/other (assigned female at birth)
- “You're sexually attracted to people with___” — Penises, exclusively / Penises, mostly / Penises, slightly / Both equally / Vaginas, slightly / Vaginas, mostly / Vaginas, exclusively
- “You're more sexually attracted to people who appear visually” — Totally masculine … Totally feminine, 7-point
- Straight/Bisexual/Gay here are derived from these two attraction items relative to birth sex — not a self-identification question. Because the classification is referenced to natal sex, labels for trans respondents can differ from how identity-based surveys would classify them.
Sexual development & onset
92. Boys masturbate earlier than girls Not seen
The claim: Boys begin masturbating at a younger age than girls.
Best: Leitenberg, Detzer & Srebnik (1993), Archives of Sexual Behavior (by age 15, ~91% of males vs ~34% of females had masturbated). link · Backup: Bancroft, Herbenick & Reynolds (2003), in Bancroft (ed.) Sexual Development in Childhood.
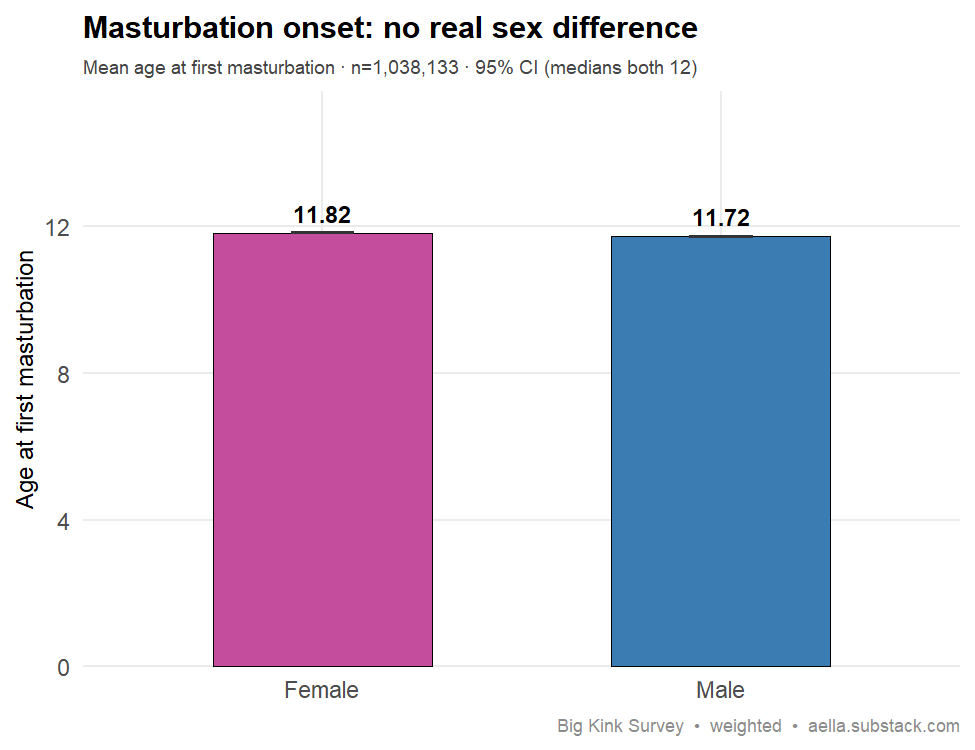
Your data: Not seen — onset is essentially equal. Age at first masturbation is nearly identical by sex: men 11.72, women 11.82 (a 0.1-year gap; 0.19 years age-adjusted), with both medians at 12 (n≈1.04M). The literature's clear "boys earlier" pattern (often a year or more) does not appear here. One caveat: this compares onset among people who masturbate, and the item top-codes at "18 or older" — 6.3% of women vs 1.0% of men land in that bin, and a further 4.4% of women vs 1.0% of men report never starting. On the cumulative-incidence measure the citation actually uses — the share who had begun by 15 — the male-earlier direction does appear (95% of men vs 82% of women), though far weaker than the cited 91% vs 34%. Self-report, retrospective, cross-sectional, kink-skewed sample.
Survey question(s) asked
- “At what age did you first begin (at least semiregularly) masturbating?” — I've never masturbated / 5 or younger / 6–17 in single years / 18 or older
- “Which category fits you best?” — Man (cis) / Man (trans) / Woman (cis) / Woman (trans) / Nonbinary/other (assigned male at birth) / Nonbinary/other (assigned female at birth)
- “5 or younger” is stored as age 4 and “18 or older” as 19; respondents who chose “I've never masturbated” have no onset age and are excluded. Men/women in this chart is sex assigned at birth, derived from the category item.
93. Sexual interests crystallize in adolescence Replicates
The claim: Paraphilic/sexual interests have onset during adolescence (a sensitive period; most before adulthood).
Best: Abel & Rouleau (1990), “The Nature and Extent of Sexual Assault,” in Handbook of Sexual Assault (Marshall, Laws & Barbaree, Eds.). · Backup: Thibaut et al. (2016), WFSBP guidelines, World J. Biol. Psychiatry — summarizes data on adolescent onset of deviant arousal. link
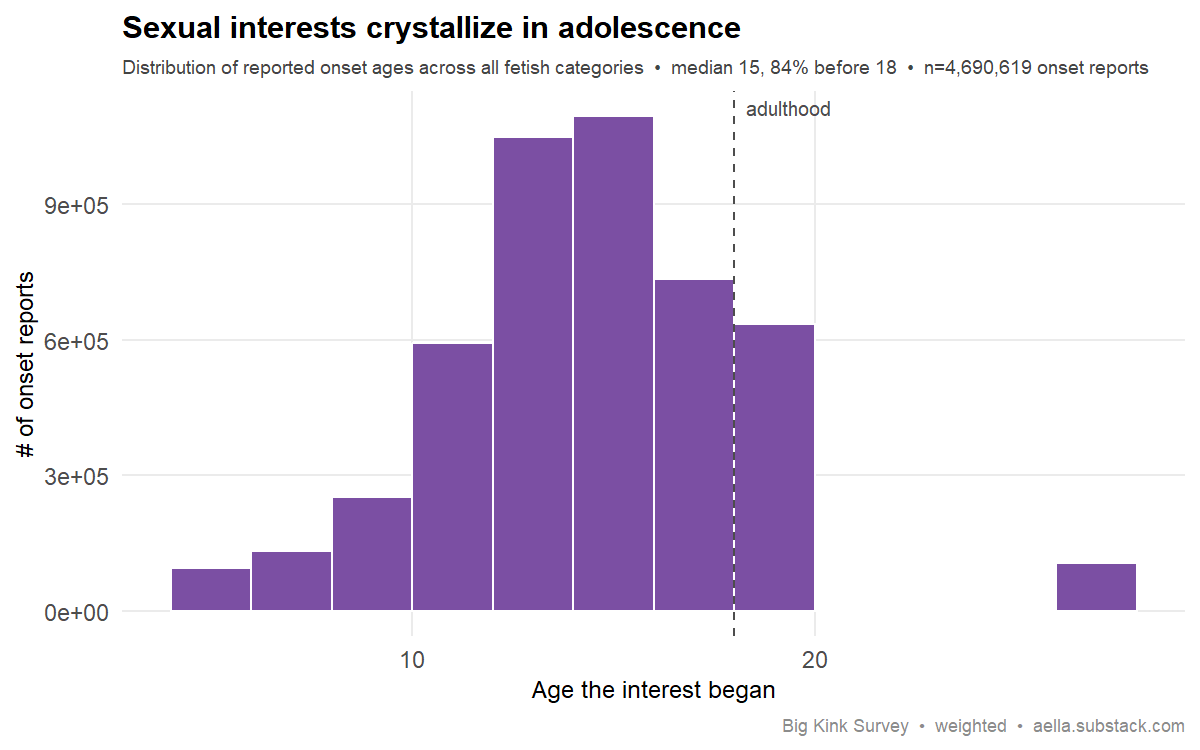
Your data: Across 29 fetish categories, median self-reported onset is age 15 and 84% of onsets fall before adulthood. Robust to per-respondent and weighted estimation and holds in both sexes (median 15 each). Sexual interests appear to crystallize in adolescence — though this is recall-based and the "critical-period" mechanism remains theoretical.
Survey question(s) asked
- “How old were you when you first experienced sexual interest in sadomasochism?” (tip: “Including pre-puberty, proto-sexual ‘fascinations’ that might not have been explicitly sexual yet”) — 0–4yo / 5–6yo / 7–8yo / 9–10yo / 11–12yo / 13–14yo / 15–16yo / 17–18yo / 19–25yo / 26yo+
- A parallel onset question is asked for each of the 29 fetish categories, only for categories the respondent checked on the “Check all the following categories that contain a thing that arouses you” checklists and rated above “Not arousing.” Bins are stored as representative ages (0–4yo→4, …, 17–18yo→17, 19–25yo→19, 26yo+→27).
Childhood → adult sexuality
94. Childhood adversity → earlier sexual debut Replicates
The claim: Childhood adversity (harsh/unpredictable environment) predicts earlier sexual debut — life-history theory.
Best: Belsky, Schlomer & Ellis (2012), Developmental Psychology 48(3):662-673. link Backup: Simpson, Griskevicius, Kuo, Sung & Collins (2012), Developmental Psychology 48(3):674-686.
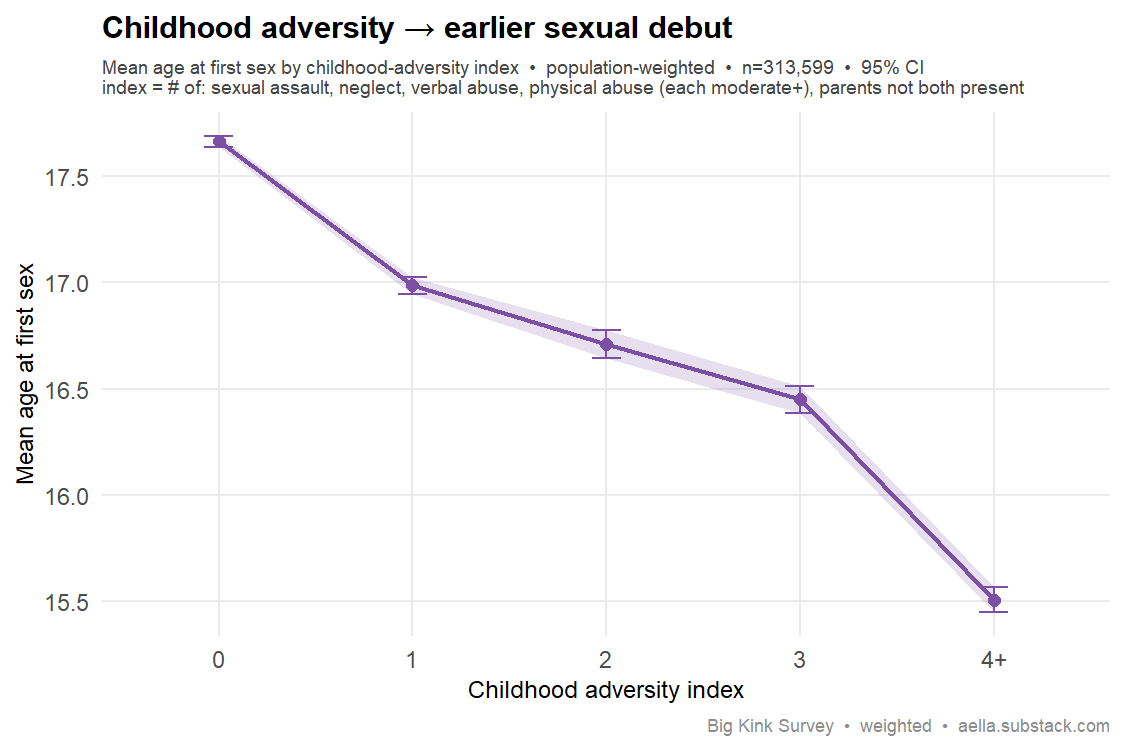
Your data: Age at first penetrative sex falls steadily across a five-flag childhood-adversity index (sexual assault, neglect, verbal abuse, physical abuse — each at least moderate — and parents not both present; respondents answering No to the abuse gate count 0 on the abuse items): 17.7 → 17.0 → 16.7 → 16.4 → 15.5 (adv 0 to 4+, population-weighted, n≈314K). The ~2-year gradient survives age adjustment (17.6 → 15.8) and holds within both sexes (male 17.8→15.7; female 17.5→15.4), so it is not a sex-composition artifact — consistent with life-history theory.
Survey question(s) asked
- “At what age did you first have penetrative sexual intercourse?” — I haven't had sex / 12 or younger / 13–25 in single years / 26–30 / 31–35 / 36–40 / 41+
- “Did you experience sexual assault in your childhood?” — No / Yes, mild / Yes, moderate / Yes, severe
- “Were you (at least semiregularly) abused as a child?” (tip: “abuse” means cruel treatment, such as significant neglect, insulting, or causing physical damage; does not include spanking) — No / Yes
- “During your childhood, how often were you … neglected? / verbally abused by an adult man? / verbally abused by an adult woman? / physically abused by a man? / physically abused by a woman?” (five items) — Never / Rarely / Sometimes / Often / Very regularly each
- The five abuse-frequency items are asked only of respondents who answered “Yes” to the abuse screener; everyone else is counted as “Never” (0) by design. The sexual-assault and abuse items are combined into the childhood-adversity index (adv0–adv4) on the x-axis. Debut bins are stored as representative ages (“12 or younger”→11, “41+”→45); “I haven't had sex” is excluded.
95. Childhood adversity → more sexual partners Replicates age-adjusted
The claim: Childhood adversity predicts more sexual partners / a faster life-history strategy.
Best: Simpson, Griskevicius, Kuo, Sung & Collins (2012), Developmental Psychology 48(2), 674–686 — early-childhood (ages 0–5) unpredictability predicted a faster life-history strategy, including more sexual partners by age 23. link Backup: Belsky, Schlomer & Ellis (2012), Developmental Psychology 48(3), 662–673.
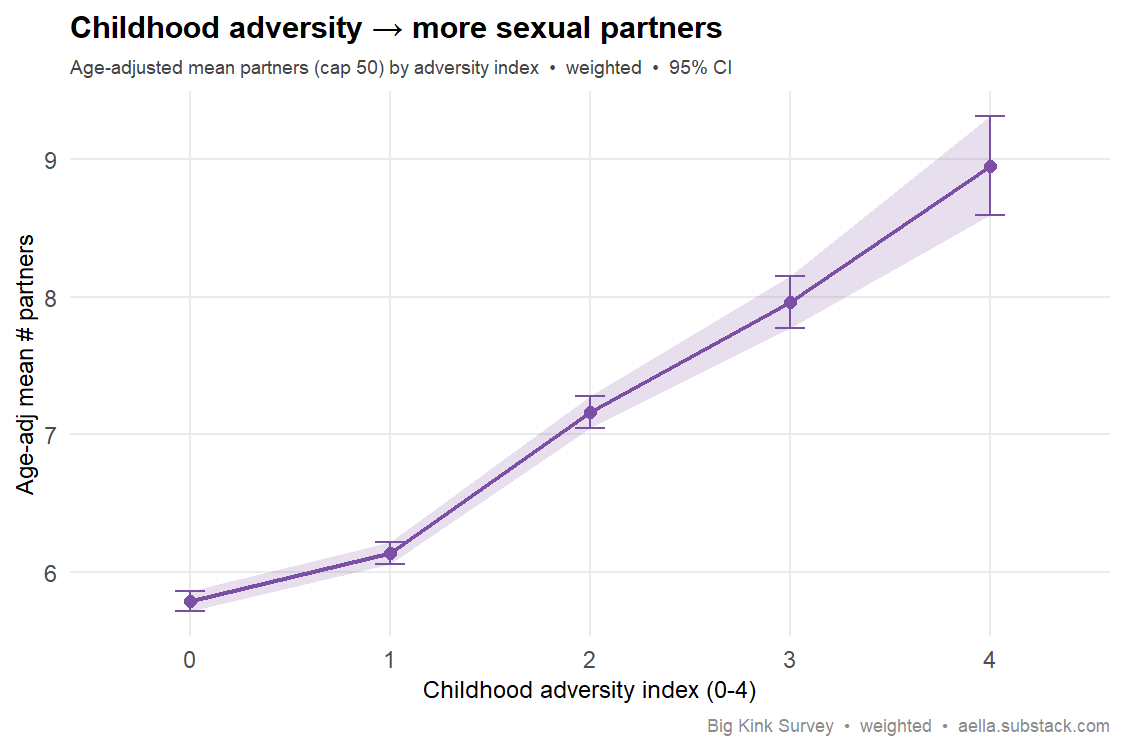
Your data: Age-adjusted partner count rises monotonically across the adversity index, ~5.8 (adv0) → ~8.9 (adv4). The gradient holds within both sexes (male and female both climb steeply), so it isn't a sex-composition artifact — consistent with a faster life-history strategy. (Index is constructed, so exact endpoints depend on the recipe; the monotonic rise is robust.)
Survey question(s) asked
- “How many people have you had sex with?” (tip: “By your definition of ‘sex’ — this typically means penetration, and sometimes includes oral sex”) — free numeric entry
- “Did you experience sexual assault in your childhood?” — No / Yes, mild / Yes, moderate / Yes, severe
- “Were you (at least semiregularly) abused as a child?” (tip: “abuse” means cruel treatment, such as significant neglect, insulting, or causing physical damage; does not include spanking) — No / Yes
- “During your childhood, how often were you … neglected? / verbally abused by an adult man? / verbally abused by an adult woman? / physically abused by a man? / physically abused by a woman?” (five items) — Never / Rarely / Sometimes / Often / Very regularly each
- The five abuse-frequency items are asked only of respondents who answered “Yes” to the abuse screener; everyone else is counted as “Never” (0) by design. The sexual-assault and abuse items are combined into the childhood-adversity index (adv0–adv4) on the x-axis.
96. Father absence → more sexual partners Weak / partial full sample
The claim: Father absence predicts more partners / faster reproduction. The meta-analytic effect is small and partly confounded.
Best: Webster et al. (2014), Evolutionary Psychology — meta-analysis of father absence and age at menarche in daughters (33 studies, N≈70,403; weighted r=.14). The "more partners / faster reproduction" extension comes from the broader life-history literature (Ellis 2003; Quinlan 2003), which is itself predominantly female-focused. link
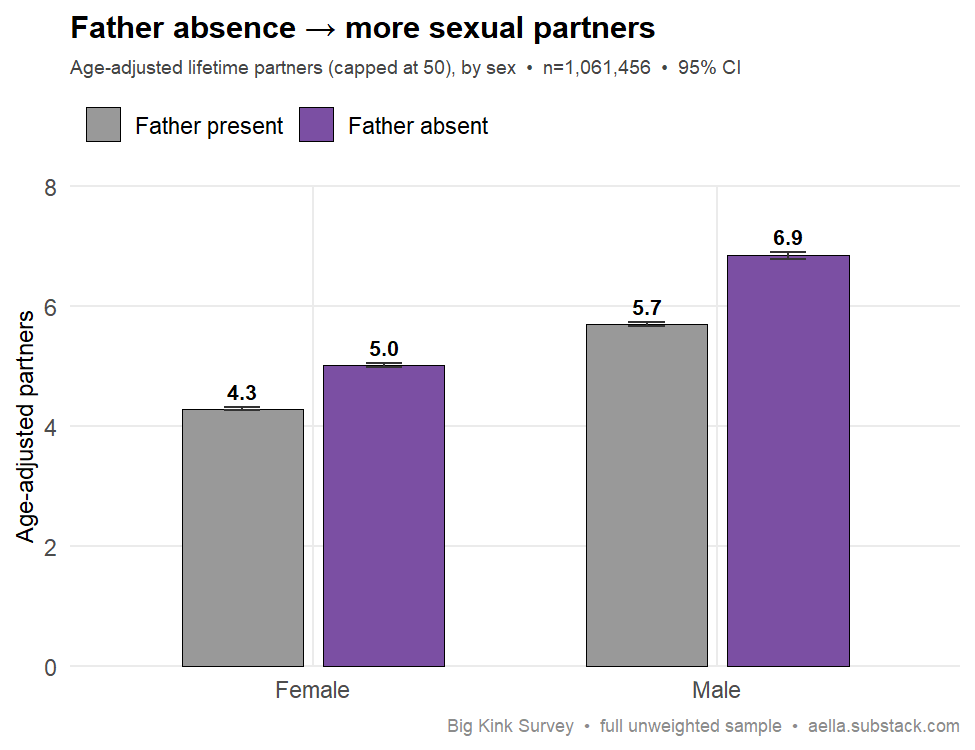
Your data: Father-absent respondents report more lifetime partners, and the gap survives age-adjustment and a sex-split. On the full unweighted sample (ages 14–75, n≈1.06M), age-adjusted partner counts are 5.7 vs 4.8 (absent vs present, partner counts capped at 50), a gap of ~0.9 partners (p≈10⁻⁵¹²). Sex-split (age-adjusted): men 6.9 vs 5.7 (+1.1), women 5.0 vs 4.3 (+0.7) — both highly significant, so it isn't a sex-confound artifact. Two honest caveats: the absolute gap is small (~1 partner), and the effect is actually larger in men in our data, whereas the cited literature is about earlier menarche in daughters specifically and the partner-count extension has historically focused on females. Directionally consistent with the life-history framework, but modest in magnitude and not a one-to-one test of the cited menarche meta-analysis.
Survey question(s) asked
- “Which best describes your parents' presence in your lives?” — Both mother and father present / Mother present, father absent / Father present, mother absent / Both mother and father absent
- “How many people have you had sex with?” (tip: “By your definition of ‘sex’ — this typically means penetration, and sometimes includes oral sex”) — free numeric entry
- “Father present” pools the both-present and father-only options; “father absent” pools mother-only and both-absent.
97. Childhood adversity → broader kink interests Replicates
The claim: Childhood trauma/adversity predicts more paraphilic or varied sexual interests. (Smaller, correlational literature.)
Best: Longpré, Galiano & Guay (2022), J. Criminal Justice. link
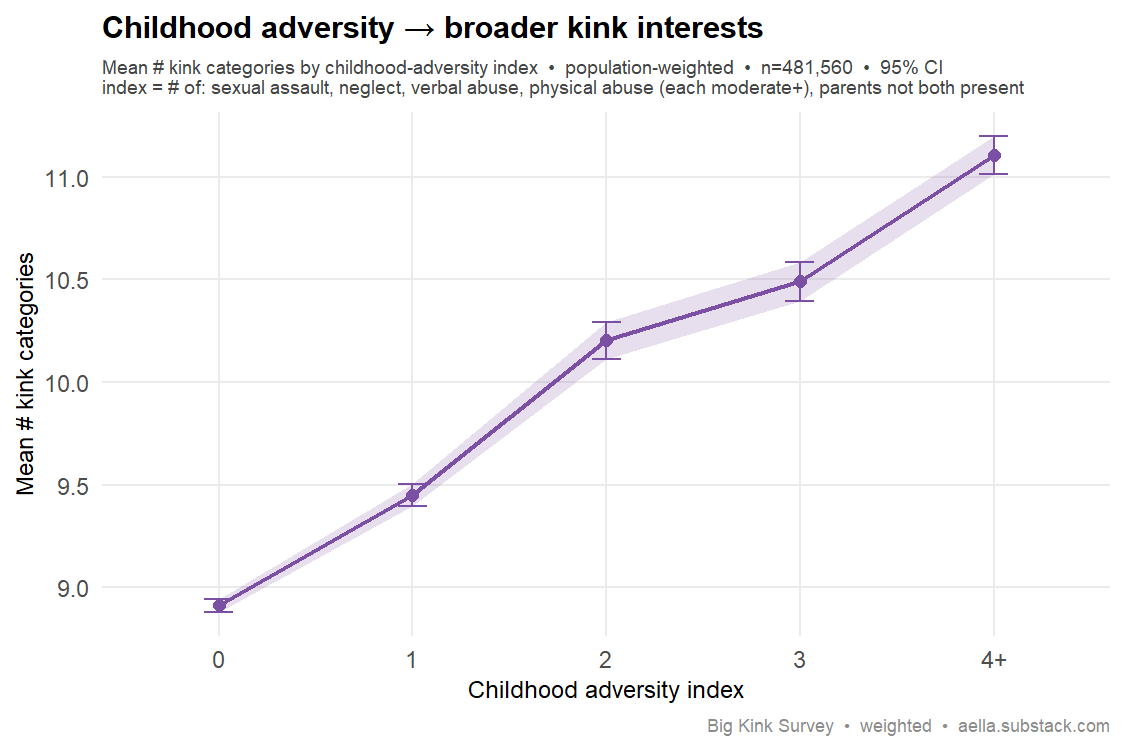
Your data: Kink breadth rises steadily with a five-flag childhood-adversity index (sexual assault, neglect, verbal abuse, physical abuse — each at least moderate — and parents not both present), ~8.9 (adv 0) → ~11.1 (adv 4+) categories (population-weighted, n≈482K). The dose-response holds within both sexes (age-adjusted Spearman r ≈ 0.14 men, 0.18 women), so it isn't a sex-composition artifact. Controlling additionally for self-reported mental-illness burden cuts the correlation roughly in half (to r ≈ 0.07) without eliminating it — plausibly a mediating pathway rather than a pure confound. Correlational, and consistent with the (tentative) literature.
Survey question(s) asked
- “Common things: Check all the following categories that contain a thing that arouses you.” — checkbox, 16 categories (Bondage, Clothing, Incest, Power dynamics & D/s, Sadomasochism, etc.)
- “Uncommon things: Check all the following categories that contain a thing that arouses you.” — checkbox, 13 categories (Bestiality/creatures, Genderplay, Transformations, Vore, etc.)
- “Did you experience sexual assault in your childhood?” — No / Yes, mild / Yes, moderate / Yes, severe
- “Were you (at least semiregularly) abused as a child?” (tip: “abuse” means cruel treatment, such as significant neglect, insulting, or causing physical damage; does not include spanking) — No / Yes
- “During your childhood, how often were you … neglected? / verbally abused by an adult man? / verbally abused by an adult woman? / physically abused by a man? / physically abused by a woman?” (five items) — Never / Rarely / Sometimes / Often / Very regularly each
- Kink breadth = the number of categories checked across the two checklists (0–29). The abuse-frequency items are asked only of respondents who answered “Yes” to the abuse screener; everyone else is counted as “Never” (0) by design, and these items plus the sexual-assault item form the childhood-adversity index (adv0–adv4).
98. Repressive upbringing → sexual shame Weak
The claim: Sexually repressive / religious "purity culture" upbringing predicts more adult sexual shame.
Best: Muskrat et al. (2025), The Counseling Psychologist. link
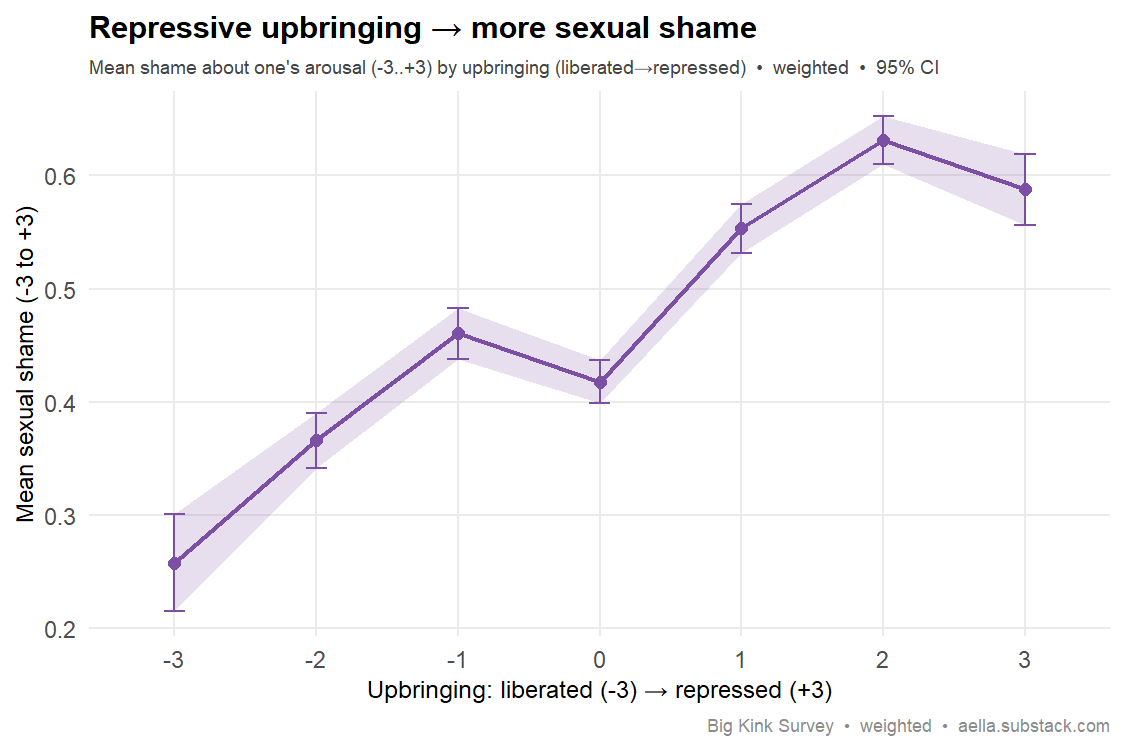
Your data: Self-reported shame about one's own arousal rises with a repressive upbringing — weighted mean climbs from ~0.26 (highly liberated) to ~0.59–0.63 at the repressed end of a −3…+3 scale, though not strictly monotonically (the neutral midpoint dips below the level before it, and the top level sits a shade under the one preceding it). The direction is robust and survives a sex-split (stronger in men), but the overall linear correlation is small (r ≈ 0.05), so call it a clear-but-weak effect. The item measures how sexually repressive the upbringing was generally — religious purity culture is one variant, not the specific thing measured.
Survey question(s) asked
- “How ‘sexually liberated’ was your upbringing?” (tip: “Highly repressed” might be a highly conservative religious community where ankles must be covered, and “Highly liberated” might be a community where free love, nudity, or sexual expression was encouraged) — Highly repressed / Moderately repressed / Slightly repressed / Equally repressed/liberated / Slightly liberated / Moderately liberated / Highly liberated
- “I am ashamed or embarrassed about at least some of what arouses me” — Totally agree (+3) / Agree / Somewhat agree / Neither / Somewhat disagree / Disagree / Totally disagree (−3)
- The upbringing item measures general sexual repressiveness of the childhood environment — a conservative religious community is the tip's example of “highly repressed,” but the item is not religion-specific.
99. Childhood sexual abuse → sexual shame Replicates
The claim: Childhood sexual abuse predicts adult sexual shame/guilt.
Best: MacGinley, Breckenridge & Mowll (2019), Health & Social Care in the Community (review). link
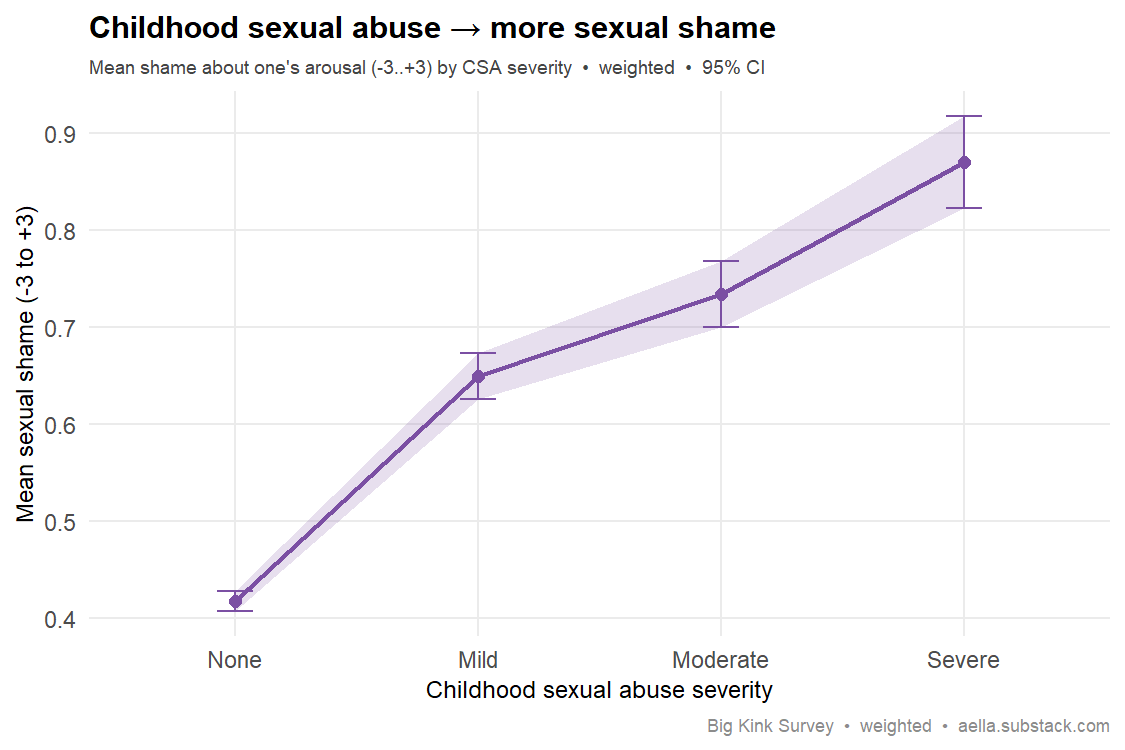
Your data: Shame about one's arousal climbs monotonically with CSA severity: weighted mean 0.42 (none) → 0.65 → 0.73 → 0.87 (severe). The gradient survives a sex-split (clean in women; rising but noisier in men). Large Ns. A clear replication, though the absolute shift is moderate on the −3…+3 scale.
Survey question(s) asked
- “Did you experience sexual assault in your childhood?” — No / Yes, mild / Yes, moderate / Yes, severe
- “I am ashamed or embarrassed about at least some of what arouses me” — Totally agree (+3) / Agree / Somewhat agree / Neither / Somewhat disagree / Disagree / Totally disagree (−3)
Personality → sexual debut
100. Extraversion → earlier sexual debut Replicates
The claim: Extraversion predicts earlier sexual debut.
Best: Allen & Walter (2018), Psychological Bulletin 144(10):1081–1110, meta-analysis of Big Five & sexuality (extraversion linked to greater/earlier sexual activity). link Backup: see e.g. Martin, Eysenck & colleagues and later reviews reporting a negative association between extraversion and age at first intercourse (earlier debut).
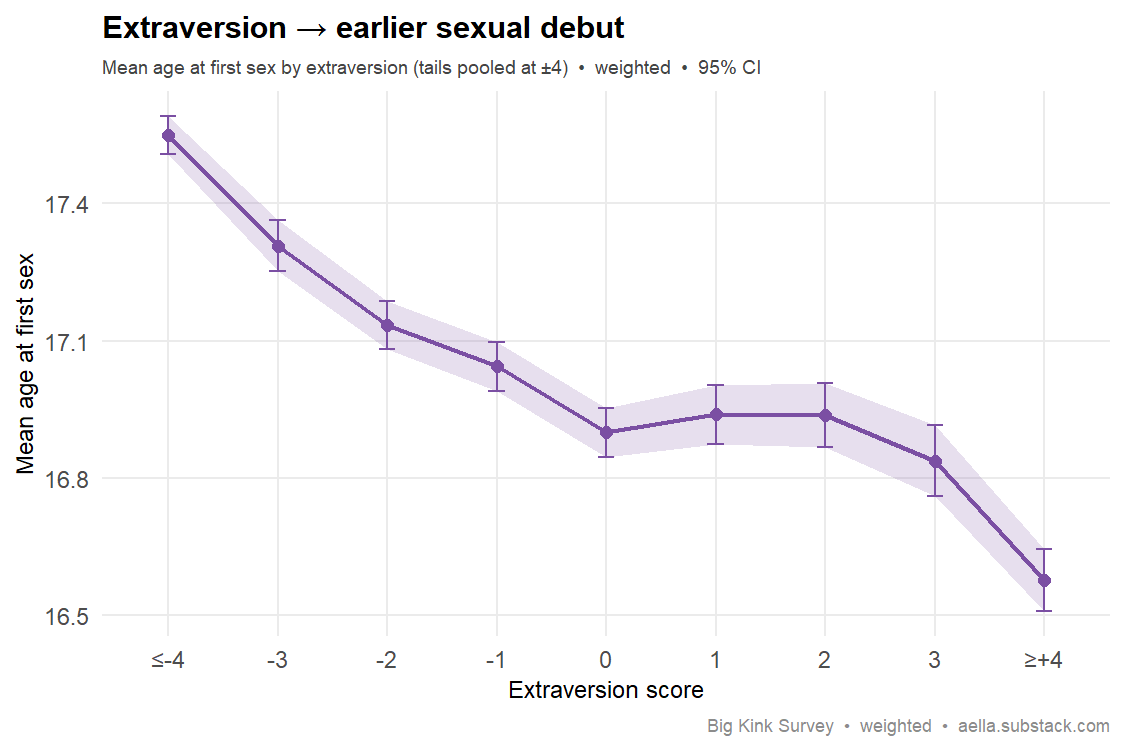
Your data: Extraverts report earlier first intercourse: strong introverts debut at 17.5 vs strong extraverts at 16.7 (weighted). The association is small but robust (r ≈ −0.075) and holds within both sexes (men steeper), so it isn't a sex-pooling artifact.
Survey question(s) asked
- “I am the life of the party” — Totally agree (+3) / Agree / Somewhat agree / Neither / Somewhat disagree / Disagree / Totally disagree (−3)
- “I am quiet around strangers” — same 7-point agreement scale
- “At what age did you first have penetrative sexual intercourse?” — I haven't had sex / 12 or younger / 13–25 in single years / 26–30 / 31–35 / 36–40 / 41+
- Extraversion = agreement with “life of the party” minus agreement with “quiet around strangers” (−6…+6) — a thin 2-item score, not a full Big Five inventory. Debut bins are stored as representative ages (“12 or younger”→11, “41+”→45).
101. Conscientiousness → later sexual debut Weak (age-confounded)
The claim: Conscientiousness / self-control predicts later sexual debut (delayed initiation).
Best: Allen & Walter (2018), Psychological Bulletin. link
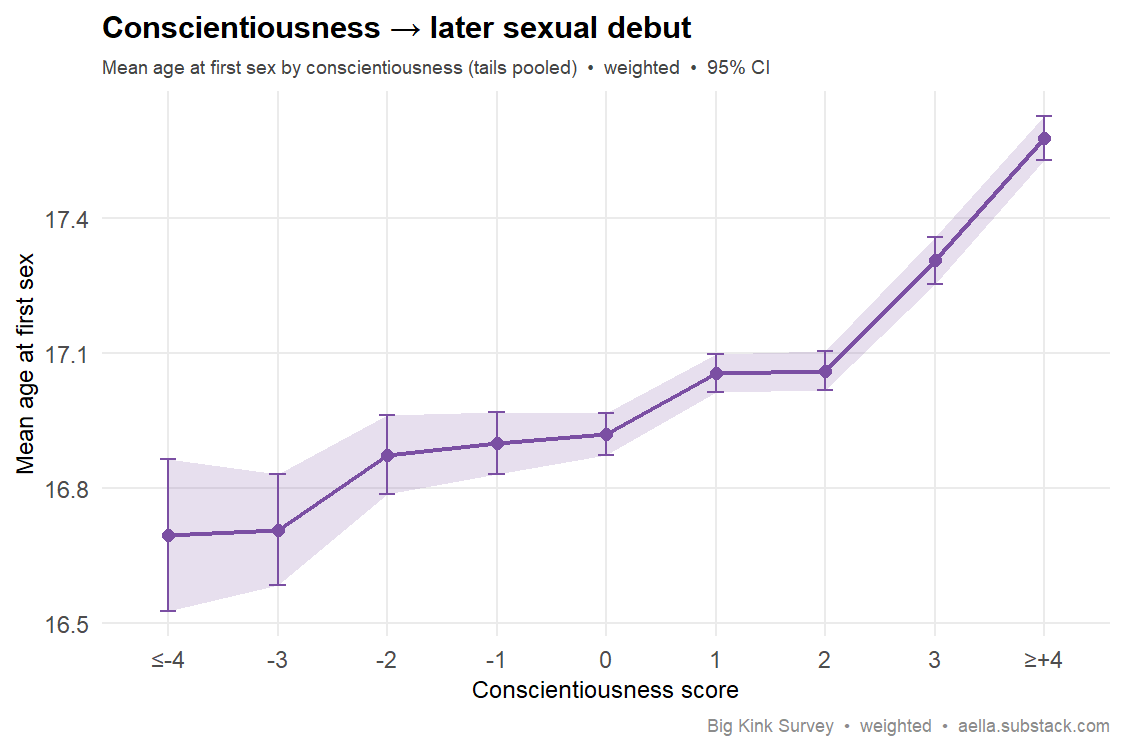
Your data: The raw direction is right (more conscientious → slightly later debut) but it is age-confounded: among adults the rank correlation is +0.04 raw and +0.006 after age adjustment — essentially zero within same-age people. Conscientiousness here is also a thin 2-item score. So the predicted later-debut effect does not hold once age is handled. (Same near-zero in both sexes.)
Survey question(s) asked
- “I like order” — Totally agree (+3) / Agree / Somewhat agree / Neither / Somewhat disagree / Disagree / Totally disagree (−3)
- “I shirk my duties” — same 7-point agreement scale
- “At what age did you first have penetrative sexual intercourse?” — I haven't had sex / 12 or younger / 13–25 in single years / 26–30 / 31–35 / 36–40 / 41+
- Conscientiousness = agreement with “I like order” minus agreement with “I shirk my duties” (−6…+6) — the 2-item score the card itself flags as thin. Debut bins are stored as representative ages (“12 or younger”→11, “41+”→45).
Sex differences in kink
102. Submission more common than dominance Replicates full sample
The claim: Sexual submission interests are more common than dominance ones. (The literature flags this as sex-dependent.)
Best: Joyal, Cossette & Lapierre (2015), J. Sexual Medicine. link
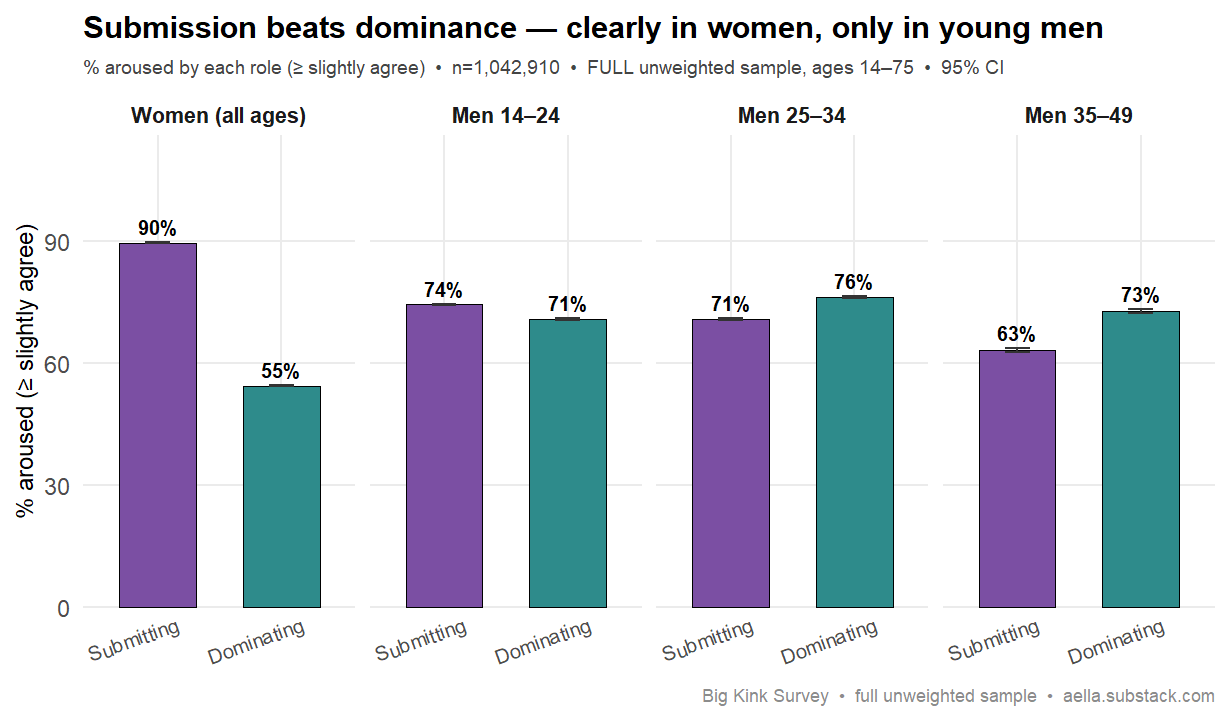
Your data: Pooled, submission wins clearly: 83% vs 61% at least slightly agree (full sample, ages 14–75, n≈1.04M). In women the gap is huge at every age (90% vs 55% overall). In men the pooled result is a near-tie (72% vs 72%, submission fractionally ahead) — and the tie is a composition effect: men under 25 (~65% of male respondents) lean slightly sub (74% vs 71%), while men 25–34 (76% dom vs 71% sub) and 35–49 (73% vs 63%) lean dominant. The ordering replicates cleanly overall and in women, matching Joyal et al.; in men it holds only among the under-25s. Self-report of arousal, cross-sectional.
Survey question(s) asked
- “I am aroused by being dominant in sexual interactions” — Totally agree (+3) / Agree / Somewhat agree / Neither / Somewhat disagree / Disagree / Totally disagree (−3)
- “I am aroused by being submissive in sexual interactions” — same 7-point agreement scale
- The card's percentages count responses of “Somewhat agree” (+1) or higher. Men/women = sex assigned at birth, from the “Which category fits you best?” item.
103. Masochism more common than sadism Reverses in men
The claim: Masochism (enjoying receiving pain) is more common than sadism (enjoying giving pain).
Best: Joyal & Carpentier (2017), J. Sex Research 54(2):161–171. link · Backup: Brown, Barker & Rahman (2020), J. Sex Research (BDSM scoping review).
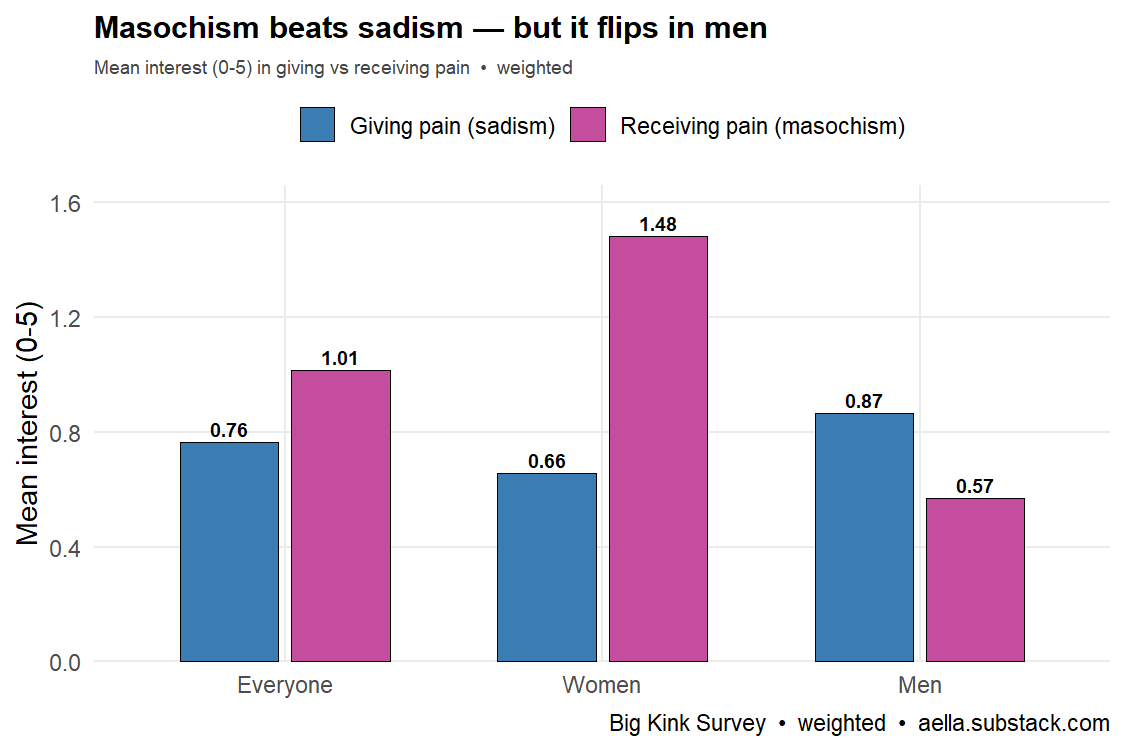
Your data: Pooled, interest in receiving pain (mean 1.01) exceeds giving pain (0.76) on the population-weighted sample, so masochism > sadism overall. But it reverses by sex: in men, giving pain (0.87) outscores receiving (0.57) — sadism wins — while in women receiving (1.48) dwarfs giving (0.66). The headline holds only because women drive the average. In the full unweighted sample (ages 14–75) the male reversal keeps its direction but narrows to a sliver (0.94 vs 0.86). Prevalence agrees: 32% report any interest in receiving pain vs 27% in giving (weighted). Intensity is a 0–8 arousal scale, and the pain items were asked only of the 36% (weighted) who checked the Sadomasochism category — everyone else counts as zero interest, so these are population-level means that include those zeros by design.
Survey question(s) asked
- “In erotic contexts, I find receiving pain to be:” — Not arousing (0) / Slightly arousing (1) / Somewhat arousing (2) / Moderately arousing (3) / Very arousing (5) / Extremely arousing (8)
- “In erotic contexts, I find giving pain to others to be:” — same scale
- Both items are asked only of respondents who checked the “Sadomasochism (spanking, needle play, clamps, torture, etc.)” category and rated it above “Not arousing”; everyone else is counted as 0 / no interest, by design. Means are computed on the scale's stored values (0, 1, 2, 3, 5, 8), so they are not on the −3…+3 agreement metric used by neighboring cards.
104. Cross-dressing interest higher in men Replicates
The claim: Cross-dressing / transvestic interest is far more common in men than women.
Best: Långström & Zucker (2005), J. Sex & Marital Therapy (Swedish national sample). link
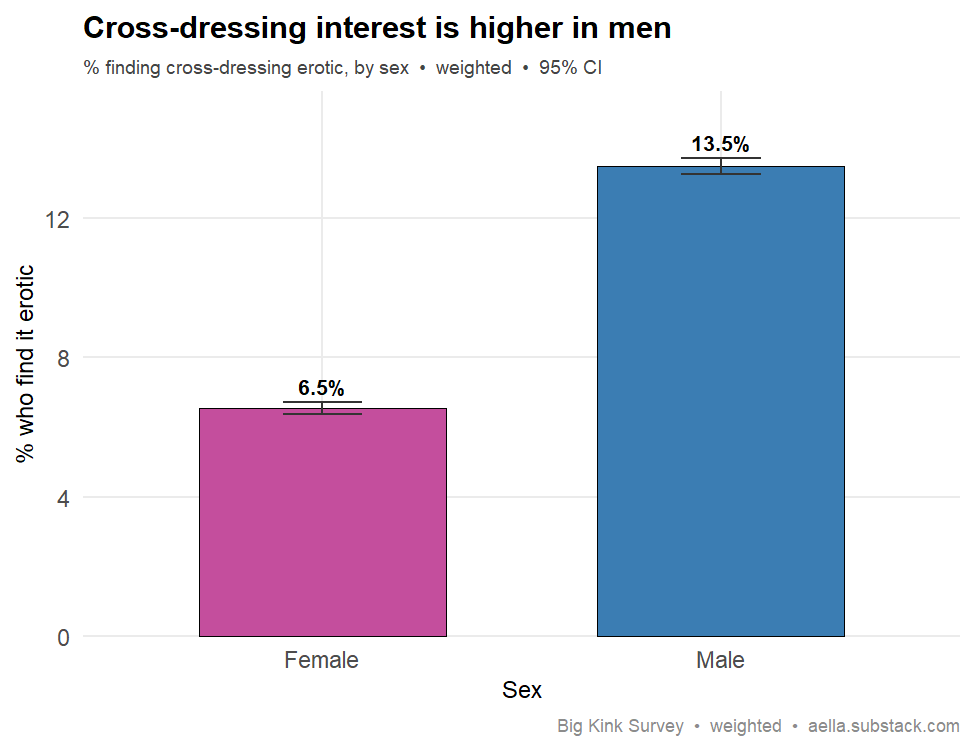
Your data: Men are ~2x more likely to find cross-dressing erotic: weighted 13.5% (men) vs 6.5% (women), n≈482k. The gap is robust in the full unweighted sample (25.6% vs 13.8%) and among cis respondents only (20.5% vs 9.0%) — a ~2x male skew in every cut. The measured item is the “crossdressing (passably)” checkbox, reached only through the Genderplay category funnel — anyone who never reached it counts as not interested — so these prevalences are lower bounds. Transvestic interest skews strongly male, replicating Långström & Zucker.
Survey question(s) asked
- “Which of the following do you find erotic?” — checkbox incl. “Crossdressing (passably; people can't tell)”, “Crossdressing (nonpassing, people can tell)”, “Acting like the opposite gender”, “Sissification (degredation by feminization)”, “Androgyny”, etc.
- This checkbox is reached only by respondents who checked “Genderplay (sissification, futa, crossdressing, etc.)” on the category checklist and rated it above “Not arousing”; everyone else is counted as not interested, by design. The analyzed measure is the “Crossdressing (passably…)” option; checking only the nonpassing option is not counted. Men/women = sex assigned at birth, from the “Which category fits you best?” item.
Mate value & life course
105. Taller men rate themselves more attractive Replicates
The claim: Taller men have higher mate value / rate themselves (and are rated) more attractive. (Effect is culturally variable.)
Best: Buunk, Fernández & Muñoz-Reyes (2019), Evolutionary Behavioral Sciences 13(1):93–100. link · Backup: Stulp, Buunk & Pollet (2013), Personality & Individual Differences.
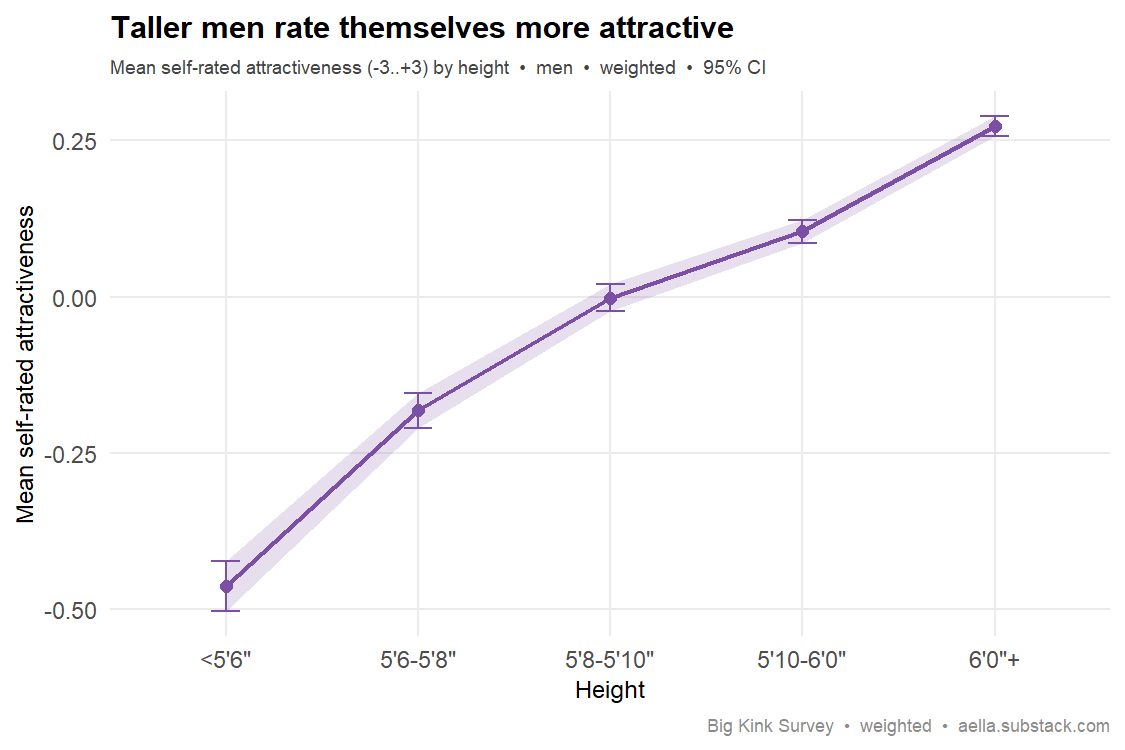
Your data: Among men, self-rated attractiveness rises with height: short (<5'8") −0.27 → tall (6ft+) +0.27 on a −3/+3 scale (r ≈ 0.12). The pattern is male-specific — women show near-flat r ≈ 0.03, with the tallest rating themselves slightly lower — consistent with male height as mate value (effect culturally variable).
Survey question(s) asked
- “What's your height?” — 19 options from <5'0" (<152cm) to 6'6+ (198cm), coded 60–78 inches
- “Compared to other people of your same gender and age range, you are” — Significantly less attractive (−3) / Moderately less / Slightly less / About average attractiveness (0) / Slightly more / Moderately more / Significantly more attractive (+3)
- “Which category fits you best?” — Man (cis) / Man (trans) / Woman (cis) / Woman (trans) / Nonbinary/other (assigned male at birth) / Nonbinary/other (assigned female at birth)
- The attractiveness item is an explicitly relative self-rating (vs. people of your same gender and age range). “Men” and “women” in this card are biological sex derived from the category item.
106. Older people are more likely partnered Replicates
The claim: Older adults are more likely to be in a committed/married relationship (life-course).
Best: Pew Research Center (2019), The Landscape of Marriage and Cohabitation in the U.S. link
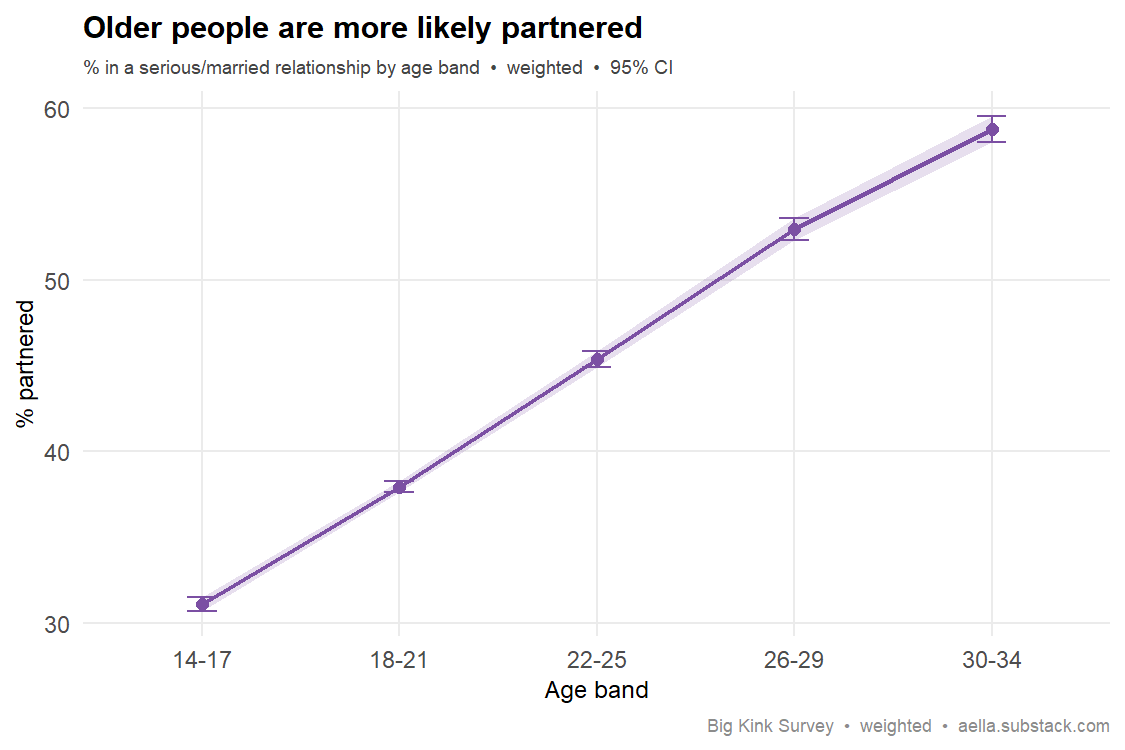
Your data: The share in a serious/married relationship rises monotonically with age: 33% (14–19) → 43% → 52% → 59% (30–34). The slope holds in both sexes. A clean life-course regularity — though the weighted sample is topcoded at 34, so only the young-adult ramp is observed.
Survey question(s) asked
- “How old are you?” — free numeric entry (years)
- “Your romantic relationship status is:” — Single / Relationship (casual) / Relationship (serious) / Relationship (married) (tip: “If you have multiple romantic relationships, answer for the most serious one”)
- “Partnered” in this card = the serious or married options.
107. Religious upbringing → later sexual debut Replicates
The claim: Religious upbringing predicts later sexual debut.
Best: Landor et al. (2011), J. Youth & Adolescence, 40(3), 296–309. link
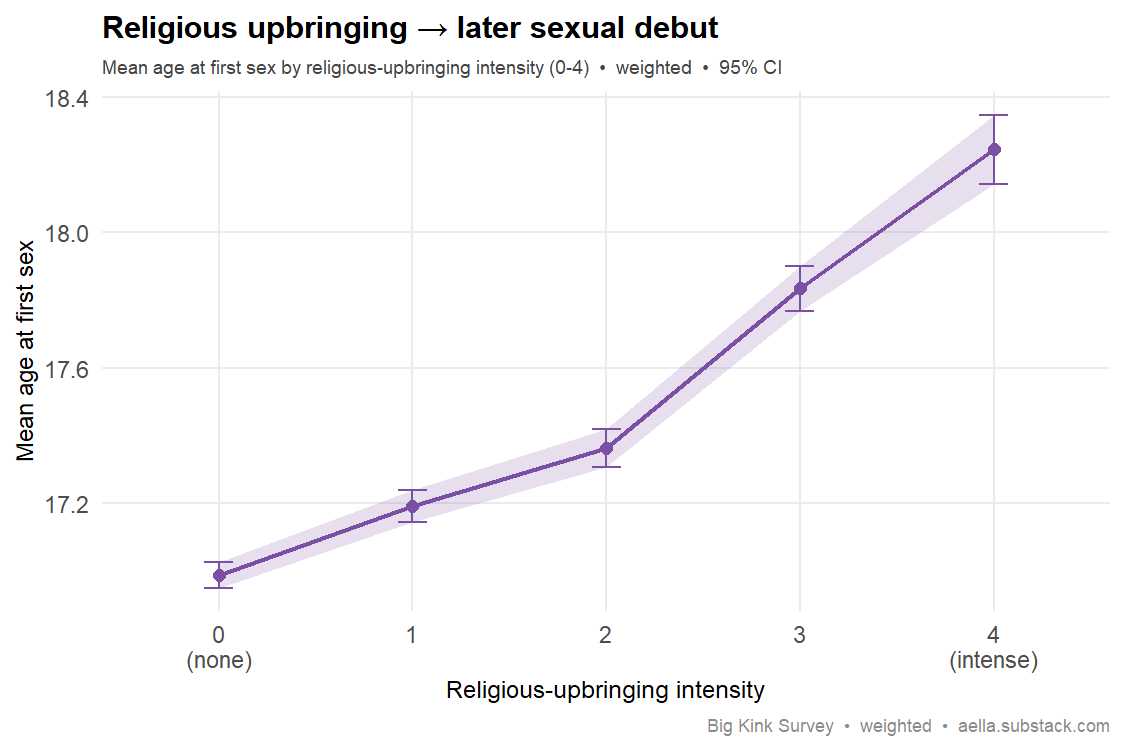
Your data: Mean age at first penetrative sex climbs monotonically with the intensity of one's religious upbringing: 17.0 at "not at all important" rising to 18.2 at "absolutely essential" — a ~1.3-year delay on the population-weighted sample. The gradient holds within both sexes (men 17.3→18.6; women 16.6→18.0). Respondents who haven't debuted are excluded, which right-censors the young; the censoring-robust check — ages 25+ in the full unweighted sample — still climbs 17.8→18.9 (~1.2 years). Uses the childhood-upbringing internal-adherence measure.
Survey question(s) asked
- “What religion did you grow up in?” — None or performative/casual religion / 12 specific religions (Christianity protestant/catholic/other, Judaism, Islam, Hinduism, Buddhism, Chinese traditional religion, Sikhism, Bahai, Jainism, Shinto) / Anti-religious/explicitly atheist / Other
- “How important was INTERNAL adherence to the religion? For example: feeling guilty, private prayer, getting ‘right with god’, achieving specific mental states, etc.?” — Not at all important (0) / Slightly important (1) / Moderately important (2) / Very important (3) / Absolutely essentially important (4) (tip: “As in: how much emphasis did your culture place on making sure people's internal mental states were obedient to religion”)
- “At what age did you first have penetrative sexual intercourse?” — I haven't had sex / 12 or younger / single years 13–25 / 26–30 / 31–35 / 36–40 / 41+
- The adherence item was only asked of respondents whose childhood religion wasn't “None or performative/casual religion”, and it was removed from the live survey in March 2026 — so it reflects respondents who took the survey before then.
- Respondents answering “I haven't had sex” have no debut age and are excluded.
Eating disorders, OCD & autism
108. Eating disorders ↔ anxiety co-occur Replicates
The claim: Eating disorders are highly comorbid with anxiety disorders.
Best: Kaye, Bulik, Thornton, Barbarich & Masters (2004), American Journal of Psychiatry. link
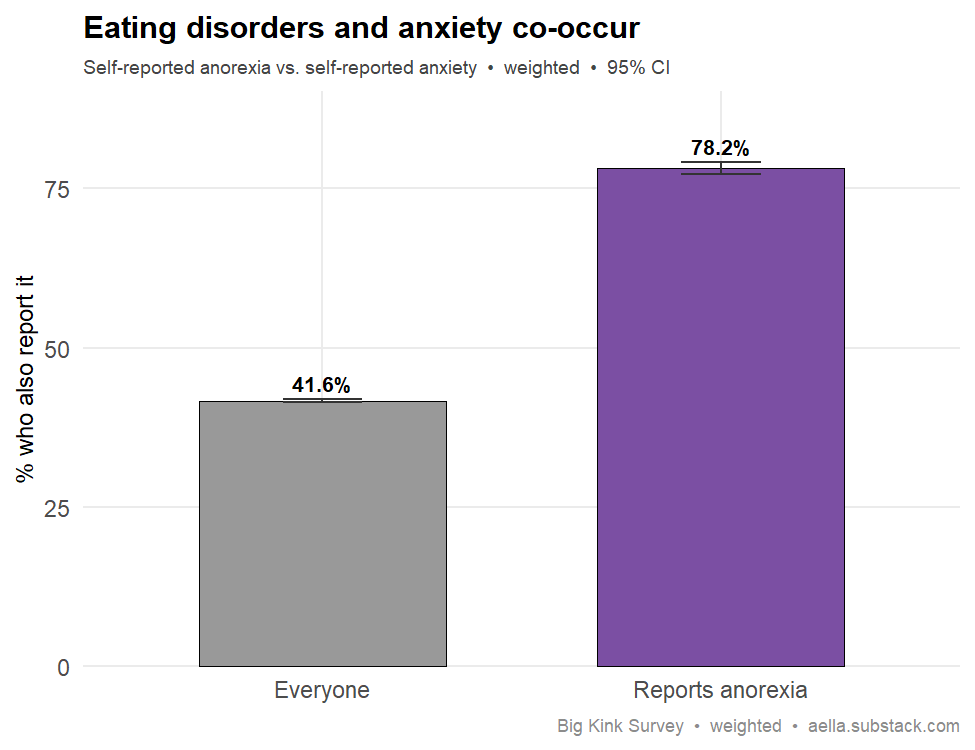
Your data: Replicates strongly. Weighted, 78.2% of respondents reporting anorexia also report anxiety, versus 41.6% of everyone (relative risk 1.88; n=23,161 with anorexia). The lift holds in both sexes (Female 57.3%→79.4%; Male 26.6%→70.1%), so it is not a sex-composition artifact, though both items share self-report. Kaye et al. (2004) similarly found ~two-thirds of eating-disorder patients have a lifetime anxiety disorder.
Survey question(s) asked
- “Do you have any of the following” — checkbox listing 19 conditions (ADHD, Anorexia, Anxiety, Autism, … Substance Abuse Disorder); tip: “Please only check if they're 'moderate to severe'”. This card uses the “Anorexia” and “Anxiety” boxes, checked vs not.
- Self-reported presence of a moderate-to-severe condition — not a question about clinical diagnosis.
109. Body dysmorphia ↔ eating disorders co-occur Replicates
The claim: Body dysmorphic disorder and eating disorders are highly comorbid.
Best: Ruffolo, Phillips, Menard, Fay & Weisberg (2006), International Journal of Eating Disorders. link
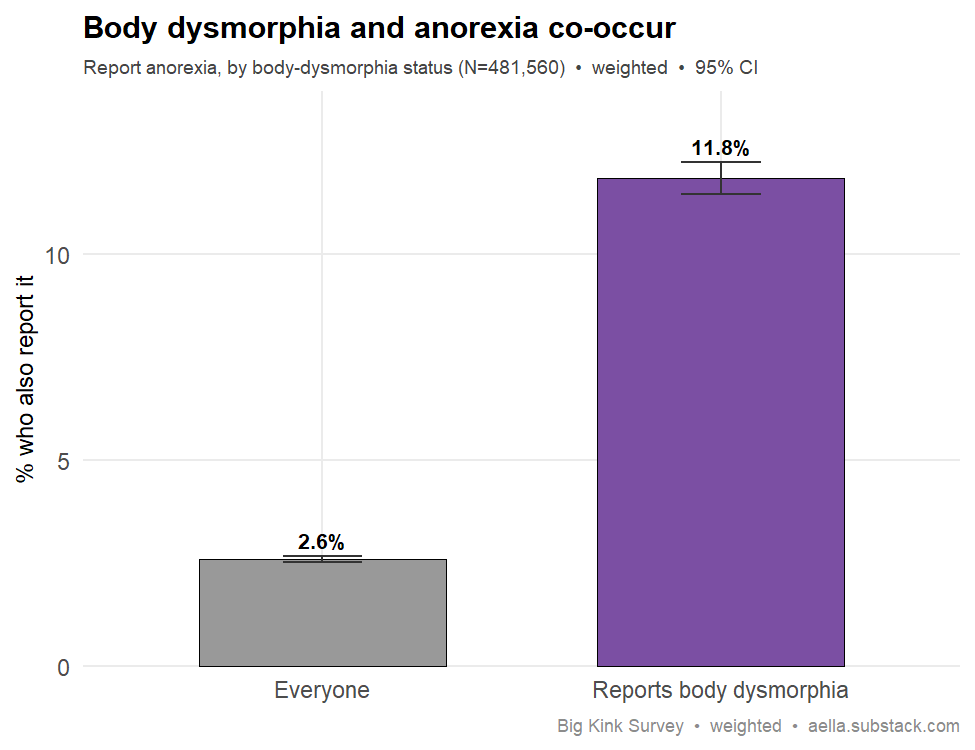
Your data: Replicates. Among the 86,600 respondents who report body dysmorphia, 11.8% also report anorexia versus 2.6% of everyone — a 4.5x elevation, with non-overlapping CIs. The relationship is bidirectional (61% of anorexia reporters also report body dysmorphia) and survives a sex-split (RR 3.0x in women, 7.7x in men). This mirrors Ruffolo et al. (2006), who found ~60% of eating-disorder patients screen positive for BDD.
Survey question(s) asked
- “Do you have any of the following” — checkbox listing 19 conditions (ADHD, Anorexia, Anxiety, Autism, … Substance Abuse Disorder); tip: “Please only check if they're 'moderate to severe'”. This card uses the “Body Dysmorphia” and “Anorexia” boxes, checked vs not.
- Self-reported presence of a moderate-to-severe condition — not a question about clinical diagnosis.
110. OCD ↔ eating disorders co-occur Replicates
The claim: OCD is strongly comorbid with eating disorders.
Best: Drakes et al. (2021), Journal of Psychiatric Research. link
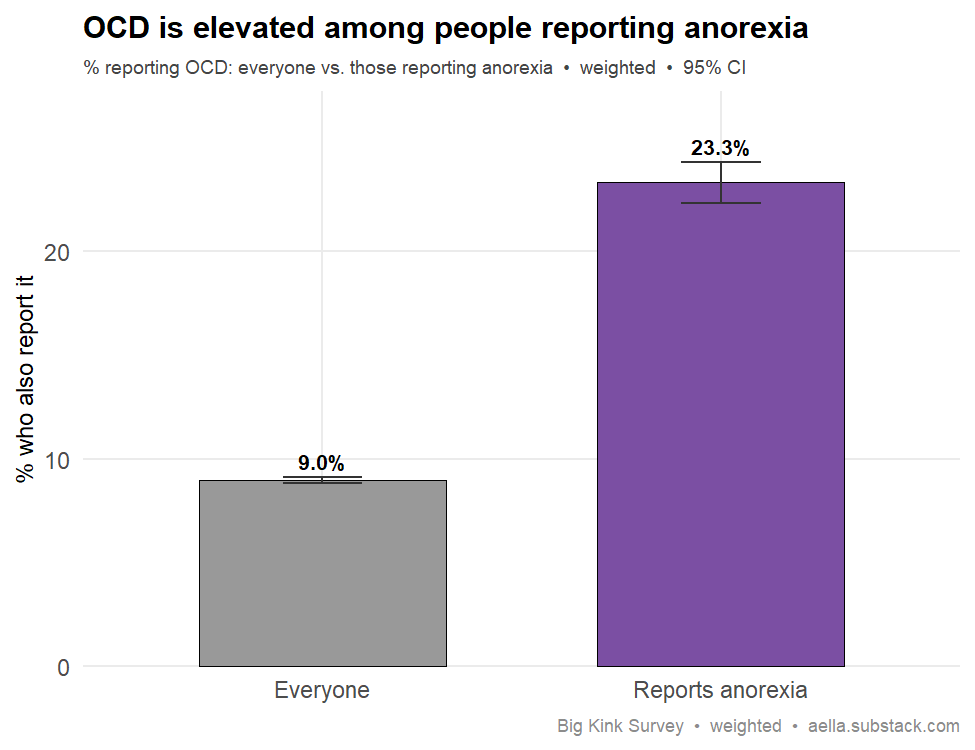
Your data: Replicates. Among respondents reporting anorexia, 23.3% also report OCD versus a 9.0% baseline — a 2.6x elevation. The pattern holds within both sexes (females 11.5%→23.6%, males 6.6%→21.2%), so it isn't a sex-composition artifact. This matches the clinical literature: Drakes et al.'s meta-analysis found ~13.9% lifetime OCD prevalence in eating disorders. (Self-reported moderate-to-severe conditions, not diagnoses.)
Survey question(s) asked
- “Do you have any of the following” — checkbox listing 19 conditions (ADHD, Anorexia, Anxiety, Autism, … Substance Abuse Disorder); tip: “Please only check if they're 'moderate to severe'”. This card uses the “OCD” and “Anorexia” boxes, checked vs not.
- Self-reported presence of a moderate-to-severe condition — not a question about clinical diagnosis.
111. Autism ↔ OCD co-occur Replicates
The claim: Autism and OCD are highly comorbid: each substantially elevates the reported rate of the other.
Best: Aymerich et al. (2024), Brain Sciences 14(4):379. link
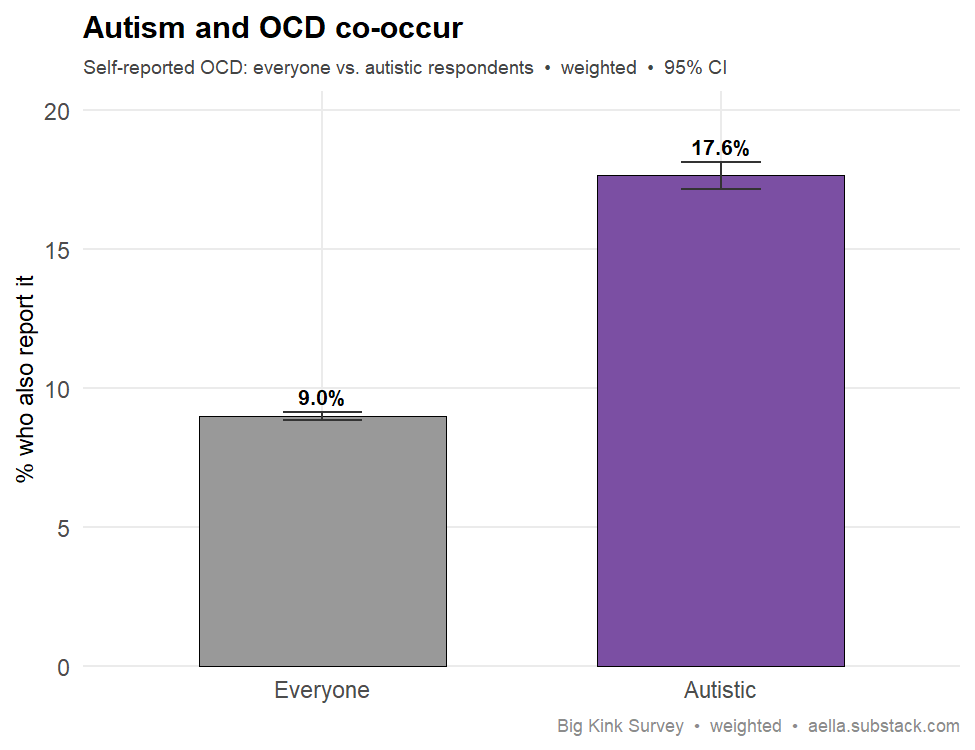
Your data: Replicates. Weighted, self-reported OCD jumps from a 9.0% base rate to 17.6% among autistic respondents (RR≈1.96), and the link is symmetric — autism runs 9.9% overall but 19.4% among those reporting OCD. It holds in both sexes (male RR=2.14, female RR=1.86). This tracks Aymerich et al. (2024), whose meta-analysis found 11.6% OCD among ASD. Both measures are self-report, which may inflate the size.
Survey question(s) asked
- “Do you have any of the following” — checkbox listing 19 conditions (ADHD, Anorexia, Anxiety, Autism, … Substance Abuse Disorder); tip: “Please only check if they're 'moderate to severe'”. This card uses the “Autism” and “OCD” boxes, checked vs not.
- Self-reported presence of a moderate-to-severe condition — not a question about clinical diagnosis.
Schizophrenia
112. Schizophrenia → broader sexual interests Weak / mixed
The claim: Schizophrenia/schizotypy is associated with more unusual or varied sexual interests.
Lit (split): Brown, Barker & Rahman (2023), Sexual Abuse (paraphilia largely unrelated to psychopathology) link vs Del Giudice (2017), World Psychiatry (positive schizotypy → more/varied sexuality) link
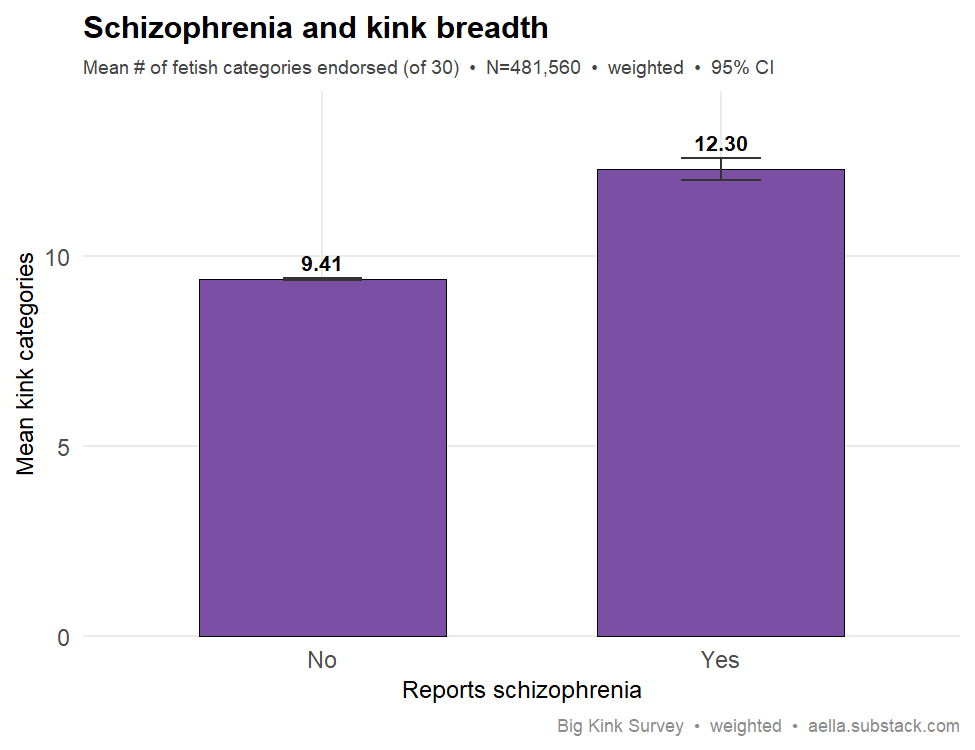
Your data: Respondents who report schizophrenia endorse a weighted mean of 12.3 fetish categories vs 9.4 for those who don't (about 31% broader raw). The gap holds in both sexes (men 12.2 vs 9.6; women 12.4 vs 9.3), isn't a weighting artifact (in the full unweighted 14–75 sample it's 13.7 vs 10.4, t=57, p<.001), and isn't an age artifact — the schizophrenia group is actually slightly younger (mean 20 vs 23), which if anything works against a wider repertoire. One control does bite: schizophrenia reporters tick far more of every listed condition, and controlling for the count of other reported conditions cuts the gap to about +1.2 categories (≈13% broader) — still positive at every condition-count level, but much of the raw 31% reflects a general propensity to self-report psychopathology. The external literature is genuinely split, which is why this stays "mixed" rather than a clean replication. One strand argues against any link: the largest non-clinical study of sexual interests (Brown, Barker & Rahman, 2023, N=4,280) found paraphilic interests "largely unrelated to psychopathology." But another strand supports the direction here: positive schizotypy is repeatedly tied to more, more varied, and less restricted sexual behaviour (e.g. Del Giudice's sexual-selection account in World Psychiatry). So this dataset lands on the supportive side of a literature that hasn't settled. Caveats: this is a single self-reported symptom, not a clinical diagnosis, and the result is cross-sectional and correlational — no causal claim.
Survey question(s) asked
- “Do you have any of the following” — checkbox listing 19 conditions; tip: “Please only check if they're 'moderate to severe'”. This card uses the “Schizophrenia” box, checked vs not.
- “Common things: Check all the following categories that contain a thing that arouses you.” — checkbox, 17 categories (Appearance states, Body parts, Bondage, Clothing, … Toys)
- “Uncommon things: Check all the following categories that contain a thing that arouses you.” — checkbox, 13 categories (Abnormal bodies, Age: nonstandard, Bestiality/creatures, … Vore)
- Kink breadth = the number of categories checked across both lists (0–30).
- The schizophrenia measure is self-reported presence of a moderate-to-severe condition — not a question about clinical diagnosis.
113. Schizophrenia by sex Diverges
The claim: Schizophrenia is somewhat more common in men (clinical incidence ~1.4:1 male) and tends to have earlier, more severe onset in men.
Best: McGrath et al. (2004), BMC Medicine (systematic review; male:female incidence 1.40). link
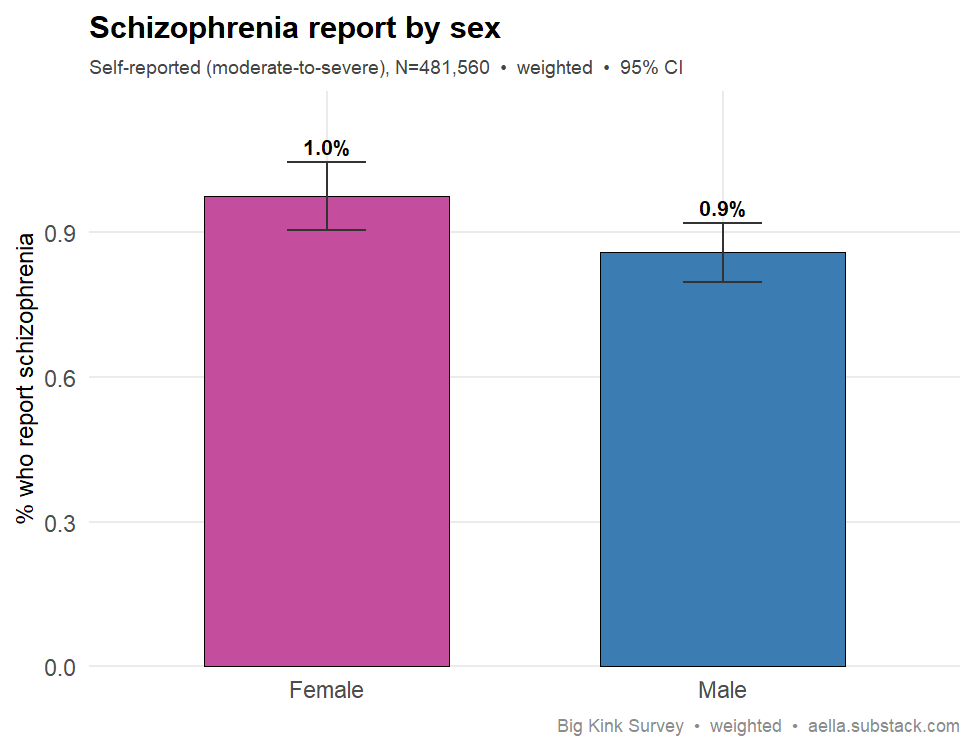
Your data: The clinical literature is solid (McGrath et al. find a male:female incidence ratio of 1.40, earlier/more-severe onset in men). But this self-report survey diverges: weighted prevalence is slightly higher in women (0.98% vs 0.86%, barely-overlapping CIs). The likely cause is the well-known self-report artifact (women report mental-health conditions more readily), which masks the true male excess. Self-report also can't test the onset/severity claim.
Survey question(s) asked
- “Do you have any of the following” — checkbox listing 19 conditions; tip: “Please only check if they're 'moderate to severe'”. This card uses the “Schizophrenia” box, checked vs not.
- “Which category fits you best?” — Man (cis) / Man (trans) / Woman (cis) / Woman (trans) / Nonbinary/other (assigned male at birth) / Nonbinary/other (assigned female at birth)
- Male/Female here is biological sex derived from the category item. The schizophrenia measure is self-reported presence, not clinical incidence — which is exactly why the card treats the divergence as a reporting artifact.
Paraphilias: prevalence & sex differences
114. Foot fetish: male-skewed (but not "most common") Half-replicates
The claim: Foot fetish is among the most common partialisms and is more common in men (Scorolli 2007).
Best: Scorolli et al. (2007), International Journal of Impotence Research 19(4):432–437 — finds feet (and foot-associated objects) are the single most common target of fetish preference. link Note: this paper documents prevalence, not the male skew; that men report foot interest more than women is reported elsewhere (illustrative).
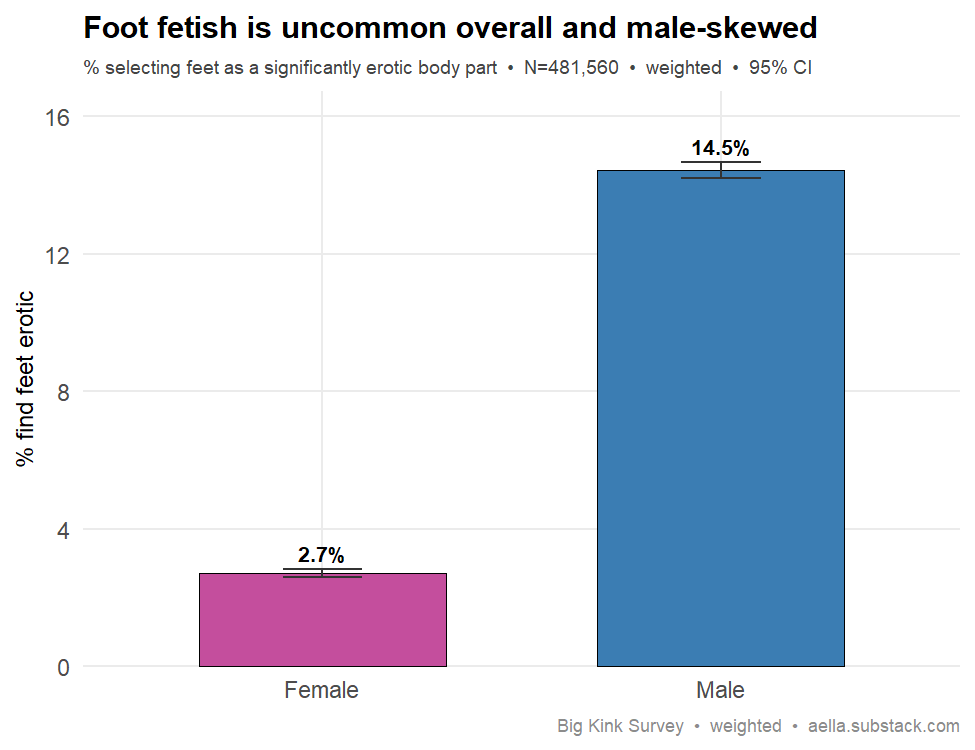
Your data: Half-replicates. The sex skew is robust: weighted, 14.5% of men vs 2.7% of women name feet as a significantly erotic body part (~5.3x). But "among the most common" does not hold here — at 8.7% overall, feet rank only 19th of ~28 body parts, far behind lips (33%), eyes (30%) and thighs (30%). Scorolli's 47% was relative share within fetishists — a different denominator.
Note: the BKS measure is self-reported arousal/interest, while the cited studies report behavioral prevalence — directionally informative, not a like-for-like replication.
Survey question(s) asked
- “Common things: Check all the following categories that contain a thing that arouses you.” — the “Body parts: normal, non-genital (elbows, knees, armpits, head hair, etc.)” box acts as the gate for the next question
- “Select all body parts you find significantly erotic” — checkbox, 29 body parts (Scalp, Hair, Eyes, Lips, … Feet, Toes). This card uses the “Feet” box.
- “Which category fits you best?” — Man (cis) / Man (trans) / Woman (cis) / Woman (trans) / Nonbinary/other (assigned male at birth) / Nonbinary/other (assigned female at birth)
- The body-parts checklist is only shown to respondents who checked the “Body parts” category above; respondents who didn't check it are counted as not selecting feet (0) by design. Male/Female is biological sex from the category item.
115. Pregnancy / breeding kink is higher in men Replicates
The claim: Pregnancy / breeding / impregnation kink is more common in men than in women.
Best: Direct peer-reviewed evidence for a male skew in breeding/impregnation kink specifically is thin; see e.g. Lehmiller (2018), Tell Me What You Want (Da Capo Press), a survey of 4,175 U.S. adults. Note that the "sex with a pregnant partner" fantasy is markedly more common in men (41% vs 9%), whereas the impregnation/"getting someone pregnant" fantasy is roughly equal by sex (31% men vs 28.5% women). link
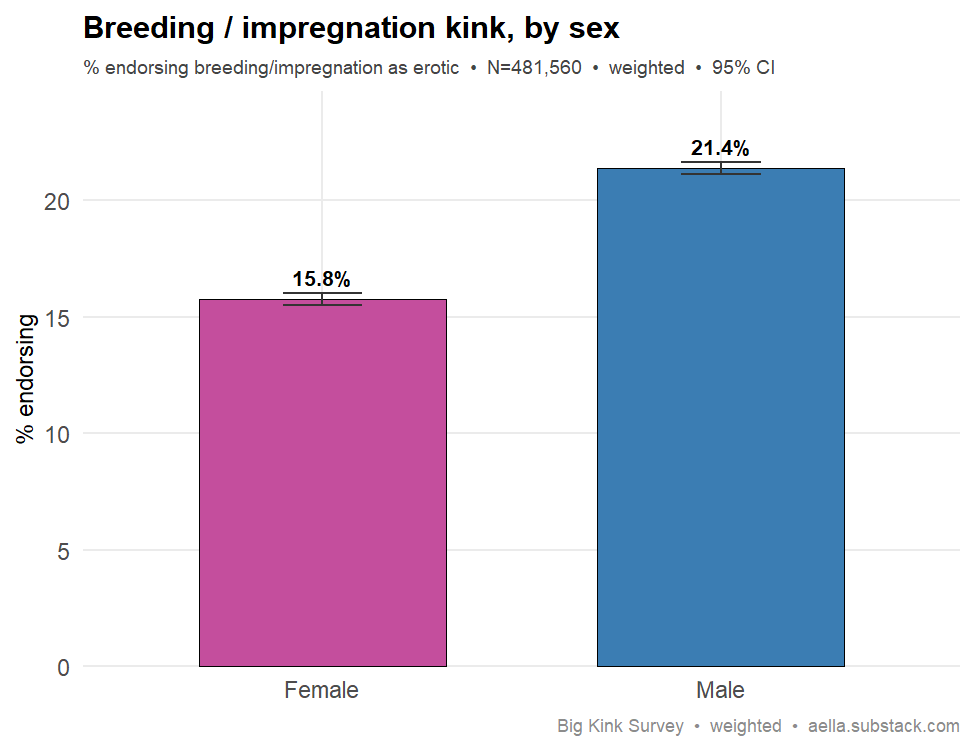
Your data: Replicates. 21.4% of men endorsed breeding/impregnation as erotic versus 15.8% of women — a 1.36x male skew with non-overlapping CIs, holding in raw data too. The plain "pregnancy" item skews even harder male (14.7% vs 9.6%). Joyal et al. (2015) show men report more atypical fantasies generally; note Lehmiller's survey found pregnancy fantasies more gender-balanced, so the specific item is somewhat contested.
Note: the BKS measure is self-reported arousal/interest, while the cited studies report behavioral prevalence — directionally informative, not a like-for-like replication.
Survey question(s) asked
- “Uncommon things: Check all the following categories that contain a thing that arouses you.” — the “Reproduction (pregnancy, surrogacy, oviposition, etc.)” box acts as the first gate
- “I find sexual scenarios involving reproduction to be:” — Not arousing / Slightly arousing / Somewhat arousing / Moderately arousing / Very arousing / Extremely arousing
- “Which of the following is erotic?” — checkbox: Anal pregnancy / Breeding/impregnation / Extreme pregnancy (huge/unusual fetuses) / Male pregnancy / Ovisposition (laying eggs into someone/birthing the eggs) / Pregnancy / Surrogacy. This card uses the “Breeding/impregnation” and “Pregnancy” boxes.
- “Which category fits you best?” — Man (cis) / Man (trans) / Woman (cis) / Woman (trans) / Nonbinary/other (assigned male at birth) / Nonbinary/other (assigned female at birth)
- The erotic-subtypes checkbox is only shown to respondents who checked the Reproduction category and rated it above “Not arousing”; everyone else is counted as not endorsing (0) by design. Male/Female is biological sex from the category item.
116. Voyeurism is more common in men Replicates
The claim: Voyeuristic interest is more common in men than in women.
Best: Långström & Seto (2006), Archives of Sexual Behavior 35(4):427-435. link
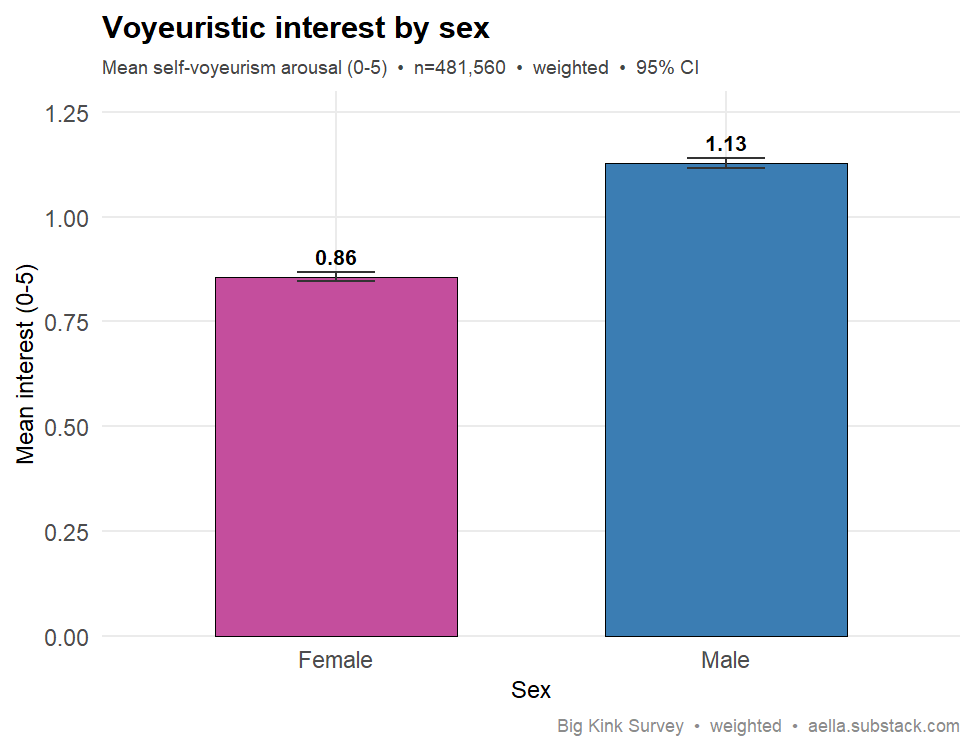
Your data: Replicates. On the item "I find being a voyeur to be" (0–5 arousal), men report higher interest than women, weighted: mean 1.13 vs 0.86 (non-overlapping CIs). This matches Långström & Seto (2006), whose Swedish national survey found 11.5% of men vs 3.9% of women reported voyeuristic arousal. (The BKS measure is self-rated interest, not behavior, but the male skew is the same direction.)
Note: the BKS measure is self-reported arousal/interest, while the cited studies report behavioral prevalence — directionally informative, not a like-for-like replication.
Survey question(s) asked
- “I find being a voyeur to be:” — Not arousing / Slightly arousing / Somewhat arousing / Moderately arousing / Very arousing / Extremely arousing (tip: “This means 'watching others sexually', typically publicly or without permission, such as peeping toms”)
- “Which category fits you best?” — Man (cis) / Man (trans) / Woman (cis) / Woman (trans) / Nonbinary/other (assigned male at birth) / Nonbinary/other (assigned female at birth)
- The voyeur item is only asked of respondents who checked “Exhibitionism/voyeurism (peeping tom, flashing, public sex, etc.)” in the kink category checklist; everyone else is counted as 0 (“no interest”) by design, so the mean blends category selection with rated intensity.
- The six options are stored as an ordinal 0–5 scale in the cleaned data (the raw survey codes them 0,1,2,3,5,8). Male/Female is biological sex from the category item.
117. Exhibitionism is more common in men Replicates
The claim: Exhibitionistic interest is more common in men than in women.
Best: Långström & Seto (2006), Archives of Sexual Behavior 35(4):427-435. link
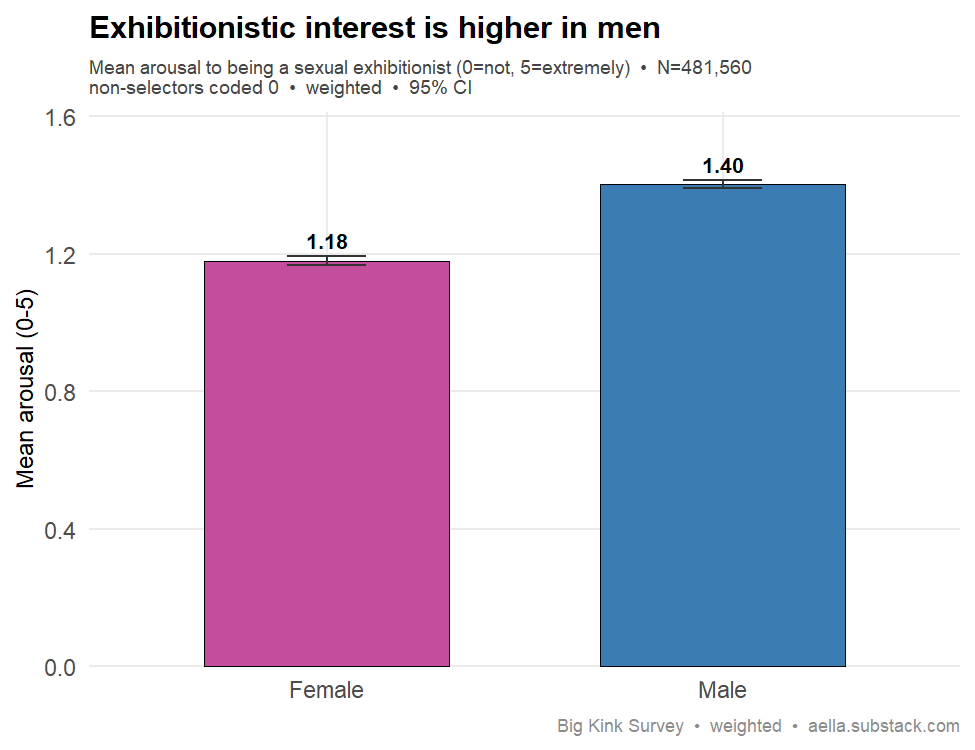
Your data: Replicates. Weighted mean arousal to being an exhibitionist is higher in men (1.40) than women (1.18), and men report any interest more often (43.8% vs 38.1%). This matches Långström & Seto (2006), who found exhibitionistic behavior in 4.1% of men vs 2.1% of women. Caveat: the gap is driven by men selecting the category more — among those who report any interest, intensity is nearly equal (3.2 vs 3.1).
Note: the BKS measure is self-reported arousal/interest, while the cited studies report behavioral prevalence — directionally informative, not a like-for-like replication.
Survey question(s) asked
- “I find being a sexual exhibitionist to be:” — Not arousing / Slightly arousing / Somewhat arousing / Moderately arousing / Very arousing / Extremely arousing (tip: “This means 'showing off sexuality', typically publicly, like streaking or public sex”)
- “Which category fits you best?” — Man (cis) / Man (trans) / Woman (cis) / Woman (trans) / Nonbinary/other (assigned male at birth) / Nonbinary/other (assigned female at birth)
- The exhibitionist item is only asked of respondents who checked “Exhibitionism/voyeurism (peeping tom, flashing, public sex, etc.)” in the kink category checklist; everyone else is counted as 0 (“no interest”) by design, so the mean blends category selection with rated intensity.
- The six options are stored as an ordinal 0–5 scale in the cleaned data (the raw survey codes them 0,1,2,3,5,8). Male/Female is biological sex from the category item.
118. Paraphilic interest overall, by sex Direction only
The claim: Paraphilic/atypical sexual interests are more common in men than women.
Best: Dawson, Bannerman & Lalumière (2016), Sexual Abuse 28(1):20-45. link
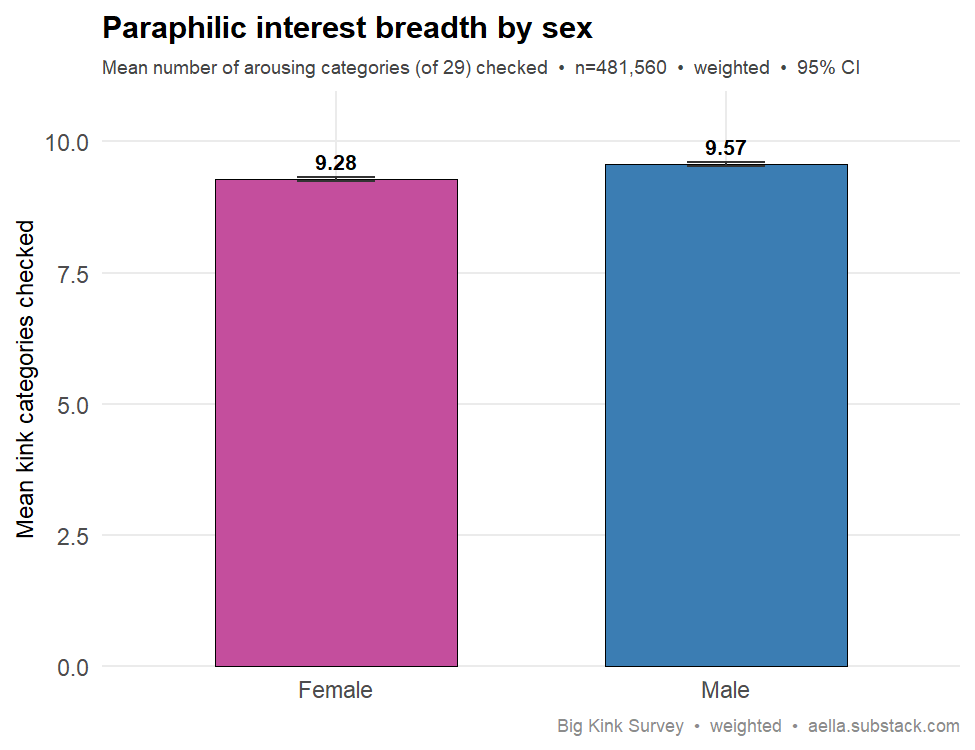
Your data: Men do report broader paraphilic interest, but only barely: weighted mean breadth is 9.57 categories for men vs 9.28 for women (of 29) — a gap of just ~0.3 categories (~3%). The raw gap is identical, so weighting isn't masking it. The direction matches the literature, but the magnitude is far smaller than the substantial male skew in representative samples — likely because BKS women are a self-selected, unusually kink-heavy group.
Survey question(s) asked
- “Common things: Check all the following categories that contain a thing that arouses you.” — checkbox, 17 categories (Appearance states; Body parts; Bondage; Clothing; Eagerness; Exhibitionism/voyeurism; Gentleness; Humiliation; Incest; Multiple partners; Mythical/fictional creatures; Nonconsent; Power dynamics & D/s; Roles; Sadomasochism; Sensory; Toys)
- “Uncommon things: Check all the following categories that contain a thing that arouses you.” — checkbox, 13 categories (Abnormal bodies and body parts; Age: nonstandard; Bestiality/creatures; Bodily secretions; Brutal/violent; Creepy/horror; Dirtiness/disgust/messiness; Genderplay; Mental Alteration; Objects: nonstandard; Reproduction; Transformations; Vore)
- “Which category fits you best?” — Man (cis) / Man (trans) / Woman (cis) / Woman (trans) / Nonbinary/other (assigned male at birth) / Nonbinary/other (assigned female at birth)
- Paraphilic breadth = the number of categories checked across the two lists (0–30). “Men” and “women” here are birth sex, derived from the category item.
Pornography use
119. ADHD → more pornography use Replicates
The claim: Self-reported ADHD is associated with somewhat more frequent pornography use, consistent with the ADHD–hypersexuality literature.
Best: Bőthe et al. (2019), The Journal of Sexual Medicine 16(4):489–499. link
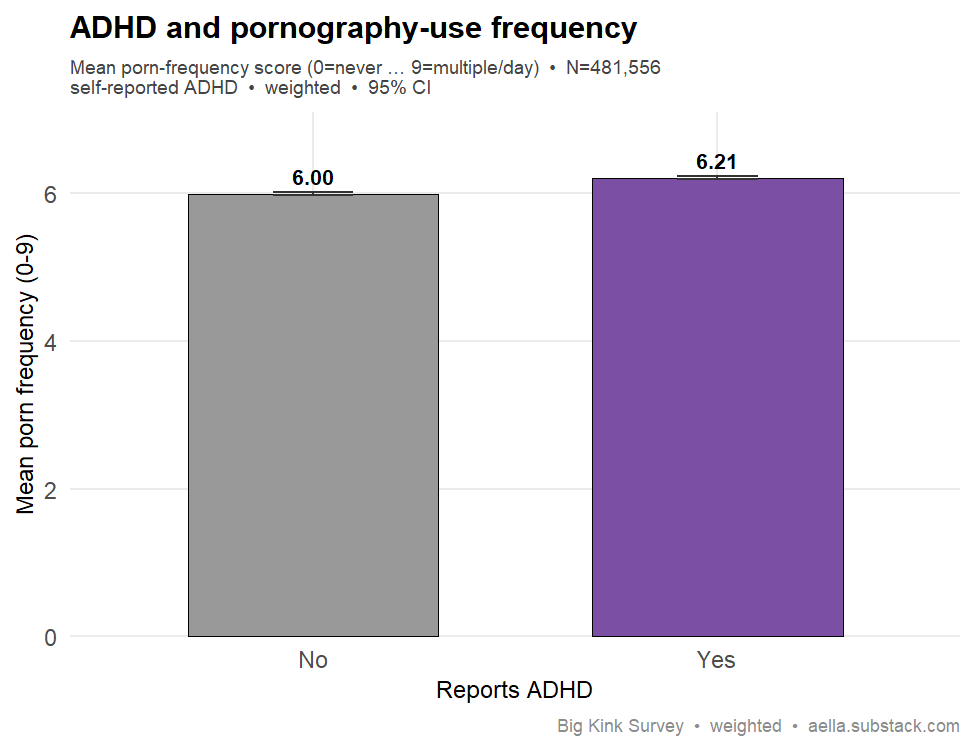
Your data: Replicates. Respondents who report ADHD use pornography modestly more often: weighted mean 6.21 vs 6.00 on the 0–9 frequency scale (non-overlapping CIs). The gap is not a sex artifact — it holds for women (5.61 vs 5.30) and men (6.79 vs 6.67), and is larger in women. ADHD is self-reported (not diagnosed) and porn frequency overlaps with impulsivity/hypersexuality. Bőthe et al. (2019) report the same link.
Survey question(s) asked
- “Do you have any of the following” — checkbox, 19 conditions (tip: “Please only check if they're 'moderate to severe'”) — ‘ADHD’ checked vs not
- “How often do you watch or read pornographic/erotic content?” (tip: “for the purposes of getting aroused”) — 10 options coded 0–9: I don't = 0, Less than once a year = 1 … Daily = 8, Multiple times a day = 9
- ADHD here is a box the respondent checked on this list — self-report, not a recorded diagnosis.
120. Earlier porn exposure → heavier porn use Replicates
The claim: Earlier first exposure to pornography is associated with heavier adult pornography use.
Best: Marshall & Miller (2024), “Age and Type of First Exposure to Pornography: It Matters for Girls and Boys,” Deviant Behavior 45(3), 377–393. link
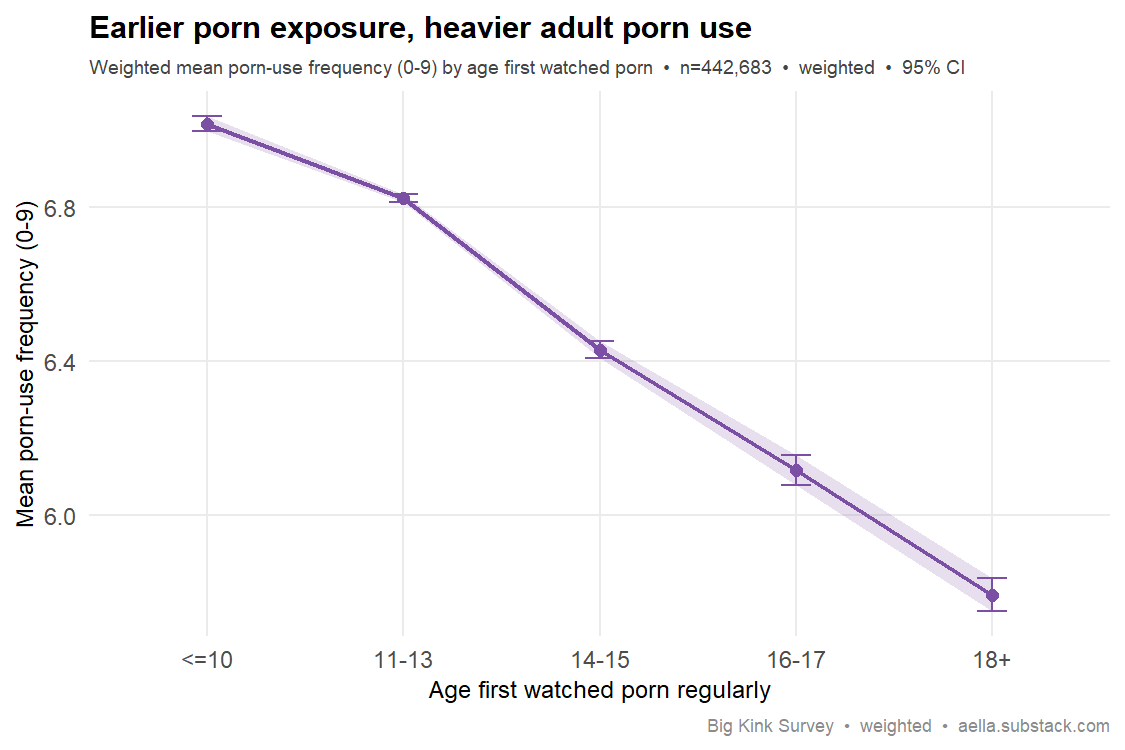
Your data: Replicates cleanly. Weighted mean porn-use frequency (0–9) falls monotonically with later first exposure: 7.02 (started ≤10) → 6.43 (14–15) → 5.79 (18+); weighted r = −0.20. There's a genuine cohort confound (earlier starters are younger now), but the gradient survives age-restriction (ages 25–40: 7.15→5.81) and holds in both sexes, so it is not an age artifact.
Survey question(s) asked
- “At what age did you begin watching porn or reading erotic content at least semiregularly?” — >6yo / 7-8yo / 9-10yo / 11-12yo / 13-14yo / 15-16yo / 17-18yo / 19-25yo / 26yo+
- “How often do you watch or read pornographic/erotic content?” (tip: “for the purposes of getting aroused”) — 10 options coded 0–9: I don't = 0, Less than once a year = 1 … Multiple times a day = 9
- The start-age question was only asked of respondents who use porn at all — anyone answering “I don't” to the frequency question skipped it, so never-users are not on the x-axis.
121. Agreeableness → less pornography Weak / sex-dependent
The claim: More agreeable people report somewhat less pornography use.
Best: Egan & Parmar (2013), Journal of Sex & Marital Therapy 39(5):394-409. link
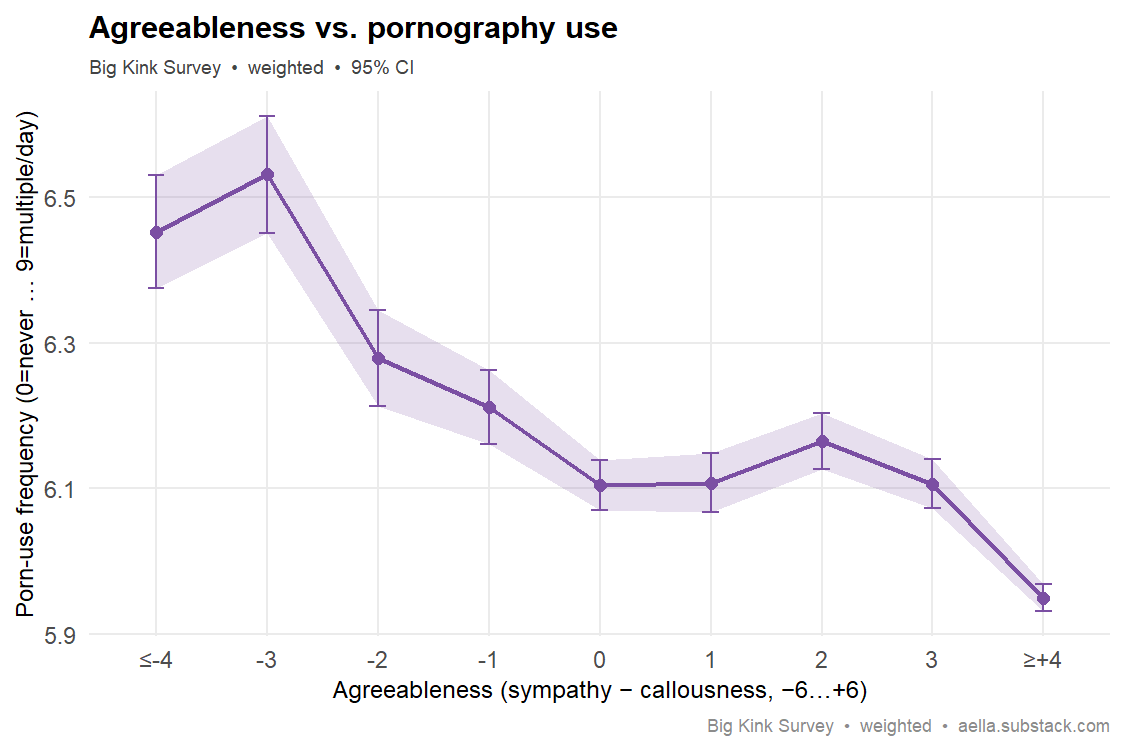
Your data: Directionally supported but weak and sex-dependent. Weighted, agreeableness correlates with porn-use frequency at r=−0.05; binned means fall only from ~6.5 to ~6.0 on the 0–9 scale. The sex-split kills it: women r=−0.04, men r=−0.004 (null), and men use far more porn overall, so the pooled gradient is partly sex composition. The literature is itself contested.
Survey question(s) asked
- “I sympathize with others' feelings” — 7-point agreement: +3 Totally agree … −3 Totally disagree
- “I feel little concern for others” — same 7-point agreement scale
- “How often do you watch or read pornographic/erotic content?” (tip: “for the purposes of getting aroused”) — 10 options coded 0–9: I don't = 0 … Multiple times a day = 9
- Agreeableness = the sympathy item minus the little-concern item (range −6 to +6) — a two-item mini-scale, not a full Big Five inventory.
122. Neuroticism → more pornography Sex-dependent
The claim: Neuroticism predicts more (escapist) pornography use, though the literature is mixed.
Best: Borgogna & Aita (2019), Sexual Addiction & Compulsivity 26(3-4):293–314. link
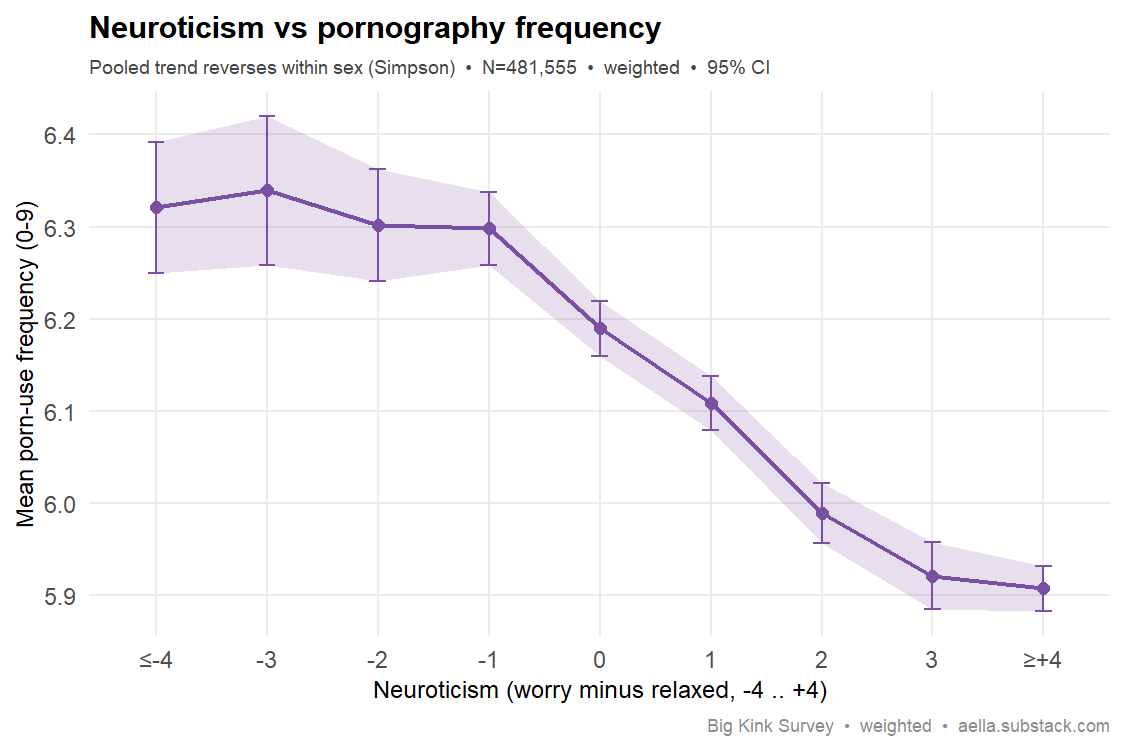
Your data: Contested, and in this sample the pooled direction actually reverses. Pooled weighted r = −0.058 — porn-use frequency falls as neuroticism rises. But that is a Simpson's paradox: within each sex the relationship is positive, as the literature predicts (men r=+0.045; women r=+0.028). Men are both more porn-heavy and shift the pooled slope. Weak and confound-driven, not a clean replication.
Survey question(s) asked
- “I worry about things.” — 7-point agreement: +3 Totally agree … −3 Totally disagree
- “I am relaxed most of the time” — same 7-point agreement scale
- “How often do you watch or read pornographic/erotic content?” (tip: “for the purposes of getting aroused”) — 10 options coded 0–9: I don't = 0 … Multiple times a day = 9
- Neuroticism = the worry item minus the relaxed item (range −6 to +6) — a two-item mini-scale, not a full Big Five inventory.
Reproduction, handedness, drugs & attraction
123. Baby fever and age Reversed full sample
The claim: Desire to have a baby ("baby fever") increases with age in women.
Best: on the structure and correlates of "baby fever," see e.g. Brase & Brase (2012), "Emotional regulation of fertility decision making," Emotion, 12, 1141–1154. (Note: this literature finds women's baby fever tends to decrease with age while men's increases — the direction here should be reviewed.)
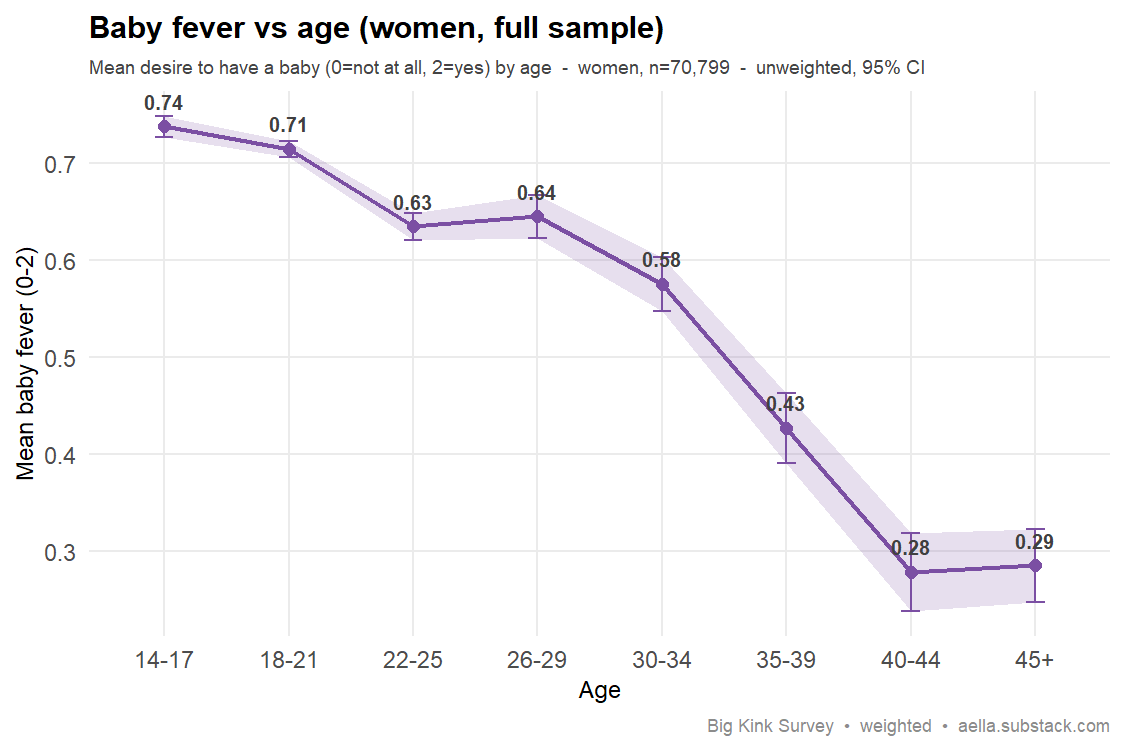
Your data: Checked on the full unweighted sample (women, ages 14–75) — since the literature spans the whole reproductive lifespan, not just the under-34s the weighted set covers — and the reversal only gets stronger. Mean baby fever (0–2) falls monotonically with age: 0.74 at 14–17 → 0.64 at 22–25 → 0.58 at 30–34, then keeps dropping to 0.43 (35–39), 0.28 (40–44) and 0.29 (45+); the share saying "yeah I want baby" slides 17.8%→6.3% (n=70,799). There's no late-30s fertility-deadline bump — desire-for-a-baby just keeps declining across the full range. So this is a genuine reversal, not an artifact of a truncated age window. (Cross-sectional and a self-selected sample, so this is age-pattern, not within-person change.)
Survey question(s) asked
- “Do you have baby fever?” (tip: “Do you really wanna have a baby (or another baby, if you already have kids)”) — Not at all = 0 / A little maybe? = 1 / Yeah I want baby = 2
- “How old are you?” — years (numeric entry)
- The baby-fever question is only asked of respondents whose birth sex is female; “women” on this chart means birth-sex female (the audit found the same declining pattern restricting to cis women only).
124. Non-right-handedness & sexual orientation Replicates
The claim: Non-right-handedness (left-handed or ambidextrous) is elevated among non-heterosexual people (Lalumière, Blanchard & Zucker 2000).
Best: Lalumière, Blanchard & Zucker (2000), Psychological Bulletin 126(4):575-592. link
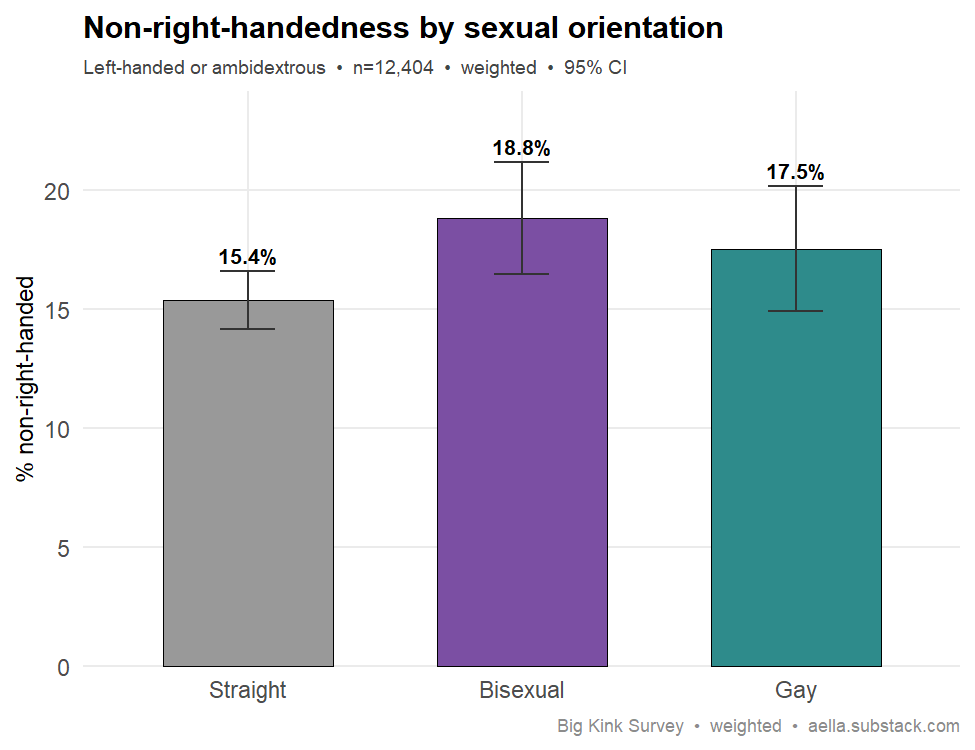
Your data: Replicates. Weighted, non-right-handedness is 15.4% in straight respondents vs 18.3% in non-straight (bisexual 18.8%, gay 17.5%); n=12,404. A weighted logistic gives OR=1.23, rising to 1.29 after adjusting for sex and age, so it is not a confound artifact, and it holds in both sexes (strongest in bisexual men). This matches Lalumière 2000's pooled OR ≈ 1.34. N is modest (handedness was a late survey addition), so treat the magnitude as approximate.
Survey question(s) asked
- “You are:” — Right handed / Left handed / Ambidextrous
- “You're sexually attracted to people with___” — Penises, exclusively / Penises, mostly / Penises, slightly / Both equally / Vaginas, slightly / Vaginas, mostly / Vaginas, exclusively
- “You're more sexually attracted to people who appear visually” — +3 Totally masculine … 0 Equally masculine and feminine … −3 Totally feminine
- Non-right-handed = Left handed or Ambidextrous. Straight/Bisexual/Gay here are derived from the two attraction items relative to birth sex — not a self-identification question. The handedness item was added to the survey on 5/8/26, which is why the n is smaller than other cards.
125. Chemsex interest → more partners Construct mismatch full sample
The claim: People who eroticize recreational drugs in sex (chemsex interest) report markedly more lifetime sexual partners.
Best: see e.g. Pufall et al. (2018), HIV Medicine 19(4):261–270 — among HIV-positive men who have sex with men, sexualised drug use (‘chemsex’) was associated with higher-risk sexual behaviour. Illustrative only: this clinic-based sample does not establish a general-population link to lifetime partner counts.
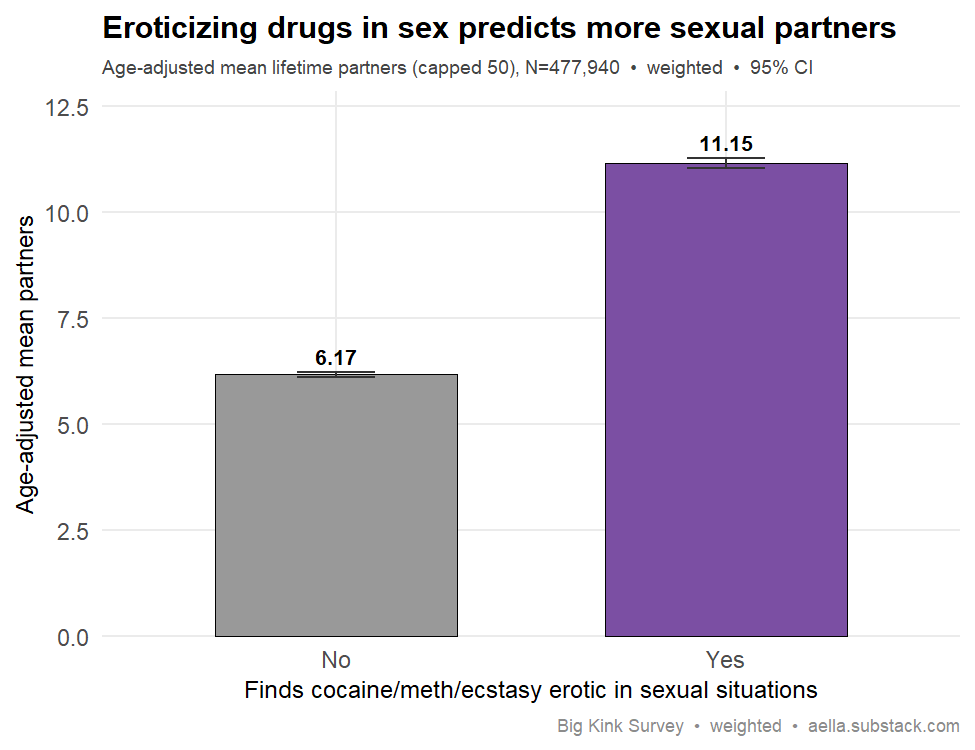
Your data: The association is strong; the construct is not the cited one. Construct: BKS measures finding drugs erotic (a fantasy/fetish item), not chemsex behaviour (using drugs during sex), so it is a loose proxy for the cited finding. Magnitude: on the report-standard capped measure (partners capped at 50), drug-eroticizers report about twice as many partners: weighted means 12.4 vs 6.1, still +5.0 after age-adjustment (11.2 vs 6.2), and roughly 2x within each sex (women 12.3 vs 6.3, men 12.4 vs 5.9). Self-report, cross-sectional.
Survey question(s) asked
- “Which of the following drugs are erotic in sexual situations?” — checkbox: Aphrodesiacs (arousal drugs) / Psychedelics / Roofies / Poppers / Meth / Ecstasy / Cocaine / Heroin — “chemsex interest” here = checked Meth, Ecstasy, or Cocaine
- “How many people have you had sex with?” (tip: “By your definition of 'sex' - this typically means penetration, and sometimes includes oral sex.”) — free-text number
- The drug list is only shown to respondents who first checked “Mental Alteration” on the uncommon-arousal checklist and then picked “Drugs” as an erotic type of mental alteration; respondents who never reached it are counted as “no interest”. Partner counts are capped at 50 in this analysis.
126. Gay men & attraction to masculinity Replicates full sample
The claim: Gay and bisexual men report strong attraction to masculinity.
Best: Zhang, Zheng & Zheng (2018), “Consistency in preferences for masculinity… among homosexual men in China,” Personality and Individual Differences 134:137–142. link
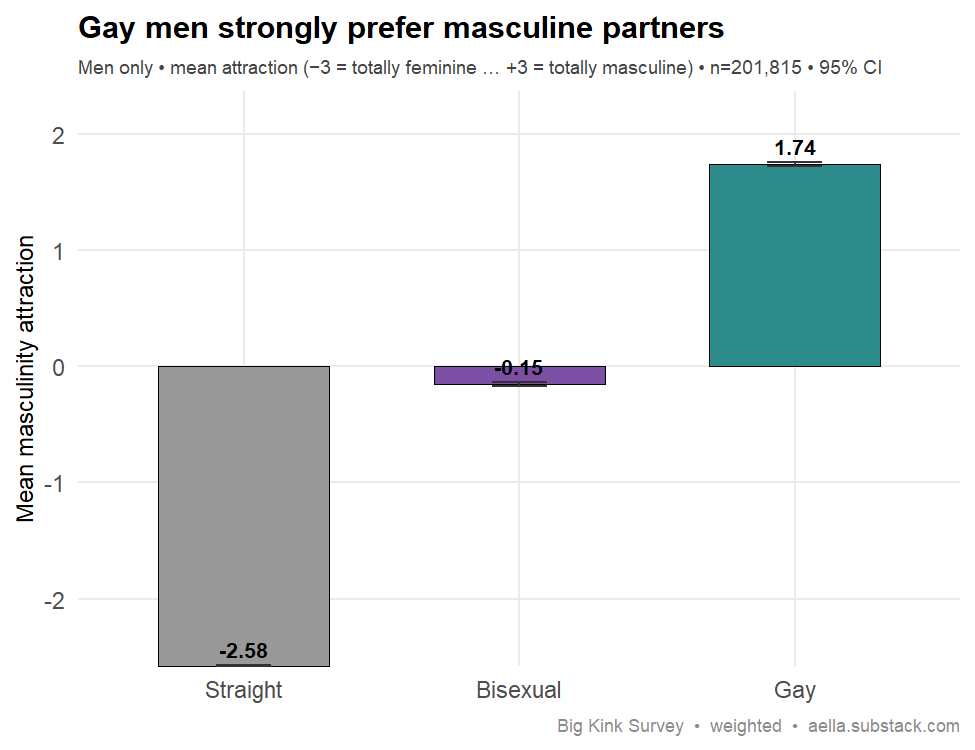
Your data: The cited study is specifically about gay (homosexual) men, and finds they prefer masculinity. Our data confirm this firmly. Among men (weighted), gay men average +1.74 on the masculinity-attraction scale (−3 = totally feminine-attracted … +3 = totally masculine-attracted), strongly masculine-leaning, with a CI that does not overlap straight men at −2.58 (strongly feminine-attracted). The gay-men result is essentially identical on the full unweighted sample (ages 14–75): +1.75, so it is not an artifact of the truncated weighted age band. The cited finding therefore replicates cleanly. One honest extension: bisexual men sit near the midpoint at −0.15 (essentially balanced, not strongly masculine-attracted) — but bisexual men were not the population the cited study claimed about, so this is a caveat on a broader reading rather than a failure of the original finding.
Survey question(s) asked
- “You're sexually attracted to people with___” — Penises, exclusively / Penises, mostly / Penises, slightly / Both equally / Vaginas, slightly / Vaginas, mostly / Vaginas, exclusively
- “You're more sexually attracted to people who appear visually” — +3 Totally masculine / +2 Somewhat masculine / +1 Slightly masculine / 0 Equally masculine and feminine / −1 Slightly feminine / −2 Somewhat feminine / −3 Totally feminine
- “Which category fits you best?” — Man (cis) / Man (trans) / … — “men” = birth-sex male
- Straight/Bisexual/Gay here are derived from these two attraction items relative to birth sex — not a self-identification question. Note the masculinity item is both part of that derivation and the outcome scale on this chart, so some agreement is built in.
127. Younger → more kink? Inverted-U full sample
The claim: Younger cohorts report broader kink interests than older ones. (Exploratory; age/cohort confounded.)
Best: Holvoet et al. (2017), “Fifty Shades of Belgian Gray,” The Journal of Sexual Medicine 14(9):1152-1159 (representative general-population sample, N=1,027; interest scored across 54 BDSM activities + 14 fetishes — the older 48–65 group had significantly lower BDSM scores than younger peers). link Backup: Joyal & Carpentier (2017), The Journal of Sex Research 54(2):161-171 — documents that paraphilic interests are common in the general population (prevalence, not an age gradient). link
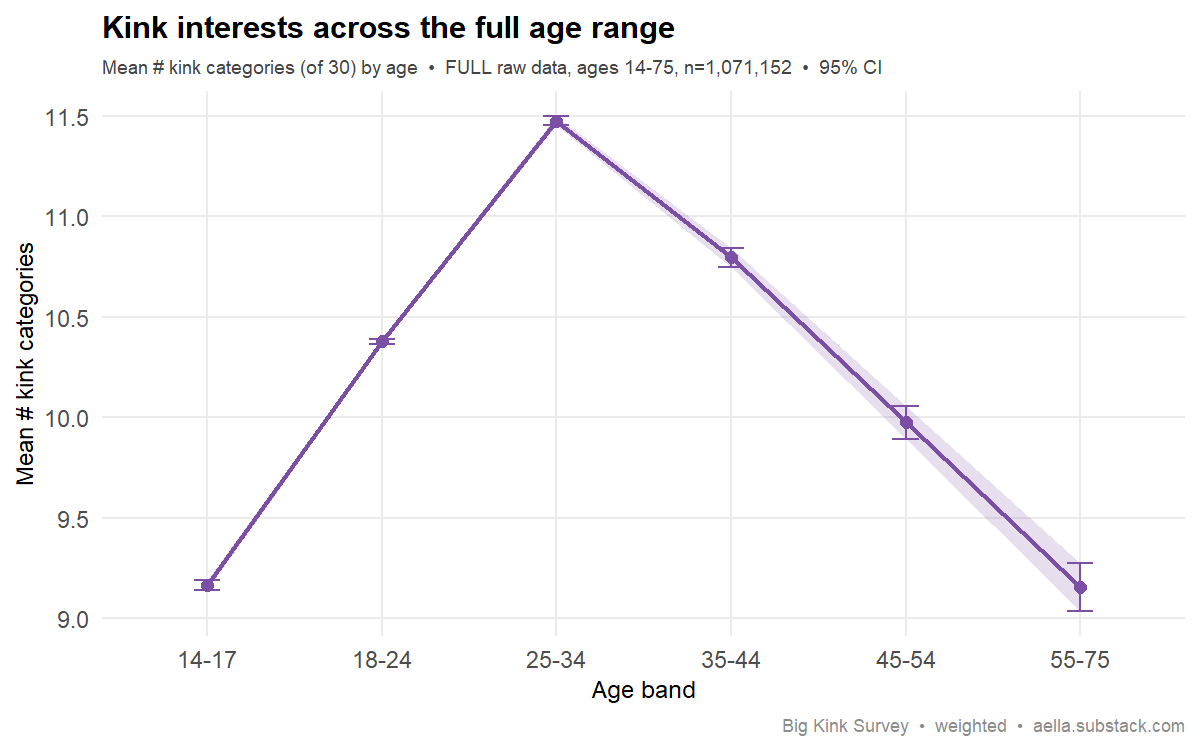
Your data: Re-run on the full age range (14–75, raw — not the 14–34 cap), it's an inverted-U, not a clean reversal: kink breadth rises from 9.2 (14–17) to a peak of 11.5 at 25–34, then falls steadily to 9.2 by 55–75. So among adults, younger does mean more kink — the predicted direction, with a clear decline from the late-20s peak onward — but the youngest teens are also lower (still developing their interests). J&C sampled adults ~18–64 and don't cleanly fix an age direction; age and cohort are inseparable here, so treat as exploratory.
Survey question(s) asked
- “How old are you?” — years (numeric entry)
- “Common things: Check all the following categories that contain a thing that arouses you.” — checkbox, 17 categories (Appearance states … Toys)
- “Uncommon things: Check all the following categories that contain a thing that arouses you.” — checkbox, 13 categories (Abnormal bodies and body parts … Vore)
- Kink breadth = the number of categories checked across the two lists (0–30).
Gender-affirming hormones (HRT)
128. Time on HRT vs mental health: opposite gradients by sex Splits by sex full sample
The claim: Longer time on gender-affirming hormones is associated with better mental health in trans people.
Best: see e.g. Aldridge et al. (2021), Andrology 9(6):1808–1816 — an 18-month prospective cohort (n=178) in which gender-affirming hormone treatment was associated with reduced depression. link
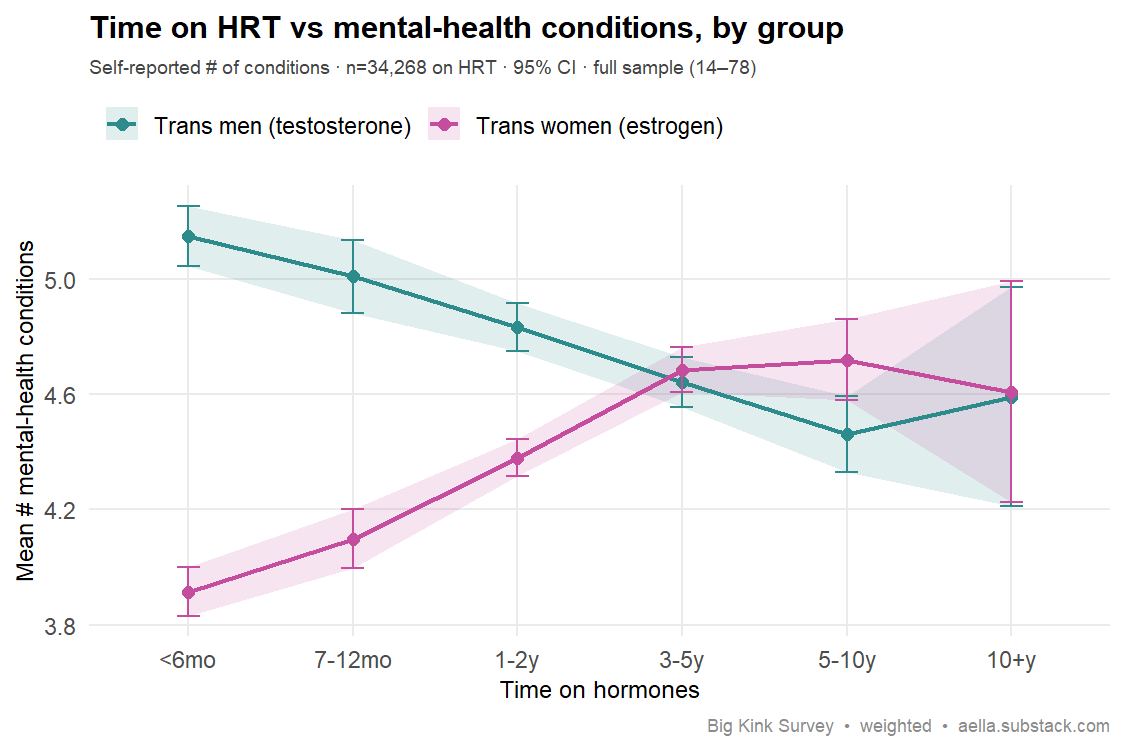
Your data: Among 34,268 trans people on HRT (full sample, ages 14–78), pooling shows almost no link between time on hormones and the number of self-reported mental-health conditions (r=0.02, flat ~4.5–4.7) — but that flat line hides a sex split running in opposite directions. Trans men on testosterone (n=14,642) show the predicted gradient: conditions fall steadily from 5.15 at <6 months to ~4.46 at 5–10 years (slope −0.14 per duration step, p<1e-21; still negative after age-adjustment). Trans women on estrogen (n=19,626) go the other way: conditions rise from 3.91 at <6 months to ~4.72 at 5–10 years (slope +0.18, p<1e-45; stronger after age-adjustment). Caveats: this is cross-sectional and can't see the pre-HRT baseline, and the outcome is a count of conditions, not the depression/anxiety symptom scales Aldridge (2021) tracked across the first ~18 months. Longer-duration respondents are also older and transitioned in earlier eras, so the trans-women trend may reflect cohort/selection rather than an effect of estrogen. So our data neither confirms nor contradicts the "improvement on starting HRT" literature — it shows that, once on HRT, duration tracks self-reported mental health in opposite directions for the two groups.
Survey question(s) asked
- “Are you currently on testosterone for HRT?” — No / Yes, for less than 1 month / Yes, for 1-3 months / Yes, for 3-6 months / Yes, for 7-12 months / Yes, for 1-2 years / Yes, for 3-5 years / Yes, for 5-10 years / Yes, for 10+ years
- “Are you currently on estrogen for HRT?” — same nine options
- “Do you have any of the following” — checkbox, 19 mental-health conditions (tip: “Please only check if they're 'moderate to severe'”)
- The outcome is the number of conditions checked (0–19) — self-report, not diagnoses. The testosterone question is asked in the “Man (trans)” branch and the estrogen question in the “Woman (trans)” branch of “Which category fits you best?”; nonbinary respondents have also been asked the hormone questions since 8/25/25.
129. Testosterone → higher libido Replicates
The claim: Testosterone (in trans men) increases libido / sex drive.
Best: Defreyne et al. (2020), J. Sexual Medicine (longitudinal ENIGI study). link
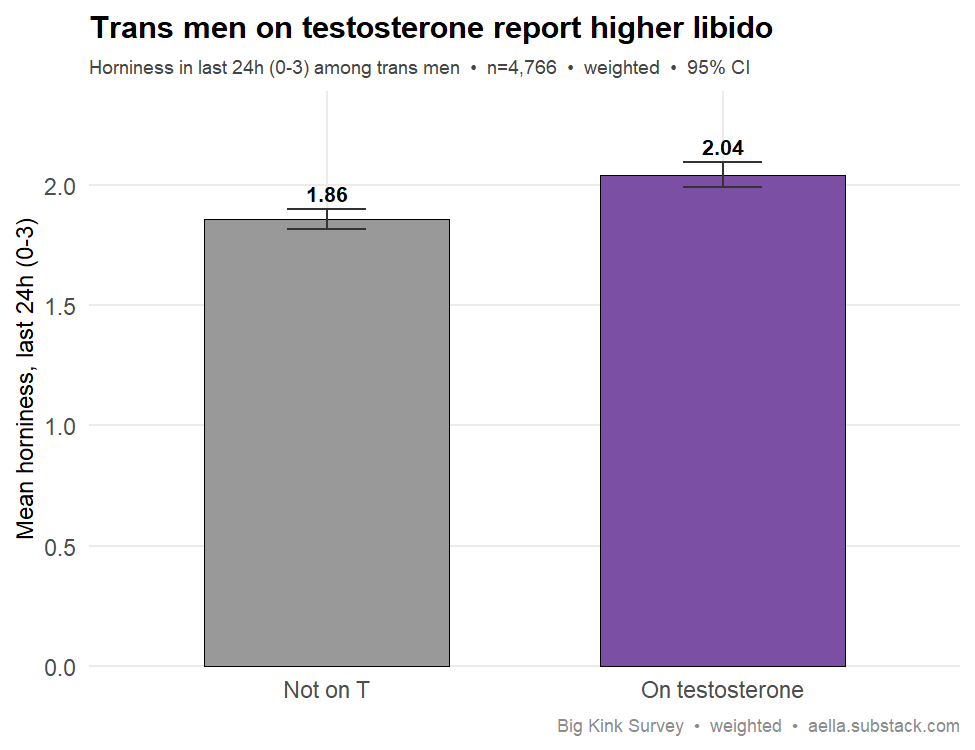
Your data: Replicates. Among trans men (n=4,766, weighted means), those on testosterone report higher libido: last-24h horniness 2.04 vs 1.86 (0–3 scale) and current 1.29 vs 1.12. On-T respondents are older (22.8 vs 17.5), but the on/off gap survives age-adjustment (+0.19 on the 24-h measure, p<1e-7). By time on T, libido peaks in the first months and then eases back toward (while staying above) off-T levels — the early-peak trajectory ENIGI itself reports. Observational, so causality is suggestive.
Survey question(s) asked
- “Are you currently on testosterone for HRT?” — No / Yes, for less than 1 month / Yes, for 1-3 months / Yes, for 3-6 months / Yes, for 7-12 months / Yes, for 1-2 years / Yes, for 3-5 years / Yes, for 5-10 years / Yes, for 10+ years
- “How horny have you been in the last 24 hours?” — Not horny at all = 0 / A little horny = 1 / Moderately horny = 2 / Real horny = 3
- “How horny are you right now?” — same 0–3 scale
- The testosterone question is asked of respondents who chose “Man (trans)” on “Which category fits you best?”; “on testosterone” = any “Yes…” duration vs “No”.
130. Estrogen → lower libido Direction only
The claim: Estrogen (in trans women) lowers libido / sex drive.
Best: Illustrative: Defreyne et al. (2020), J. Sexual Medicine 17(4):812 (ENIGI) found a short-term (~3-month) dip in sexual desire after starting feminizing hormones; over 36 months dyadic desire rose above baseline, so this supports only a transient early decrease, not a sustained drop in libido. link
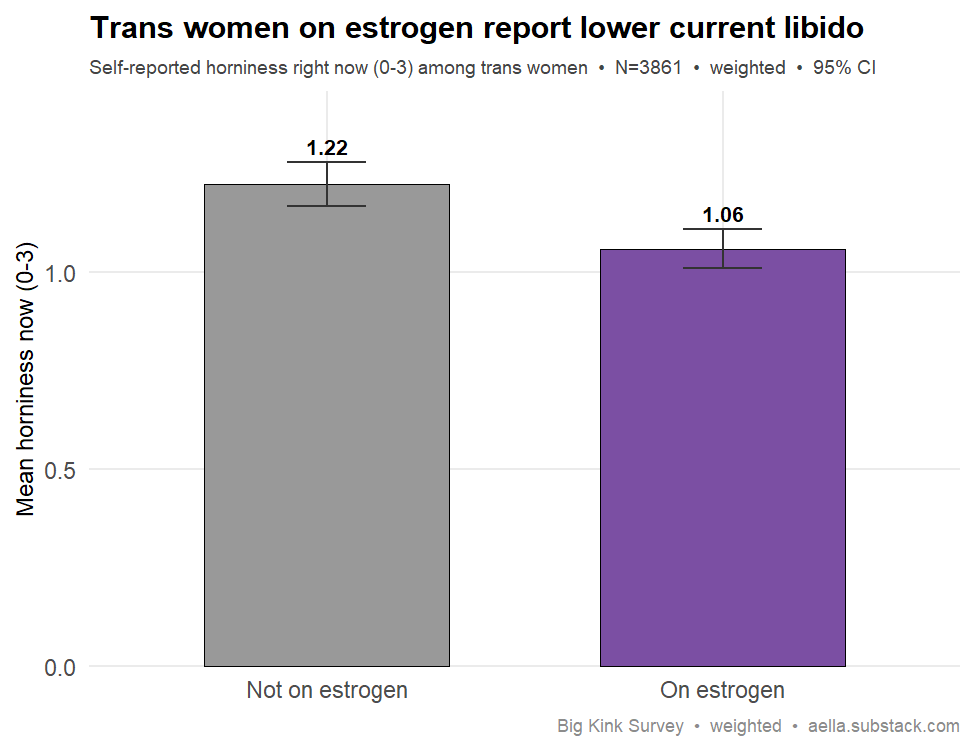
Your data: Direction only. Among trans women (n=3,861 with libido data, weighted means), those on estrogen report lower libido on both measures: current horniness 1.06 vs 1.22, last-24h 1.85 vs 2.05 (0–3). On-E women are older (24.2 vs 19.1), but age-adjustment strengthens the drop (coef −0.19/−0.20, p<1e-6). The trajectory diverges from the cited study, though: ENIGI supports only a transient ~3-month dip, with desire back above baseline by 36 months, while here the deficit persists at every duration with no sign of recovery (on-E duration slope −0.02/step, n.s.). Cross-sectional, so causal attribution to estrogen specifically isn't established.
Survey question(s) asked
- “Are you currently on estrogen for HRT?” — No / Yes, for less than 1 month / Yes, for 1-3 months / Yes, for 3-6 months / Yes, for 7-12 months / Yes, for 1-2 years / Yes, for 3-5 years / Yes, for 5-10 years / Yes, for 10+ years
- “How horny are you right now?” — Not horny at all = 0 / A little horny = 1 / Moderately horny = 2 / Real horny = 3
- “How horny have you been in the last 24 hours?” — same 0–3 scale
- The estrogen question is asked of respondents who chose “Woman (trans)” on “Which category fits you best?”; “on estrogen” = any “Yes…” duration vs “No”.
131. Most trans people are on HRT Majority only among adults
The claim: A majority of binary trans people are on (or pursue) gender-affirming hormones.
Best: Castelijn et al. (2025), Endocrine (meta-analysis; ≈80% of binary trans on GAHT). link
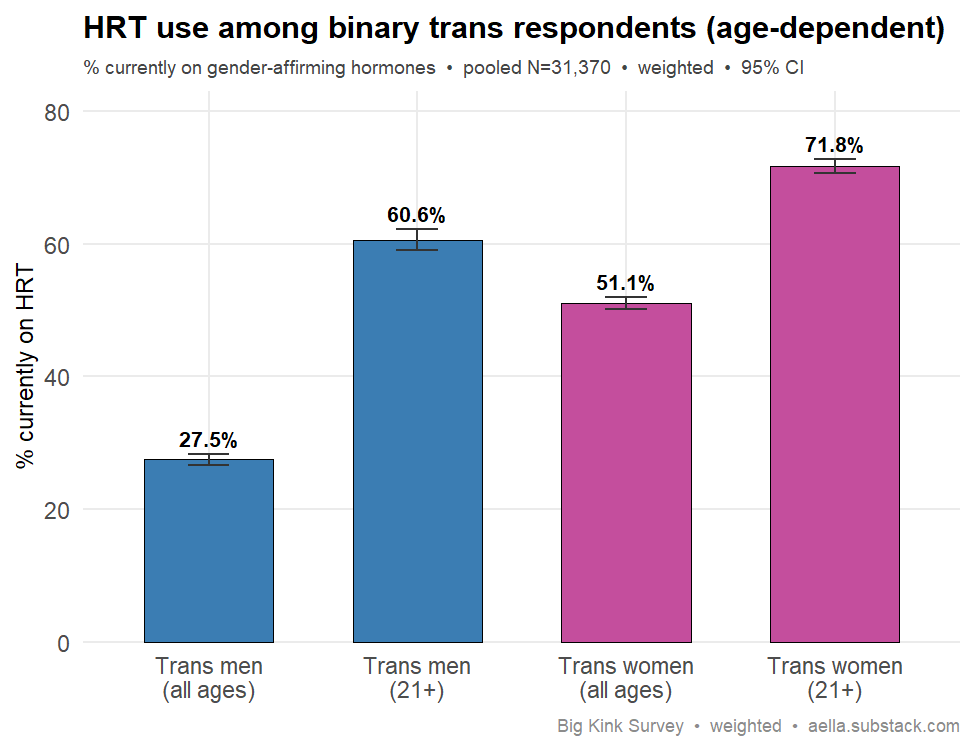
Your data: Age-dependent. Pooled across all ages, only 38% of binary trans respondents are currently on hormones (population-weighted; 40% in the full unweighted sample, which the chart shows) — a minority, because this kink survey skews extremely young (median age trans men 18) and most under-21s are pre-HRT. Among adults it climbs: 50–57% at 18+ depending on weighting basis, and a clear majority at 21+ (65–67% on either basis), converging toward the literature (≈73–80%). Strongly sex-dependent too (trans women 51% vs trans men 27% all-ages, weighted). True for trans adults; an age-composition artifact in the raw pool.
Survey question(s) asked
- “Which category fits you best?” — Man (cis) / Man (trans) / Woman (cis) / Woman (trans) / Nonbinary/other (assigned male at birth) / Nonbinary/other (assigned female at birth)
- “Are you currently on testosterone for HRT?” — No / Yes, for less than 1 month / Yes, for 1-3 months / Yes, for 3-6 months / Yes, for 7-12 months / Yes, for 1-2 years / Yes, for 3-5 years / Yes, for 5-10 years / Yes, for 10+ years
- “Are you currently on estrogen for HRT?” — same nine options
- The testosterone item was asked only of respondents who chose Man (trans); the estrogen item only of those who chose Woman (trans). “On hormones” = any “Yes” duration vs “No”.
Neurodivergence & kink
132. Furries → more autism Replicates
The claim: Furries report higher rates of autism than non-furries.
Best: Reysen, Plante, Chadborn et al. (2018), “A brief report on the prevalence of self-reported mood disorders... and autism spectrum disorder in anime, brony, and furry fandoms,” The Phoenix Papers, 3(2), 64–75 (FurScience fandom survey; furries report elevated ASD rates, ~10–15%, vs. the general population). link
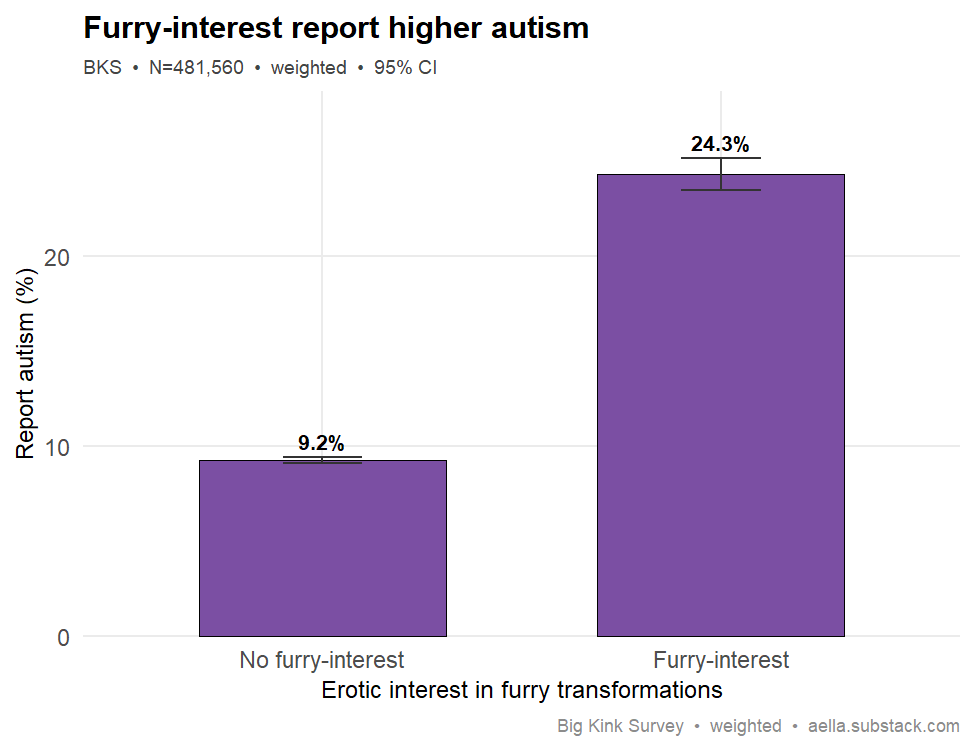
Your data: Replicates. Respondents with erotic furry-transformation interest report autism at 24.3% vs 9.2% for others (~2.6x; sex+age-adjusted OR=3.2). The literature's chief caveat — furries skew male, autism skews male — does not explain it: the gap holds within both sexes and is largest in women. Two construct caveats: this column is erotic furry interest, not fandom identity; and autism is self-reported presence, not a diagnosis. Cross-sectional.
Survey question(s) asked
- “Which of the following categories of transformations do you find erotic?” — checkbox, 12 options; “Furries” checked vs not
- “Do you have any of the following” — checkbox, 19 conditions (tip: “Please only check if they're 'moderate to severe'”); “Autism” checked vs not
- The transformations checkbox was shown only to respondents who checked “Transformations (growth/shrinking, bodyswapping, furries, etc.)” on the kink-category checklist and rated “I find sexual scenarios involving transformations to be:” above “Not arousing”; everyone else is counted as no furry interest. Autism is self-reported presence, not a diagnosis.
133. Asexuality → more autism Not seen (proxy)
The claim: Asexuality (very low sexual desire) is associated with higher autism rates.
Best: Weir, Allison & Baron-Cohen (2021), Autism Research. link
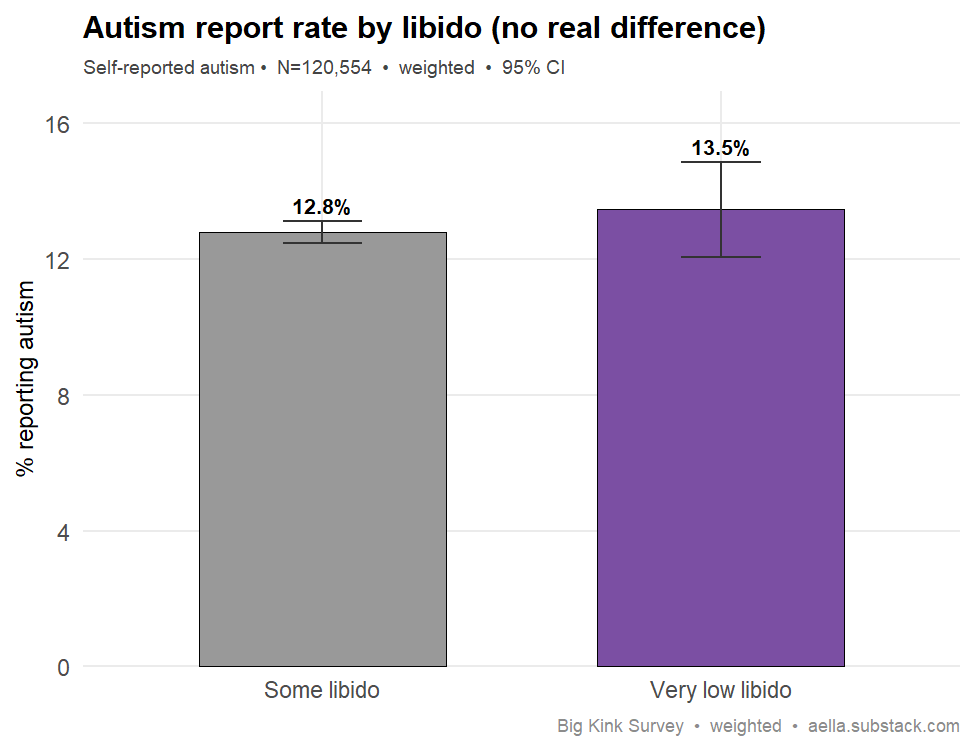
Your data: Doesn't replicate with this proxy. Using very-low momentary libido (horny-now = 0 and last-24h = 0), the autism rate is 13.5% vs 12.8% — overlapping CIs, and it vanishes after age+sex adjustment (OR=1.01, p=0.88). The published literature (Weir 2021) does find autistic adults more often asexual, but it measures trait sexual attraction, whereas these items measure state arousal — a weak proxy. So the broader claim is plausible; this specific test is null.
Survey question(s) asked
- “How horny are you right now?” — Not horny at all / A little horny / Moderately horny / Real horny
- “How horny have you been in the last 24 hours?” — same four options
- “Do you have any of the following” — checkbox, 19 conditions (tip: “Please only check if they're 'moderate to severe'”); “Autism” checked vs not
- The “asexuality” proxy = answering “Not horny at all” to both items — a momentary-arousal measure, not a question about sexual attraction or asexual identity. The horny items were added to the survey in May 2025, so this card rests on the later subsample.
134. Sissification interest → autism Replicates
The claim: Interest in sissification is associated with higher autism rates.
Best: Direct evidence for a specific sissification–autism link is limited; for the broader association between autism and elevated paraphilic interest see e.g. Schöttle, Briken, Tüscher & Turner (2017), Dialogues in Clinical Neuroscience 19(4), “Sexuality in autism: hypersexual and paraphilic behavior in high-functioning ASD.” link (Note: this reports paraphilias such as fetishism and masochism being more common among autistic individuals, rather than autism rates among people interested in sissification specifically.)
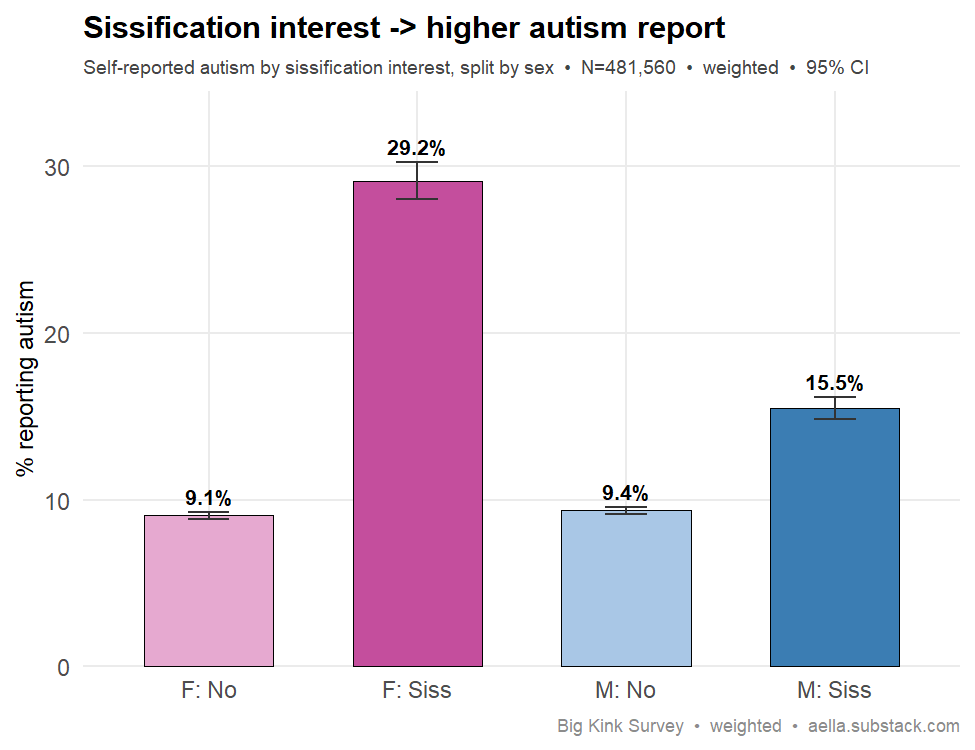
Your data: Replicates. People reporting sissification interest report autism at 18.6% vs 9.2% — roughly double. The association holds in both sexes (women 29% vs 9%; men 16% vs 9%) and isn't an age artifact; a logistic model adjusting for sex and age gives OR = 2.3. Gender identity absorbs part of this — trans and nonbinary respondents report both more sissification interest and more autism — but among cis respondents the association survives at OR = 1.6 (12.0% vs 7.6%; cis women 15.3% vs 6.8%, cis men 11.4% vs 8.4%). Caveats: autism self-reported, cross-sectional, and the effect is far larger in women — the opposite sex pattern to the cited clinical literature.
Survey question(s) asked
- “Which of the following do you find erotic?” — checkbox, 11 genderplay options; “Sissification (degredation by feminization)” [sic] checked vs not
- “Do you have any of the following” — checkbox, 19 conditions (tip: “Please only check if they're 'moderate to severe'”); “Autism” checked vs not
- The genderplay checkbox was shown only to respondents who checked “Genderplay (sissification, futa, crossdressing, etc.)” on the kink-category checklist and rated “I find sexual scenarios involving genderplay to be:” above “Not arousing”; everyone else is counted as not interested. Autism is self-reported presence, not a diagnosis.
135. Transgenderism kink ↔ being trans/nonbinary Replicates
The claim: Finding transgenderism/transformation erotic is far more common in trans/nonbinary people than cis.
Best: Illustrative — see Brown, Barker & Rahman (2020), The Journal of Sexual Medicine 17(1):99–110, which found that gender-identity discomfort and childhood gender nonconformity correlate with erotic-target-identity-inversion interests (e.g. autogynephilia/autoandrophilia). link. Note: this general-population study reports gender-identity factors as correlates rather than a direct trans/nonbinary-vs-cis prevalence comparison.
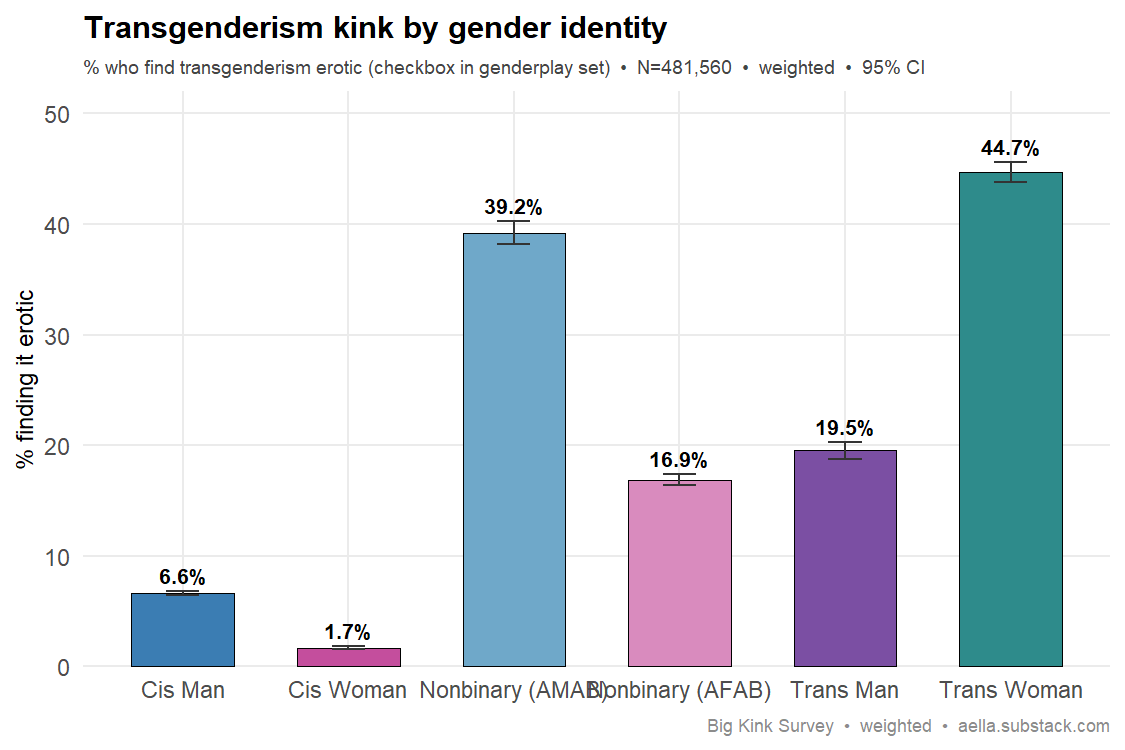
Your data: Confirmed. 25.8% of trans & nonbinary respondents find transgenderism erotic vs 4.3% of cis — a ~6x gap with non-overlapping CIs (n=481,560). By cell: trans women 44.7%, NB-AMAB 39.2%, trans men 19.5%, NB-AFAB 16.9%, cis men 6.6%, cis women 1.7%. Robust within sexes and age strata. Cross-sectional, not causal.
Survey question(s) asked
- “Which category fits you best?” — Man (cis) / Man (trans) / Woman (cis) / Woman (trans) / Nonbinary/other (assigned male at birth) / Nonbinary/other (assigned female at birth)
- “Which of the following do you find erotic?” — checkbox, 11 genderplay options; “Transgenderism” checked vs not
- “Trans & nonbinary” pools the four non-cis categories. The genderplay checkbox was shown only to respondents who checked “Genderplay (sissification, futa, crossdressing, etc.)” on the kink-category checklist and rated “I find sexual scenarios involving genderplay to be:” above “Not arousing”; everyone else is counted as not finding it erotic.
136. Transformation kink → autism Replicates
The claim: Interest in transformation fantasies is associated with higher autism rates.
Best: Direct peer-reviewed evidence for a transformation-fantasy-specific link to autism is lacking; for the broader association between autism and elevated nonnormative/paraphilic sexual interests see e.g. Schöttle, Briken, Tüscher & Turner (2017), Dialogues in Clinical Neuroscience 19(4):381–393. link (illustrative — this paper documents higher paraphilic interest in autistic samples generally, not transformation kink specifically)
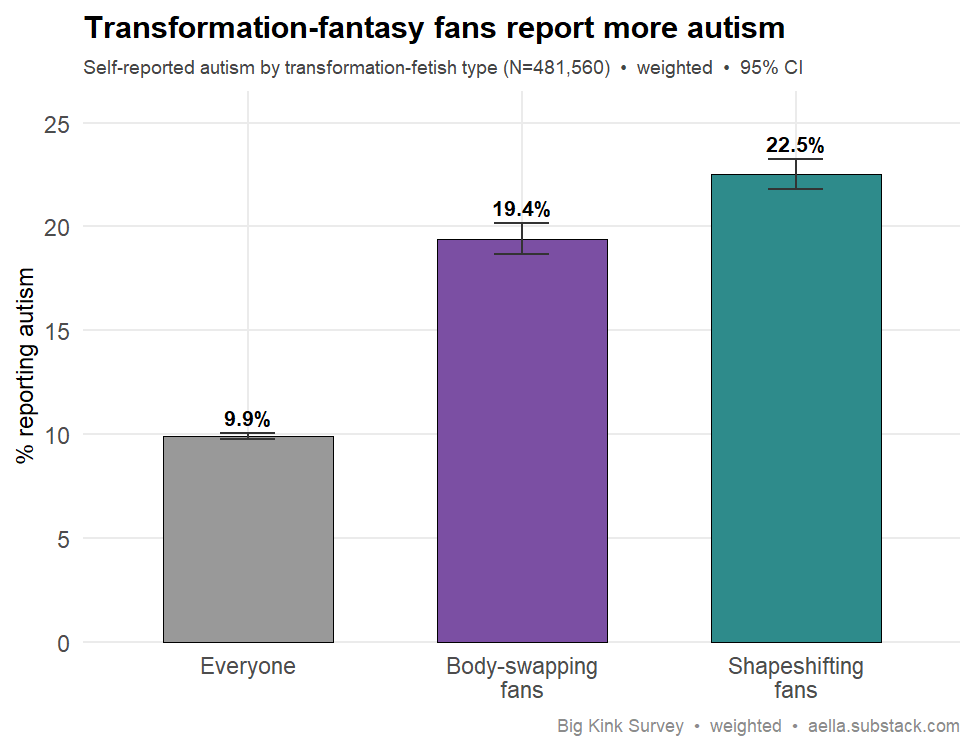
Your data: Supported, using transformation types other than furries: body-swapping fans report 19.4% autism and shapeshifting fans 22.5%, vs 9.9% overall (RR 2.0 and 2.3; population-weighted). It holds in both sexes and strengthens after age+sex adjustment (OR 2.4 and 3.0). Gender identity is the bigger compositional issue — trans/NB respondents are heavily overrepresented among transformation fans — and it absorbs about a third of the effect: among cis respondents the ORs drop to 1.7 and 2.1, attenuated but intact. Autism self-reported; cross-sectional. (See also furries, #132.)
Survey question(s) asked
- “Which of the following categories of transformations do you find erotic?” — checkbox, 12 options; “Body swapping” and “Shapeshifting” each checked vs not
- “Do you have any of the following” — checkbox, 19 conditions (tip: “Please only check if they're 'moderate to severe'”); “Autism” checked vs not
- The transformations checkbox was shown only to respondents who checked “Transformations (growth/shrinking, bodyswapping, furries, etc.)” on the kink-category checklist and rated “I find sexual scenarios involving transformations to be:” above “Not arousing”; everyone else is counted as not interested. Autism is self-reported presence, not a diagnosis.
Cycle, hormones & reproduction
137. Hormonal birth control → depression Contested
The claim: Hormonal contraception is associated with higher depression risk. (Contested.)
Best: Skovlund et al. (2016), JAMA Psychiatry (Danish cohort, >1M women; RR 1.23). link
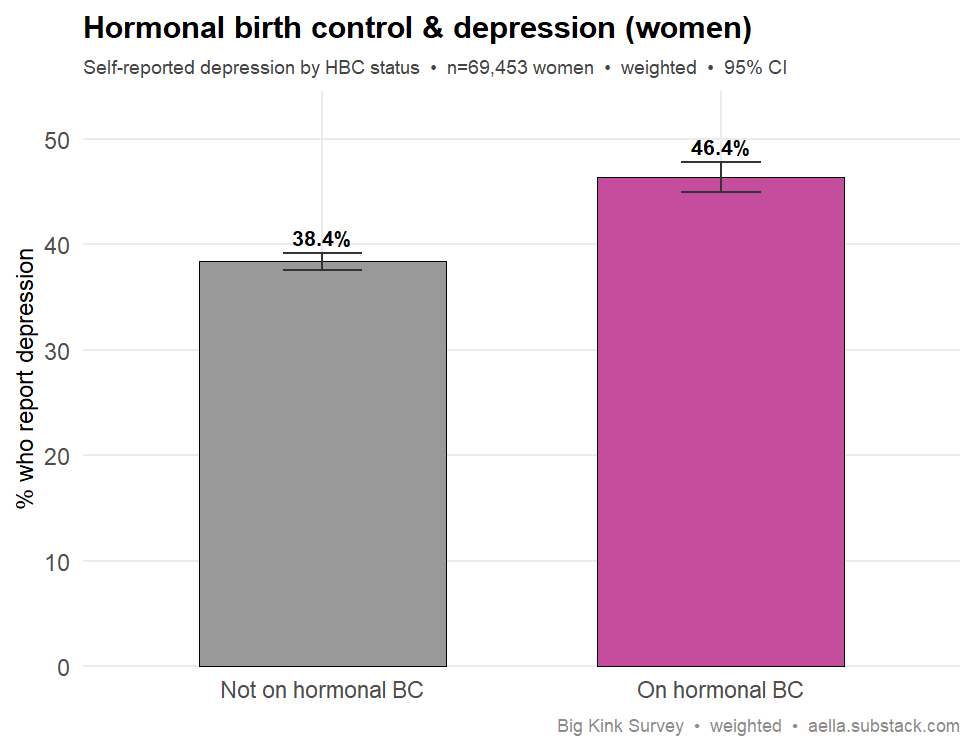
Your data: Among women (n=69,453), 46.4% of those on hormonal birth control report depression vs 38.4% of non-users — an ~8-point gap with non-overlapping CIs. Not an age artifact: users are slightly older and the age-adjusted OR (1.38) ≈ the unadjusted (1.39). Directionally matches Skovlund (2016). Marked contested because it's cross-sectional, self-reported (confounding-by-indication and reverse causation possible) and the literature is mixed.
Survey question(s) asked
- “Are you on hormonal birth control? This is the pill or any hormonal implant” — Don't want to answer / Yes / No
- “Do you have any of the following” — checkbox, 19 conditions (tip: “Please only check if they're 'moderate to severe'”); “Depression” checked vs not
- The birth-control item sits inside the Woman (cis) and Nonbinary/other (assigned female at birth) branches of the gender question and was added to the survey in November 2024, so it covers later respondents only. Depression is self-reported presence, not a diagnosis.
138. PMS severity → neuroticism Replicates
The claim: PMS severity is associated with higher neuroticism.
Best: Hamidovic et al. (2022), Psychiatry International (+ twin data, rG≈0.62). link
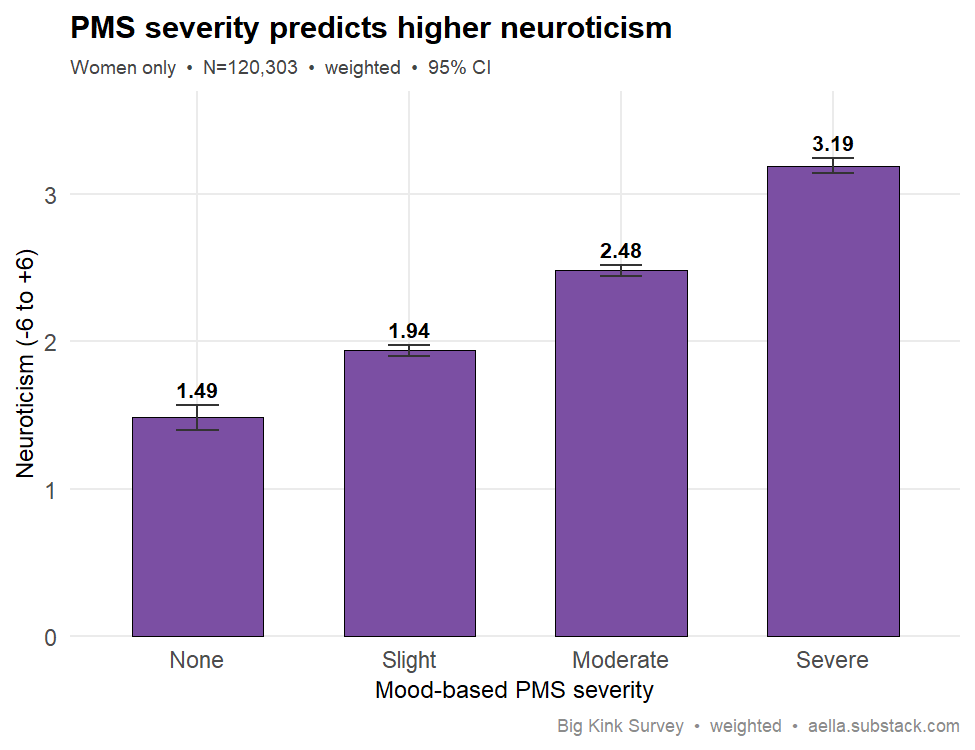
Your data: Replicates. Among women (n=120,303), mean neuroticism rises monotonically with PMS severity: none 1.49 → slight 1.94 → moderate 2.48 → severe 3.19 (−6…+6 scale), non-overlapping CIs, slope +0.58/level (essentially unchanged after age-adjustment). Caveats: cross-sectional (twin data show shared genetic loading, rG≈0.62), and PMS is a self-reported severity rating, so negative-affectivity reporting bias may inflate the link.
Survey question(s) asked
- “Do you get mood-based PMS symptoms during your menstrual cycle?” (tip: “e.g., irritability, anxiety, depression”) — I don't menstruate/I don't know / No / Yes, maybe/slightly / Yes, moderately / Yes, severely
- “I worry about things.” — Totally agree +3 … Totally disagree −3, 7-point
- “I am relaxed most of the time” — same 7-point agreement scale
- The neuroticism score is “I worry about things.” minus “I am relaxed most of the time” (range −6…+6) — a 2-item index, not a full Big Five scale. “I don't menstruate/I don't know” answers are excluded from the severity gradient.
139. PMS severity → more mental illness Replicates
The claim: PMS severity is associated with more self-reported mental-health conditions.
Best: Yen et al. (2020), Int. J. Environmental Research & Public Health (GAD↔PMDD OR 7.65). link
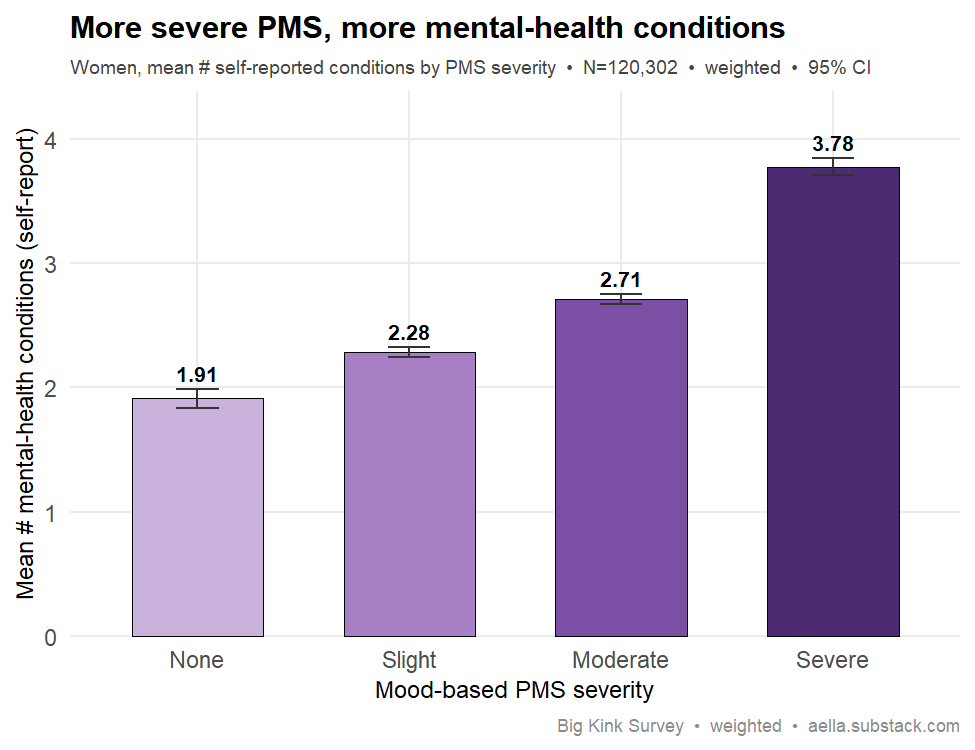
Your data: Clean gradient. Among ~120,000 women, the mean number of reported conditions climbs steadily with PMS severity — 1.91 (none) → 2.28 → 2.71 → 3.78 (severe), nearly doubling end-to-end (weighted r=0.22), surviving age-adjustment. Caveats: the outcome is reported counts (not diagnoses), the PMS item itself names anxiety and depression as examples (some overlap), and the design is cross-sectional.
Survey question(s) asked
- “Do you get mood-based PMS symptoms during your menstrual cycle?” (tip: “e.g., irritability, anxiety, depression”) — I don't menstruate/I don't know / No / Yes, maybe/slightly / Yes, moderately / Yes, severely
- “Do you have any of the following” — checkbox, 19 conditions from ADHD to Substance Abuse Disorder (tip: “Please only check if they're 'moderate to severe'”)
- The outcome is the number of boxes checked (0–19) — self-reported conditions, not diagnoses. The PMS tip itself names anxiety and depression, so some overlap between the two items is built in. “I don't menstruate/I don't know” answers are excluded from the severity gradient.
140. Breeding kink → wanting kids Data yes, lit disputes
The claim: Pregnancy/breeding kink is associated with wanting children (baby fever).
Best: No published study directly links pregnancy/breeding kink to wanting children; treat as a descriptive finding from this survey. (The previously cited Dawson, Suschinsky & Lalumière (2012), Archives of Sexual Behavior, concerns ovulatory shifts in fantasy and does not address this claim.)
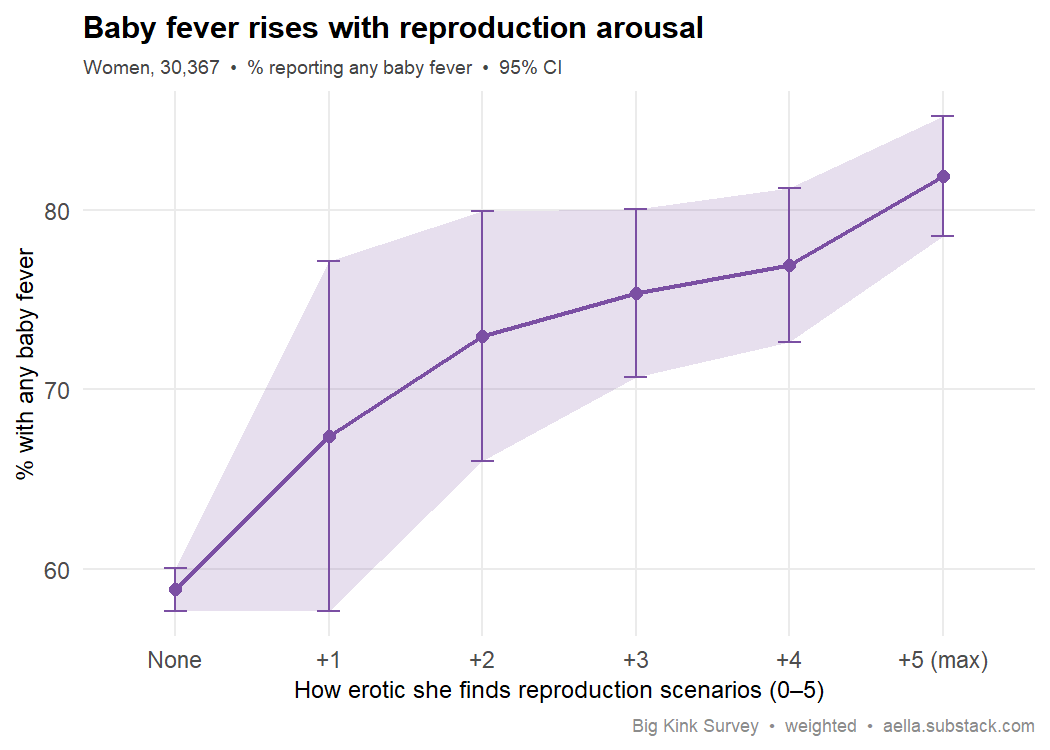
Your data: Data support a link, but it isn't specific to "breeding" — it's general pregnancy/reproduction arousal that tracks baby fever, which is exactly the nuance the clinical literature raises. Among 30,367 women, those who checked breeding/impregnation as erotic were more likely to report baby fever: 77.1% (any) vs 59.4%, and 37.7% (strong) vs 20.4%; mean 1.15 vs 0.80 (0–2). It is not an age artifact — age-adjustment slightly strengthens it (OR 2.4). But the signal is not breeding-specific: there is a clean dose-response across the whole reproduction-arousal scale (any baby fever rises 58.9% → 81.9% from "not erotic" to "max"), and once you control for how erotic a woman finds reproduction overall, the breeding checkbox adds nothing (OR 1.02, p=0.76); within pregnancy-aroused women, breeding vs no-breeding is identical (77.1% vs 78.2%). So the breeding kink is just one marker of finding reproduction erotic, and that broad arousal — not the kink label — is what co-occurs with wanting kids. No peer-reviewed study directly tests this, and lay/clinical consensus holds the kink eroticizes the act of impregnation, not a desire to raise children (many with the kink don't want kids; it appears in same-sex dynamics where conception is impossible). Cross-sectional; self-report.
Survey question(s) asked
- “Do you have baby fever?” (tip: “Do you really wanna have a baby (or another baby, if you already have kids)”) — Not at all / A little maybe? / Yeah I want baby (scored 0–2)
- “Which of the following is erotic?” — checkbox, 7 reproduction options; “Breeding/impregnation” checked vs not
- “I find sexual scenarios involving reproduction to be:” — Not arousing / Slightly arousing / Somewhat arousing / Moderately arousing / Very arousing / Extremely arousing
- Baby fever was asked only of female-assigned respondents. The reproduction-arousal question and the breeding checkbox were shown only to respondents who checked “Reproduction (pregnancy, surrogacy, oviposition, etc.)” on the kink-category checklist (the checkbox additionally required arousal above “Not arousing”); women who never opened that branch are counted as 0 / “not arousing”. The raw arousal codes {0,1,2,3,5,8} are stored as ordinal 0–5 in the cleaned data.
Trauma, sexuality & personality
141. Childhood sexual abuse → more partners Replicates age-adjusted
The claim: Childhood sexual abuse is associated with more sexual partners (sexualized coping / hypersexuality).
Best: Noll, Trickett & Putnam (2003), Journal of Consulting and Clinical Psychology 71(3):575–586 — 10-year prospective study finding childhood sexual abuse predicts earlier sexual debut and greater sexual preoccupation. link Backup: see also Trickett, Noll & Putnam (2013), Development and Psychopathology (multigenerational longitudinal review of CSA on female sexual development).
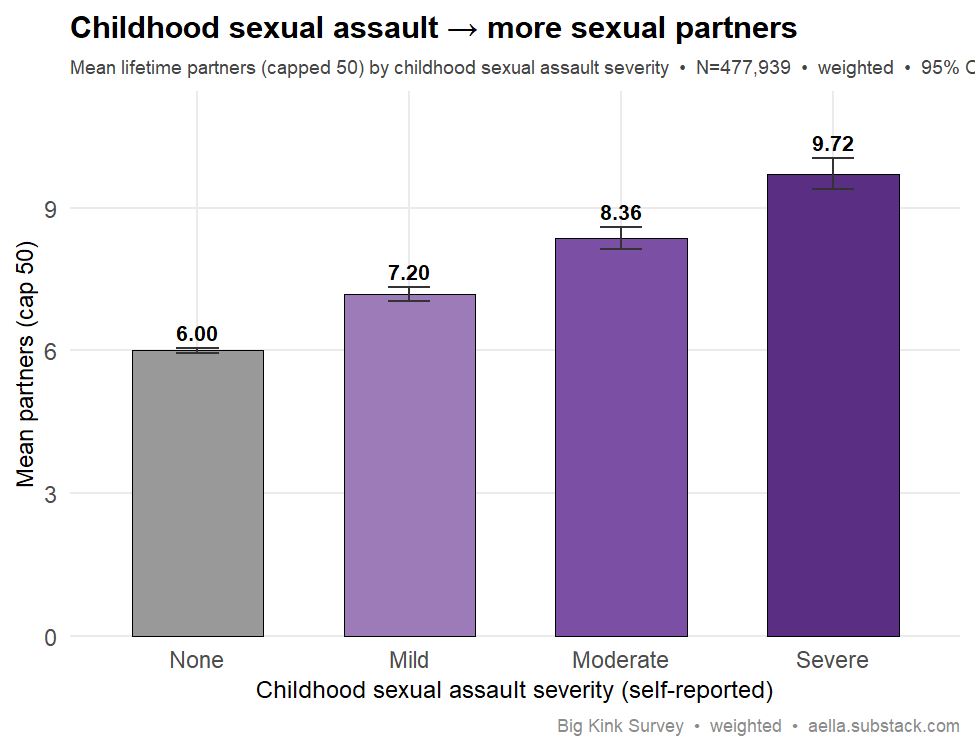
Your data: A clear stepwise dose-response — mean partners (cap 50) rise None 6.0 → Mild 7.2 → Moderate 8.4 → Severe 9.7 (n=477,939). The gradient survives adjustment for age and sex and appears within both sexes. Cross-sectional/observational, retrospective CSA self-report — so causal direction is unproven.
Survey question(s) asked
- “Did you experience sexual assault in your childhood?” — No / Yes, mild / Yes, moderate / Yes, severe
- “How many people have you had sex with?” (tip: “By your definition of 'sex' - this typically means penetration, and sometimes includes oral sex.”) — free numeric entry
- Partner counts are capped at 50 for the means shown on the chart.
142. Bisexuals → more partners Measure-dependent
The claim: Bisexual people report more sexual partners than heterosexuals.
Best: Jackson et al. (2019), BMJ Sexual & Reproductive Health (English Longitudinal Study of Ageing) — bisexual women had ~5.9× the odds of reporting 10+ lifetime partners vs heterosexual women. link Backup: Jeffries (2011), Perspectives on Sexual and Reproductive Health — behaviorally bisexual men reported ~3.1 more past-year partners than heterosexual men. link
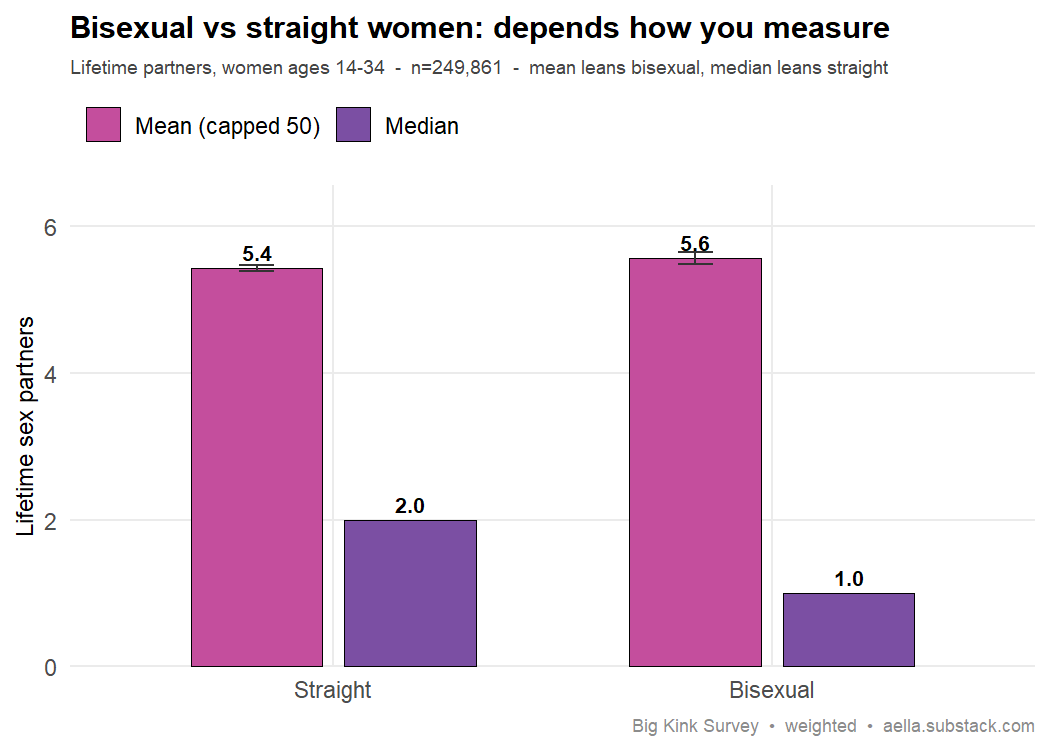
Your data: Weak and measure-dependent. Among women ages 14–34, the answer depends entirely on how you summarise a very skewed count: the age-adjusted mean puts bisexual women slightly ahead (+0.22 partners on the report-standard cap-50 scale, +0.35 weighted; p≈1e-7), directionally consistent with the sources — but the median goes the other way (the typical straight woman reports 2 partners vs 1 for bisexual women), the rank (Spearman) correlation is −0.02 (≈zero), and on the 10-plus-lifetime-partners cut the cited Jackson study uses, the groups tie (17.4% vs 17.6%). On the full 14–75 sample the age-adjusted mean gap is a trivial +0.06. Honest call: no robust partner-count difference — the mean leans bisexual-higher, the median leans straight-higher. (Orientation here is attraction-based — the middle of a genital/visual attraction composite — not self-identification as in the cited studies, and raw partner count is only one facet of the sociosexuality construct.)
Survey question(s) asked
- “You're sexually attracted to people with___” — Penises, exclusively / Penises, mostly / Penises, slightly / Both equally / Vaginas, slightly / Vaginas, mostly / Vaginas, exclusively
- “You're more sexually attracted to people who appear visually” — Totally masculine / Somewhat masculine / Slightly masculine / Equally masculine and feminine / Slightly feminine / Somewhat feminine / Totally feminine
- “How many people have you had sex with?” (tip: “By your definition of 'sex' - this typically means penetration, and sometimes includes oral sex.”) — free numeric entry
- Straight/Bisexual here are derived from these two attraction items relative to birth sex (“Bisexual” = the averaged composite within ±0.5 of the middle) — not a self-identification question. The analysis uses women only; reported counts above 500 are dropped and the mean uses a cap of 50.
143. Chemsex interest → more mental illness Replicates
The claim: Interest in eroticizing recreational drugs (chemsex) is associated with more mental-health conditions.
Best: Íncera-Fernández et al. (2021), Int. J. Environmental Research & Public Health (chemsex review). link
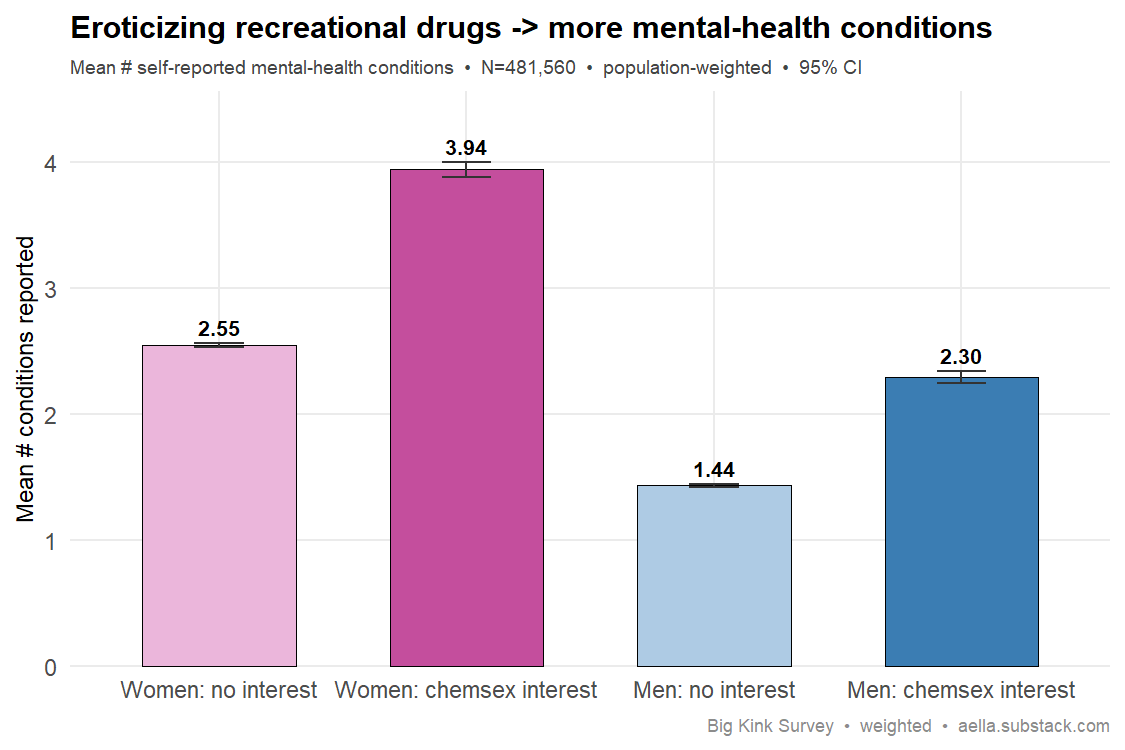
Your data: Supported. Respondents who find cocaine/meth/ecstasy erotic report a mean of 3.05 self-reported conditions vs 1.99 (population-weighted; non-overlapping CIs). The gap survives sex-splitting (women 3.94 vs 2.55; men 2.30 vs 1.44) and age adjustment (+1.10 conditions, p≈0), and isn't just substance dependence — excluding respondents who report a substance-use disorder still leaves +0.82. The chemsex literature finds the same depression/anxiety link — though for drug-use behavior in MSM, while this is eroticized interest in a mixed sample. Cross-sectional.
Survey question(s) asked
- “Which of the following drugs are erotic in sexual situations?” — checkbox: Aphrodesiacs (arousal drugs) / Psychedelics / Roofies / Poppers / Meth / Ecstasy / Cocaine / Heroin; “chemsex interest” = any of Cocaine, Meth, or Ecstasy checked
- “Do you have any of the following” — checkbox, 19 conditions (tip: “Please only check if they're 'moderate to severe'”); outcome = number of boxes checked (0–19)
- The drugs checkbox was shown only to respondents who checked “Drugs” under “Which of the following types of mental alteration do you find erotic?”, itself shown only to those who checked “Mental Alteration (hypnotism/mind control, amnesia, cocaine, etc.)” on the kink-category checklist and rated the category above “Not arousing”; everyone else is counted as not interested. Conditions are self-reported, not diagnoses.
144. Self-rated attractiveness → narcissism Weak
The claim: People who rate themselves as more attractive score higher on narcissism.
Best: Gabriel, Critelli & Ee (1994), Journal of Personality 62(1):143-155 (narcissism predicts inflated self-ratings of attractiveness). Backup: Holtzman & Strube (2010), J. Research in Personality 44(1):133-136 (meta-analysis; narcissism & observer-rated attractiveness). link
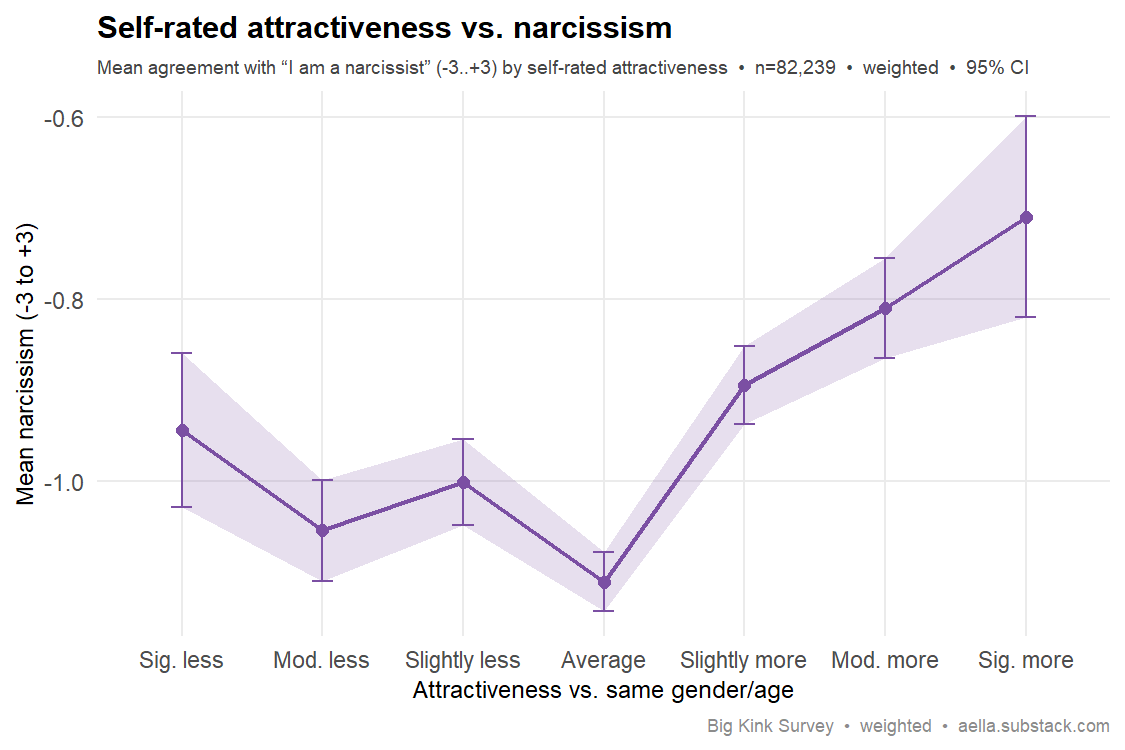
Your data: Supported but weak, with a construct caveat. Self-rated relative attractiveness ("compared to others your age/gender, you are more attractive") correlates positively with agreeing "I am a narcissist," but the effect is tiny: weighted r = 0.045 (n=82,239), and essentially identical on the full unweighted sample (ages 14-75: r = 0.046, n=175,872), so the truncated young sample isn't hiding anything. It is directionally consistent across sex (women r ≈ 0.03-0.04, men r ≈ 0.05) and survives controlling for age and sex (standardized β ≈ 0.05). The dose-response is clean in the upper half (mean narcissism rises monotonically from -1.11 at "average" to -0.71 at "significantly more attractive"), though the less-attractive tail is noisier. Caveats: the cited Holtzman & Strube (2010) meta-analysis is about narcissism and observer-rated attractiveness, whereas our item is self-rated — a related but distinct construct prone to shared self-enhancement bias, which makes how small our correlation is notable rather than reassuring. Narcissism is also a single self-aware item, and even the most-attractive group reports net disagreement with the narcissist statement. Direction matches; magnitude is faint.
Survey question(s) asked
- “Compared to other people of your same gender and age range, you are” — Significantly less attractive (−3) / Moderately less attractive / Slightly less attractive / About average attractiveness (0) / Slightly more attractive / Moderately more attractive / Significantly more attractive (+3)
- “To what extent do you agree with this statement: I am a narcissist.” (tip: “The word ‘narcissist’ means egotistical, self-focused, and vain”) — Totally agree (+3) / Agree / Somewhat agree / Neither agree nor disagree (0) / Somewhat disagree / Disagree / Totally disagree (−3)
145. Neuroticism → sexual shame Replicates
The claim: Neuroticism is associated with more shame about one's own sexual arousal.
Best: see e.g. Reid, Stein & Carpenter (2011), J. Nervous & Mental Disease 199(4):263–267 — in a clinical sample of hypersexual men, neuroticism and shame were closely linked (shame's effect on hypersexuality ran through neuroticism). Illustrative of the neuroticism–sexual-shame association rather than a general-population test of arousal-specific shame. link
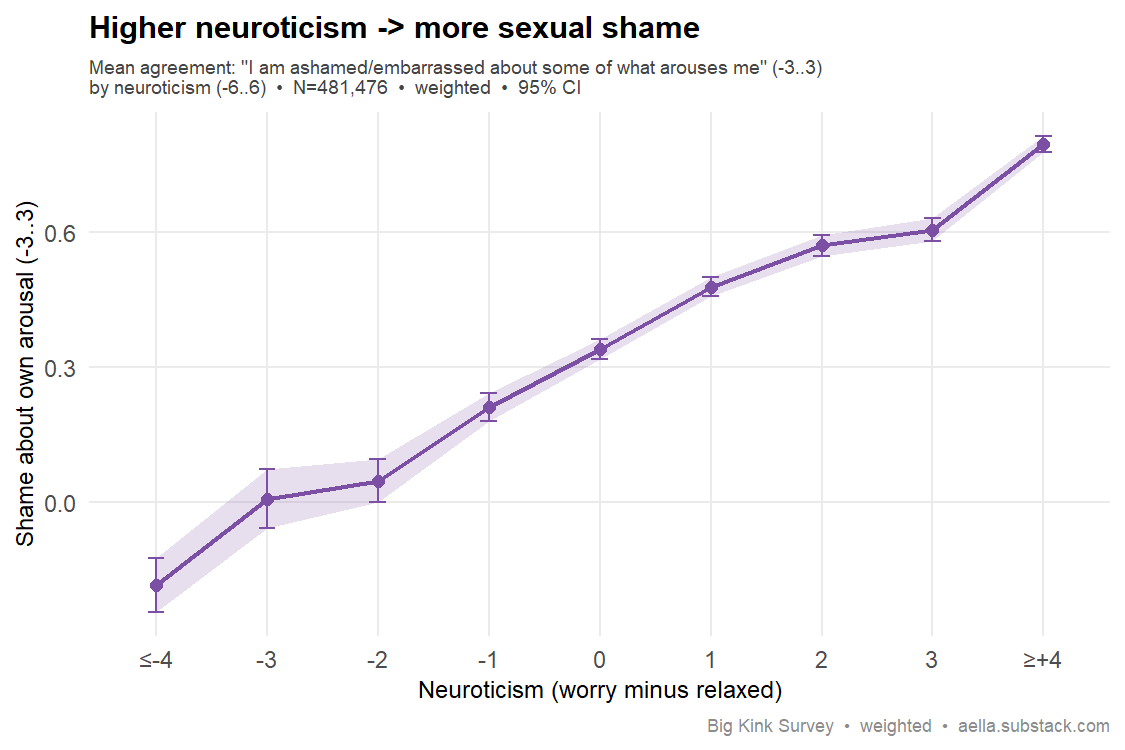
Your data: Confirmed. Neuroticism correlates with agreeing "I am ashamed about some of what arouses me," weighted r=0.138 (n=481,476). Mean shame climbs monotonically from −0.18 (most stable) to +0.80 (most neurotic) on the −3…+3 scale, and it holds within both sexes (men r=0.165, women r=0.142). Cross-sectional and associational, not causal.
Survey question(s) asked
- “I worry about things.” — Totally agree (+3) / Agree / Somewhat agree / Neither agree nor disagree (0) / Somewhat disagree / Disagree / Totally disagree (−3)
- “I am relaxed most of the time” — same 7-point agreement scale
- “I am ashamed or embarrassed about at least some of what arouses me” — same 7-point agreement scale
- “Neuroticism” here is a 2-item composite: agreement with “I worry about things.” minus agreement with “I am relaxed most of the time” (range −6 to +6) — not a full Big-5 neuroticism inventory.
146. Sadism → antisocial traits Replicates
The claim: Interest in giving pain (sadism) is associated with antisocial/sociopathic traits.
Best: O'Connell & Marcus (2019), Aggression & Violent Behavior (meta-analysis; psychopathy–sadism r=0.24). link
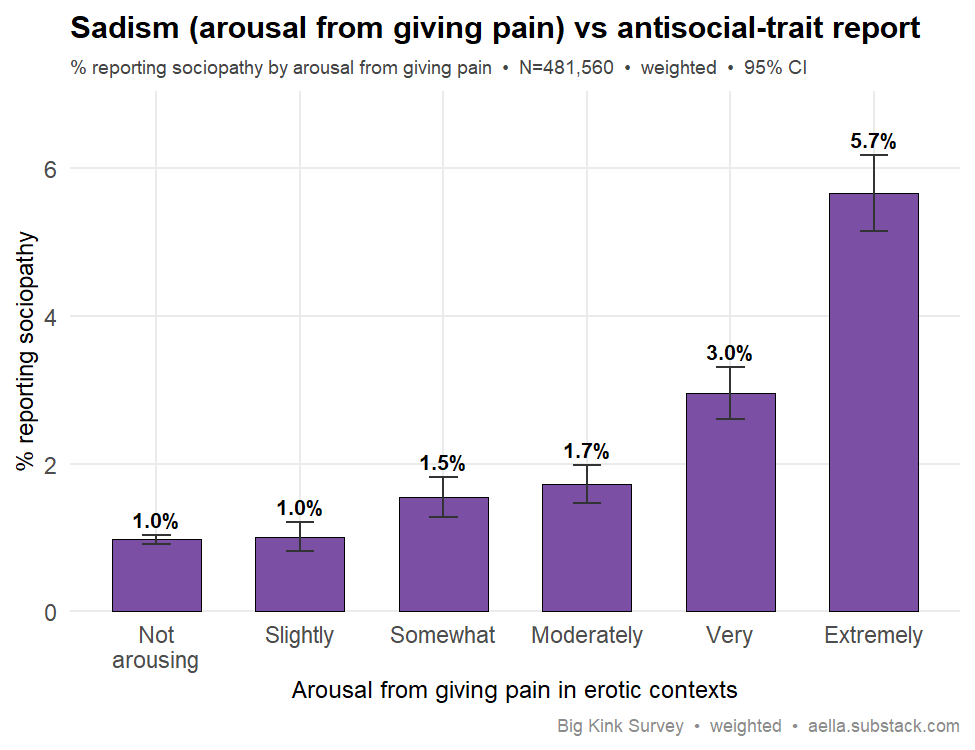
Your data: Replicates. Self-reported sociopathy rises monotonically with arousal to giving pain: 0.97% (not arousing) → 5.66% (extremely arousing). Dichotomized, high sadism shows 3.2% sociopathy vs 1.0% — a ~3.2x elevation that holds in both sexes and survives age+sex adjustment (OR=1.39 per level, p<1e-300). Consistent with the forensic psychopathy–sadism meta-analysis. Sociopathy self-reported; cross-sectional.
Survey question(s) asked
- “In erotic contexts, I find *giving* pain to others to be:” — Not arousing / Slightly arousing / Somewhat arousing / Moderately arousing / Very arousing / Extremely arousing
- “Do you have any of the following” (checkbox list of 19 conditions; tip: “Please only check if they’re ‘moderate to severe’”) — ‘Sociopathy’ checked vs not; a self-checked box, not a clinical diagnosis
- The pain question was only asked of respondents who checked “Sadomasochism (spanking, needle play, clamps, torture, etc.)” on the fetish checklist and rated that category above “Not arousing”; everyone else is counted as 0 / “Not arousing”.
- The six arousal options carry raw survey values {0, 1, 2, 3, 5, 8} but are stored as ordinal 0–5 in the dataset; the analysis treats them as six ordered levels.
147. Trans men: a distinctive attraction profile Replicates
The claim: Trans men report distinctive sexual-attraction patterns. (Exploratory.)
Best: Auer et al. (2014), PLoS ONE (FtM orientation change & fluidity). link
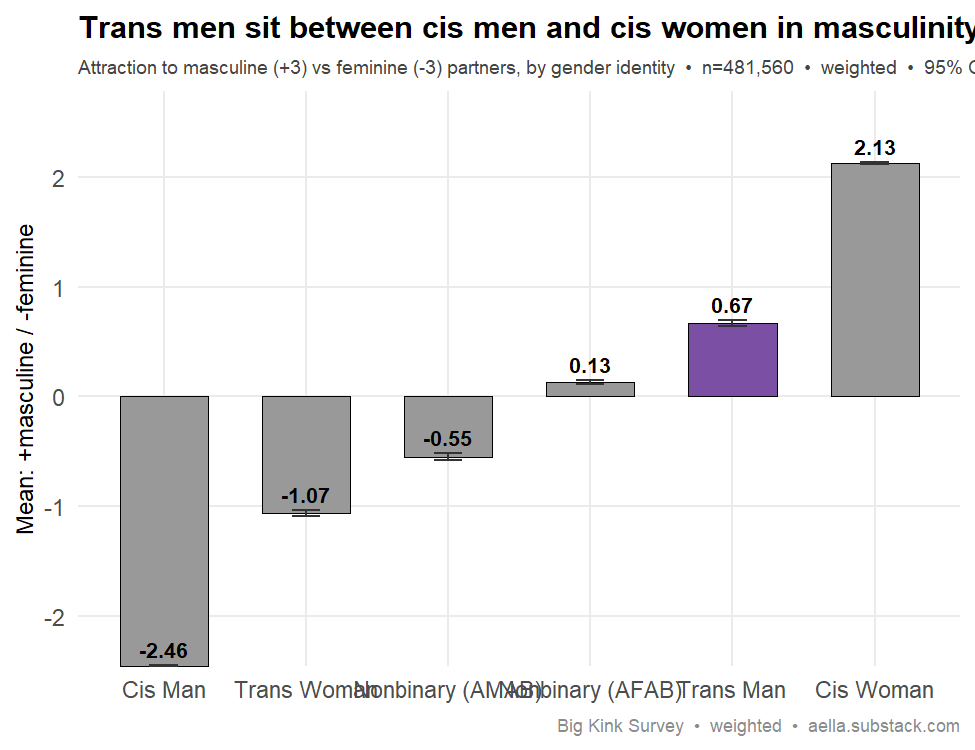
Your data: Supported and distinctive. On masculinity-of-partner (+3 masculine to −3 feminine), trans men sit at +0.67 — squarely between cis men (−2.46) and cis women (+2.13), and far more balanced/heterogeneous than either (37% "equally masculine & feminine"). This intermediate position holds within every age bin. On partner gender-congruence, 16.1% of trans men prefer trans/non-cis partners vs just 1.2% of cis people (~13x) — though that openness is shared with NB-AFAB people (13.3%), so it reflects gender diversity broadly. Exploratory, cross-sectional (n=17,509).
Survey question(s) asked
- “You’re more sexually attracted to people who appear visually” — Totally masculine (+3) / Somewhat masculine / Slightly masculine / Equally masculine and feminine (0) / Slightly feminine / Somewhat feminine / Totally feminine (−3)
- “You’re more sexually attracted to people whose gender identity ____ match their genitals” (tip: “Their biological genitals”) — Does not match (trans/enby) (+2) / Slightly does not match (trans/enby) (+1) / Equally attracted to both (0) / Slightly does match (cis) (−1) / Does match (cis) (−2)
- “Which category fits you best?” — Man (cis) / Man (trans) / Woman (cis) / Woman (trans) / Nonbinary/other (assigned male at birth) / Nonbinary/other (assigned female at birth)
- The groups compared (cis men, cis women, trans men, etc.) come directly from respondents’ self-categorization on this last item.
Personality, porn & desire
148. Wanting casual sex → more porn use Replicates
The claim: People with a more unrestricted sociosexual orientation (motivated to seek casual sex) consume more pornography.
Best: Tokunaga, Wright & Roskos (2019), Human Communication Research 45(1):78–118 — meta-analysis (70+ studies, 13 countries) finding pornography consumption is positively associated with an impersonal, casual-sex (sociosexual) approach to sex in both men and women. link Backup: Crone et al. (2026), Archives of Sexual Behavior — men's unrestricted sociosexual orientation tracks pornography use and genre preferences. link
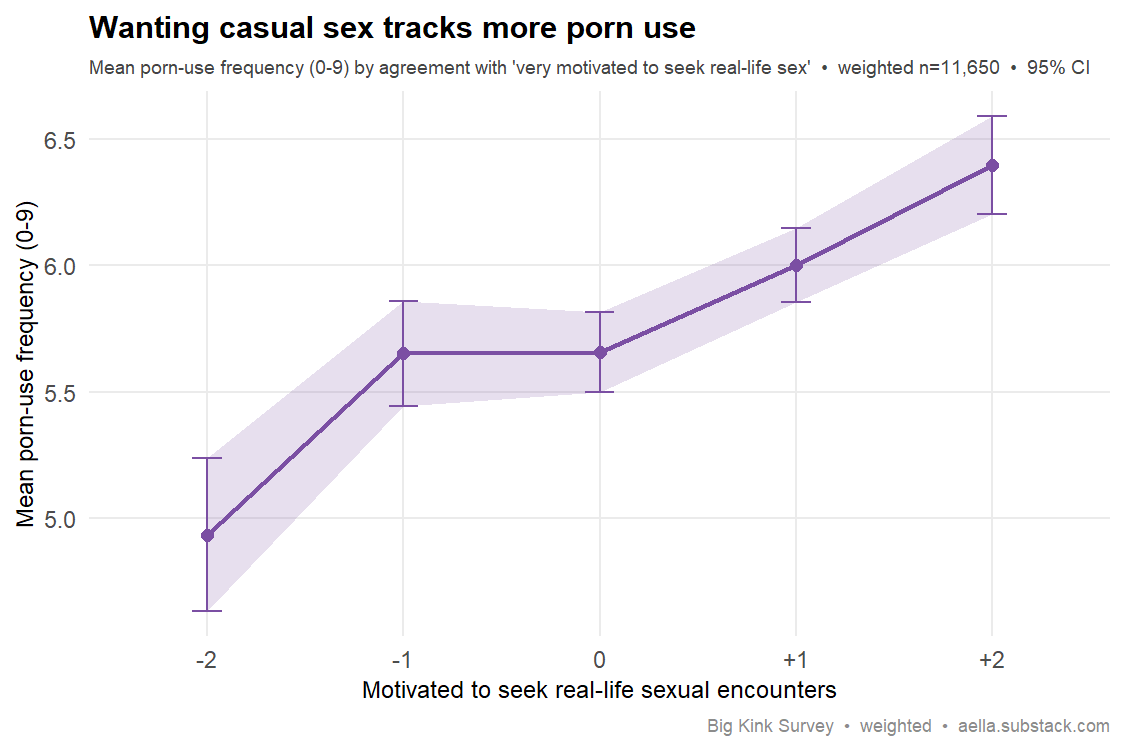
Your data: porn-use frequency (0-9) climbs steadily with agreement that "I am very motivated to seek out real-life sexual encounters" — from a mean of 4.93 at strong disagree (-2) up to 6.40 at strong agree (+2), a smooth monotonic gradient (weighted n=11,650; weighted r=0.13). Men sit higher on both, but the effect is not just that confound: it holds within each sex (Female 4.22→5.64; Male 5.55→6.68) and survives controlling for age and sex in a weighted regression (+0.23 porn-frequency points per step of motivation, t=11.8, p≈4e-32). Replicates cleanly, with one construct caveat: the item here measures motivation to seek real-life sex in general, not casual or uncommitted sex specifically — a looser proxy for sociosexuality than the SOI scales used in the cited studies.
Survey question(s) asked
- “I am very motivated to seek out real-life sexual encounters” — Strong disagree (−2) / Disagree / Neutral (0) / Agree / Strong agree (+2)
- “How often do you watch or read pornographic/erotic content?” (tip: “for the purposes of getting aroused”) — I don’t (0) / Less than once a year (1) / Once a year (2) / A few times a year (3) / Once a month (4) / A few times a month (5) / Once a week (6) / Multiple times a week (7) / Daily (8) / Multiple times a day (9)
- Note the predictor asks about motivation to seek real-life sex generally — it does not mention casual or uncommitted sex specifically.
149. Narcissism → more porn use Replicates
The claim: Narcissistic self-focus is associated with more frequent pornography use.
Best: Kasper, Short & Milam (2015), Journal of Sex & Marital Therapy 41(5):481-6, “Narcissism and Internet pornography use” — hours of pornography use positively correlated with narcissism (PubMed). Backup: see also research linking narcissistic antagonism to perceived pornography addiction (Brown et al., 2023, Journal of Research in Personality).
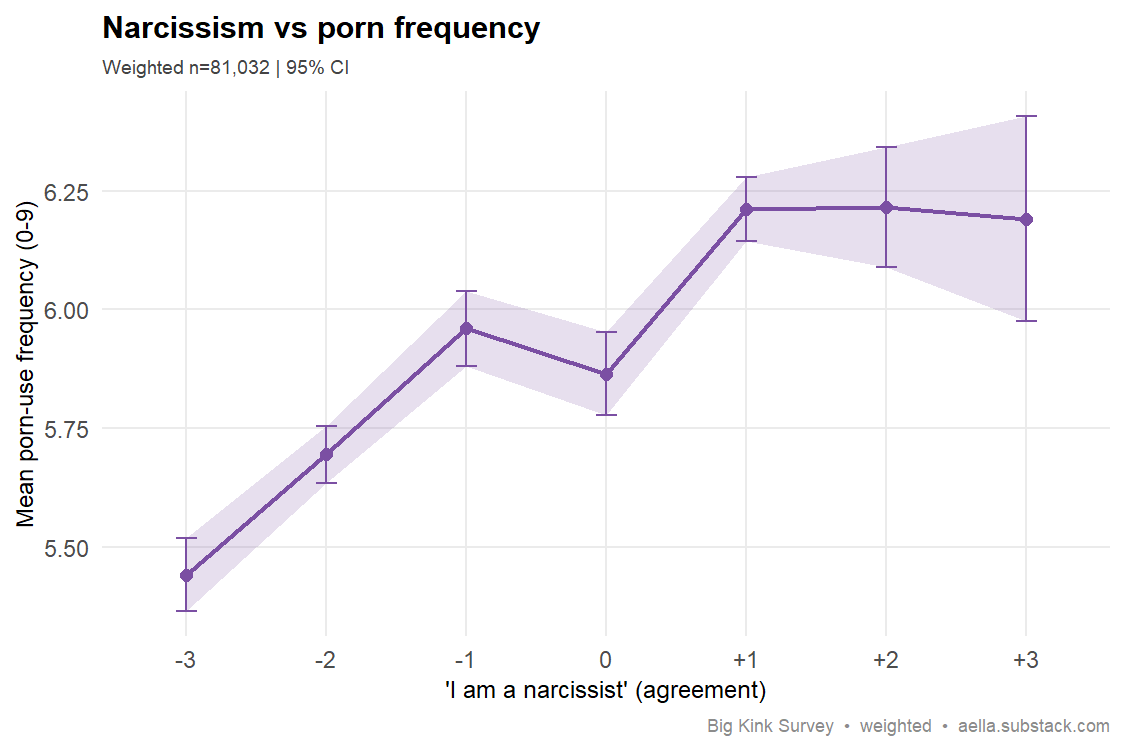
Your data: Mean porn-use frequency (0-9 scale) climbs steadily with self-reported narcissism — from 5.44 among people who most strongly reject 'I am a narcissist' (-3) to 5.96 at -1, 6.21 at +1, and ~6.19-6.22 at the agreeing end (+2/+3); weighted n=81,032 (effective n≈28,500). The weighted slope is +0.156 points per agreement step (p≈1e-162). It holds after controlling for age and sex (+0.130 per step, p≈1e-118) and appears in both sexes (men +0.099, women +0.124 per step). A clean, monotonic dose-response in the predicted direction — narcissism tracks more frequent porn use, and it isn't an age or sex artifact. Replicates.
Survey question(s) asked
- “To what extent do you agree with this statement: I am a narcissist.” (tip: “The word ‘narcissist’ means egotistical, self-focused, and vain”) — Totally agree (+3) / Agree / Somewhat agree / Neither agree nor disagree (0) / Somewhat disagree / Disagree / Totally disagree (−3)
- “How often do you watch or read pornographic/erotic content?” (tip: “for the purposes of getting aroused”) — I don’t (0) / Less than once a year (1) / Once a year (2) / A few times a year (3) / Once a month (4) / A few times a month (5) / Once a week (6) / Multiple times a week (7) / Daily (8) / Multiple times a day (9)
- Narcissism is this single self-labeled agreement item, not a multi-item narcissism inventory.
150. Neuroticism → porn over partnered sex Weak / male-led
The claim: Higher neuroticism/negative affectivity predicts preferring pornography to real-life partnered sex.
Best: Evidence here is indirect: neuroticism/negative affectivity is an established predictor of problematic, coping-motivated pornography use rather than a documented preference for porn over partnered sex. See e.g. Egan & Parmar (2013), Journal of Sex & Marital Therapy 39(5), "Dirty Habits? Online Pornography Use, Personality, Obsessionality, and Compulsivity" — neuroticism loads on a latent compulsive-use measure alongside pornography use.
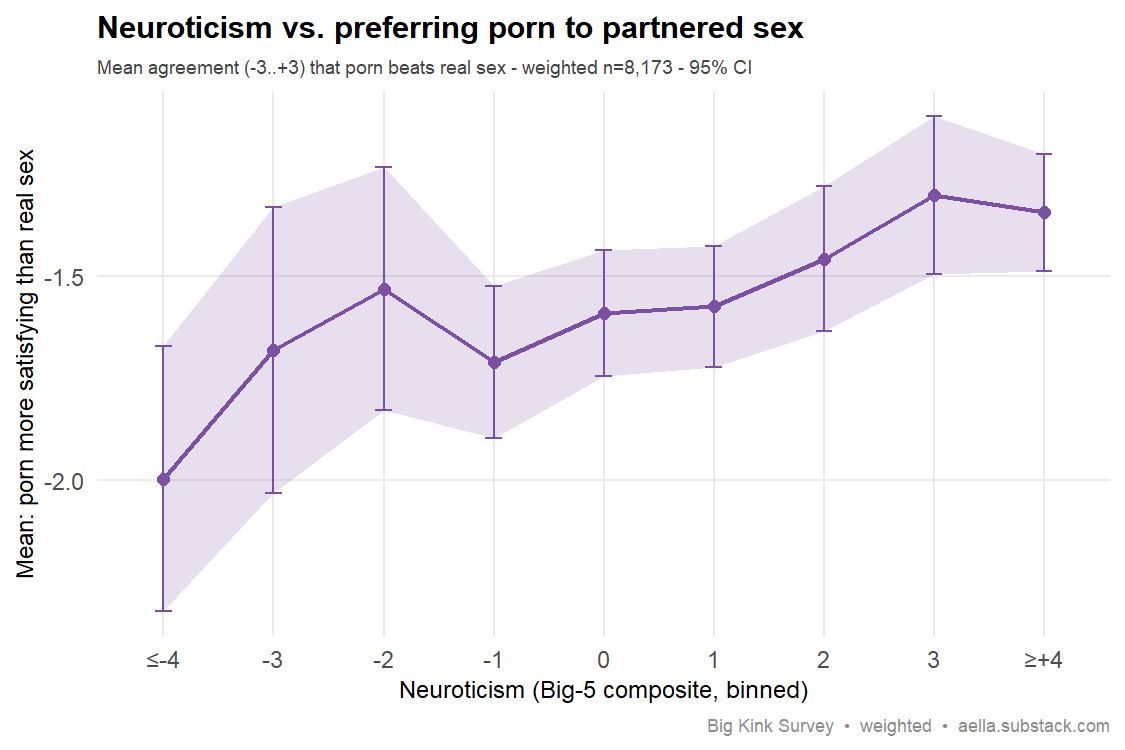
Your data: the direction is right but the effect is small. Agreement that "porn is more satisfying than sex with a real person" (-3..+3) rises with neuroticism, from -2.00 [-2.32,-1.67] among the most emotionally stable to -1.35 [-1.49,-1.20] among the most neurotic (weighted n=8,173; weighted r=0.080). Crucially every group lands in the negative — almost everyone disagrees; the neurotic just disagree a bit less. It survives controls: age-residualized r=0.075, and a weighted model with sex + age gives a neuroticism coefficient of +0.036 (p=6e-6). But it's sex-dependent — clear in men (r=0.072, -2.04 → -1.42 across the gradient) and weak/flat in women (r=0.022). Verdict: a genuine, directionally-correct but small signal, driven mostly by men.
Survey question(s) asked
- “I worry about things.” — Totally agree (+3) / Agree / Somewhat agree / Neither agree nor disagree (0) / Somewhat disagree / Disagree / Totally disagree (−3)
- “I am relaxed most of the time” — same 7-point agreement scale
- “Pornography/erotic content is usually more satisfying than sex with a real person” — Strongly agree (+3) / Agree / Slightly agree / Neutral (0) / Slightly disagree / Disagree / Strongly disagree (−3), plus a “Haven’t had sex/NA” option
- “Neuroticism” here is a 2-item composite: “I worry about things.” minus “I am relaxed most of the time” (range −6 to +6) — not a full Big-5 scale.
- Respondents who chose “Haven’t had sex/NA” are excluded from this analysis.
Mate value & objectification
151. Self-rated attractiveness → likes catcalls Sex-dependent
The claim: People who rate themselves as more attractive than their peers react more positively to unsolicited sexual attention (catcalling).
Best: Direct evidence is thin; the closest established work is on objectification valence and reactions to sexual attention — see e.g. Gervais, Allen, Riemer & Gullickson (2019), Personality and Social Psychology Bulletin 45(4), the "balanced objectification hypothesis" (complimentary objectification is approached more positively when it aligns with positive body sentiment). Backup: On how appraisals of unsolicited sexual attention vary with context and attractiveness, see the stranger-harassment "context effects" literature (e.g. Saunders et al.). Treat this card as illustrative: no single study tests self-rated attractiveness as a moderator of reactions to catcalling.
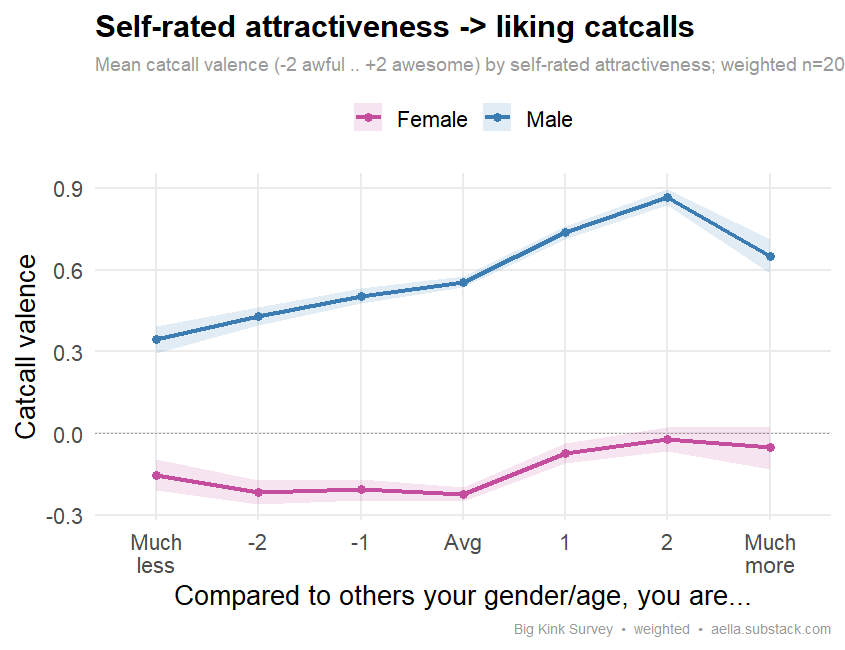
Your data: the gradient holds in the predicted direction within both sexes, but a massive sex confound dominates the level. Overall men rate catcalls positively (+0.61) and women negatively (-0.16). Among men, valence climbs monotonically from +0.34 at "much less attractive" to +0.87 at +2 (slope +0.092 per step, p<1e-290; weighted effective n≈43,500). Among women it rises from about -0.22 in the below-average range to near-neutral (-0.02) at +2 (slope +0.036 per step, p<1e-41; effective n≈27,200) — less aversive when they feel attractive, but still net-negative. Both lines dip slightly at the very top level (+3), where n is sparsest. Total weighted n=203,017. Verdict: the moderation replicates as a direction in both sexes, but the actual sign of how catcalls feel is set almost entirely by sex — men enjoy them, women mostly don't, and self-rated attractiveness only shifts each within that.
Survey question(s) asked
- “Compared to other people of your same gender and age range, you are” — Significantly less attractive (−3) / Moderately less attractive / Slightly less attractive / About average attractiveness (0) / Slightly more attractive / Moderately more attractive / Significantly more attractive (+3)
- “Getting catcalled on the street (or the thought of getting catcalled) feels more:” (tip: “Assume a single, standard, objectifying catcall, such as ‘lookin sexy, baby’ as you walk by.”) — Awesome (+2) / A bit positive (+1) / Neutral (0) / A bit negative (−1) / Awful (−2)
- The item covers real or imagined catcalls (“or the thought of getting catcalled”), so responses — especially men’s — may reflect a hypothetical rather than experienced scenario.
152. Self-rated attractiveness → more partners Replicates
The claim: Higher self-rated attractiveness (a mate-value proxy) predicts more lifetime sexual partners.
Best: Arnocky et al. (2021), Archives of Sexual Behavior — meta-analysis (N=5,928) finding higher self-perceived mate value (including self-rated attractiveness) predicts a less restricted sociosexual orientation, i.e. more sexual partners (PMID 34327590). Backup: Rhodes, Simmons & Peters (2005), Evolution & Human Behavior — objectively (judge-)rated facial and body attractiveness correlated with number of sexual partners.
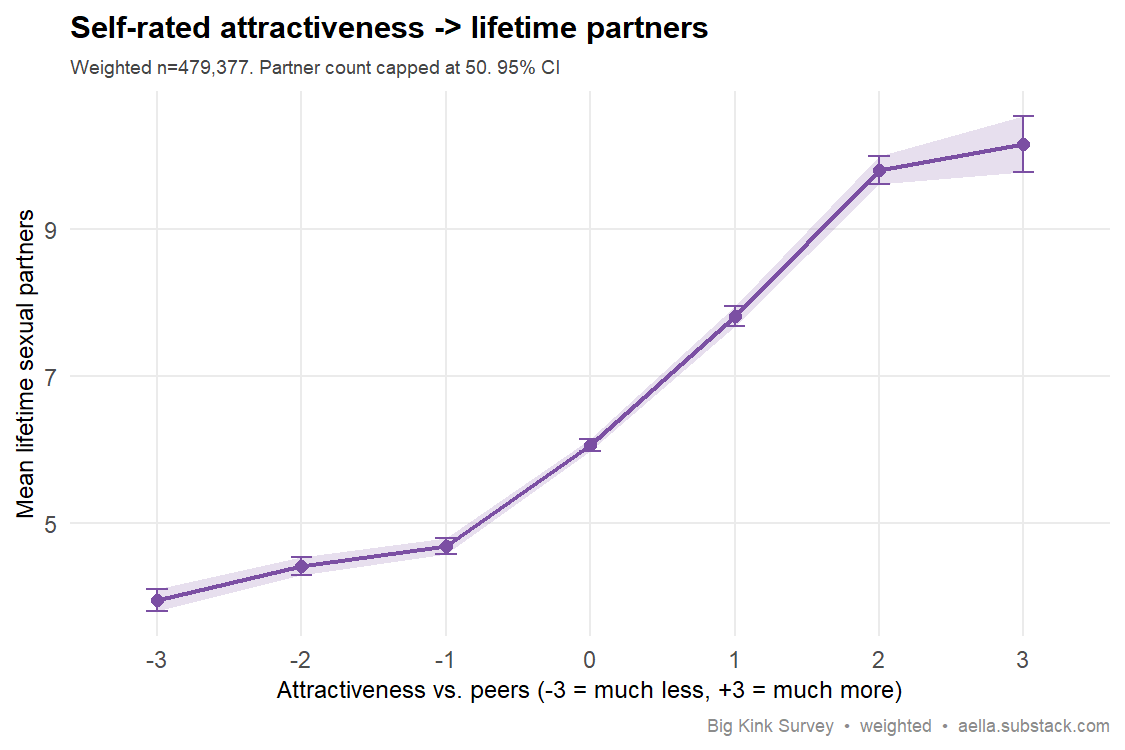
Your data: mean lifetime partners climb monotonically with self-rated attractiveness — from 3.9 for those rating themselves "much less attractive" than peers (-3), to 6.1 at average (0), to 10.2 for "much more attractive" (+3): a ~2.6x spread (weighted n=479,377, partner count capped at 50). Weighted r=0.17. Crucially the effect survives the obvious confounds: a weighted regression gives +1.23 partners per attractiveness point unadjusted, and still +1.13 after controlling for age and sex (p≈0). The gradient holds in both sexes (men 3.0→11.4, women 4.6→8.7 across the range) — steeper for men but clearly present in both. Clear replication in the predicted direction.
Survey question(s) asked
- “Compared to other people of your same gender and age range, you are” — Significantly less attractive (−3) / Moderately less attractive / Slightly less attractive / About average attractiveness (0) / Slightly more attractive / Moderately more attractive / Significantly more attractive (+3)
- “How many people have you had sex with?” (tip: “By your definition of ‘sex’ — this typically means penetration, and sometimes includes oral sex.”) — free numeric entry
- Partner counts are capped at 50 for this analysis.
Sex differences in desire & kink
153. Sex → preferred breast size Replicates
The claim: Stated preference for larger female breast size is male-skewed.
Best: Kościński (2019), American Journal of Human Biology 31:e23287 — rated by both sexes, men preferred slightly larger breasts than women did (a male-skewed preference). Backup: Zelazniewicz & Pawlowski (2011), Archives of Sexual Behavior 40:1129 — among men, preference for larger breasts increased with unrestricted sociosexual (mating) orientation (men-only sample).
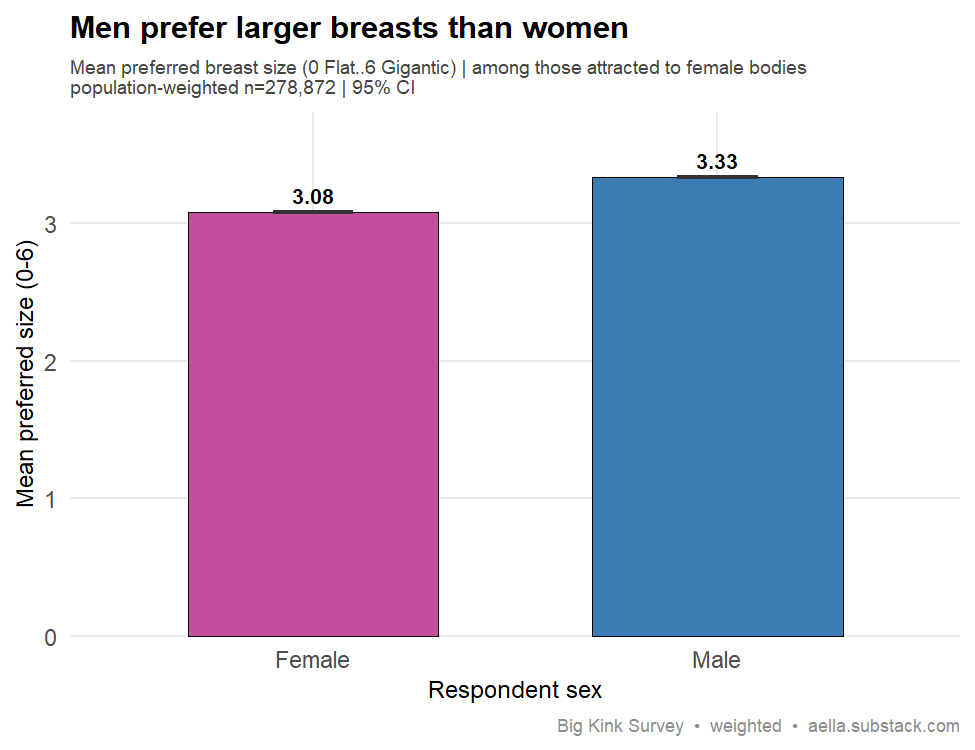
Your data: Among respondents attracted to female bodies (the question is only asked of people attracted to women, so the comparison is already restricted to the relevant group for both sexes), men prefer a larger breast size than women do — mean 3.33 [3.33, 3.34] for men vs 3.08 [3.07, 3.09] for women on a 0 (Flat) to 6 (Gigantic) scale, a gap of about 0.25 points (population-weighted n = 278,872). On a simple threshold, 13.3% of men prefer "Big" or larger versus 7.7% of women. The gap holds in every age bin of the weighted sample (diff +0.20 to +0.23), and on the full unweighted sample (ages 14-75, n = 644,162) it is 0.23 points, thinning to about +0.1 past age 40 — not an age artifact. Clear replication in the predicted direction.
Survey question(s) asked
- “Your preferred breast size in a partner is:” — Flat (0) / Small (1) / Small-medium (2) / Medium (3) / Medium-big (4) / Big (5) / Gigantic (6)
- “Which category fits you best?” — Man (cis) / Man (trans) / Woman (cis) / Woman (trans) / Nonbinary/other (assigned male at birth) / Nonbinary/other (assigned female at birth); “men” and “women” here are birth sex (Male/Female) derived from this item
- The breast-size question was only asked of respondents attracted to female bodies — those who answered “You’re sexually attracted to people with___” with “Both equally” or any “Vaginas” option.
154. Sex → sadism/masochism arousal Replicates
The claim: Men lean toward sadistic (give-pain) arousal and women toward masochistic (receive-pain) arousal.
Best: see e.g. Holvoet et al. (2017), Journal of Sexual Medicine 14(9):1152–1159 — in a general-population sample, BDSM/fetish interest was higher in men, and men leaned toward dominant roles while women leaned toward submissive ones. link Backup: Hébert & Weaver (2014), Canadian Journal of Human Sexuality 23(2):106–115 — sex differences in dominant/submissive BDSM orientation.
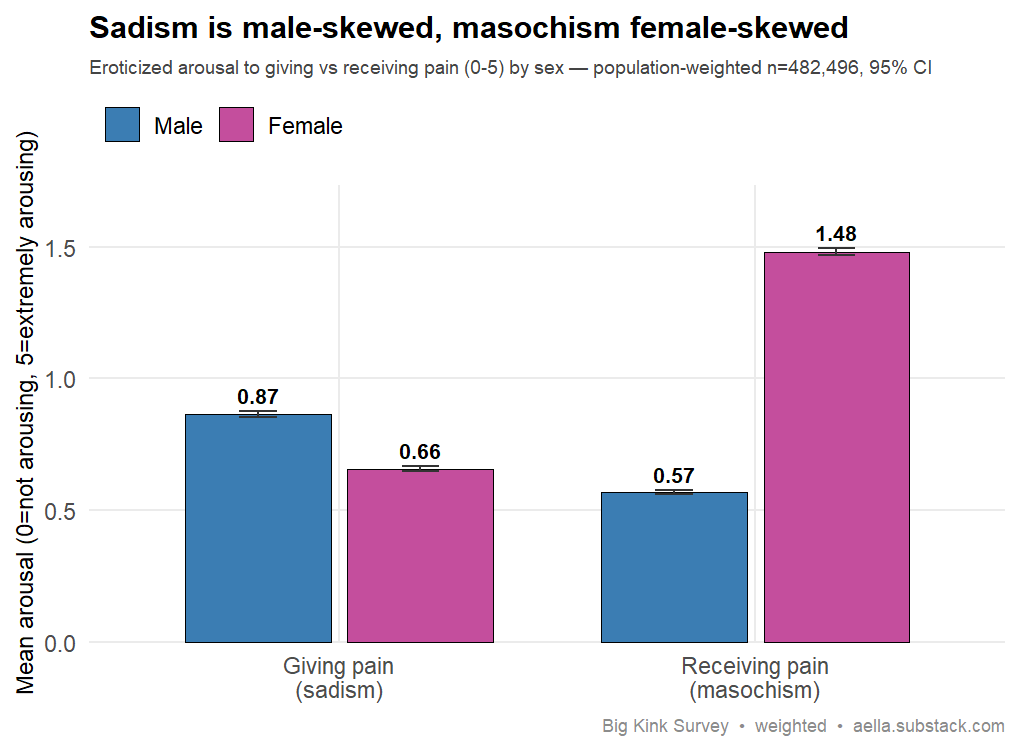
Your data: on eroticized arousal to receiving pain (masochism, 0-5 scale), women average 1.48 [95% CI 1.47-1.49] versus men's 0.57 [0.56-0.58] — well over double, d≈0.57. On giving pain (sadism, 0-5), men average 0.87 [0.85-0.88] versus women's 0.66 [0.65-0.67] — the predicted direction, though a more modest gap (d≈0.15; on the raw unweighted sample, ages 14-75, it thins to ~0.05 points). Population-weighted n=482,496. Each sex also leans the claimed way: men score higher on giving than receiving (0.87 vs 0.57), women higher on receiving than giving (1.48 vs 0.66). Respondents who did not report any sadomasochism interest (64% of the weighted sample) are counted as not-aroused (0) on both items; among those who did, the roles split sharply — men average 3.01 on giving vs women's 1.51, and women 3.41 on receiving vs men's 1.98. The women→masochism half is robust and the men→sadism half is real but weaker: replicates.
Survey question(s) asked
- “In erotic contexts, I find *giving* pain to others to be:” — Not arousing / Slightly arousing / Somewhat arousing / Moderately arousing / Very arousing / Extremely arousing
- “In erotic contexts, I find *receiving* pain to be:” — same six arousal options
- “Which category fits you best?” — Man (cis) / Man (trans) / Woman (cis) / Woman (trans) / Nonbinary/other (assigned male at birth) / Nonbinary/other (assigned female at birth); “men” and “women” here are birth sex (Male/Female) derived from this item
- Both pain questions were only asked of respondents who checked “Sadomasochism (spanking, needle play, clamps, torture, etc.)” on the fetish checklist and rated that category above “Not arousing”; everyone else is counted as 0 / “Not arousing”.
- The six arousal options carry raw survey values {0, 1, 2, 3, 5, 8} but are stored as ordinal 0–5 in the dataset; the means shown are computed on that 0–5 coding.
More psychiatric comorbidity
155. Self-reported OCD → body dysmorphia Replicates
The claim: OCD and body dysmorphic disorder strongly co-occur, with BDD sitting on the OCD spectrum.
Best: Phillips & Kaye (2007), CNS Spectrums 12(5):347–358, “The Relationship of Body Dysmorphic Disorder and Eating Disorders to Obsessive-Compulsive Disorder” — BDD is frequently comorbid with OCD and shares many features with it, consistent with placement on the OCD spectrum.
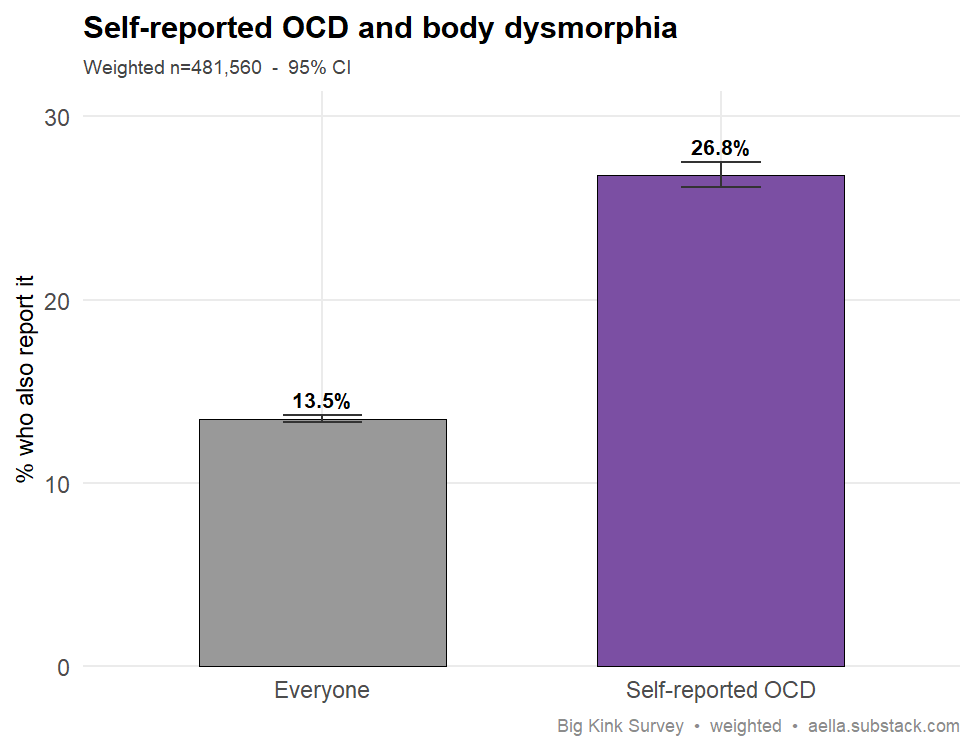
Your data: among respondents reporting no OCD, 12.2% (95% CI 12.0–12.4%) also report body dysmorphia; among those who self-report OCD, that jumps to 26.8% (95% CI 26.1–27.5%) — about 2.2x higher, with non-overlapping CIs (weighted n=481,560). Both items are self-report checkboxes flagged "only if moderate-to-severe," not clinical diagnoses, so read this as co-reported symptom burden rather than confirmed comorbidity. Still, the predicted OCD-BDD co-occurrence shows up cleanly and strongly.
Survey question(s) asked
- “Do you have any of the following” (checkbox list of 19 conditions; tip: “Please only check if they’re ‘moderate to severe’”) — ‘OCD’ checked vs not, and ‘Body Dysmorphia’ checked vs not
- Both are self-checked boxes on the same checklist — symptom self-reports, not clinical diagnoses.
156. ADHD → Depression Replicates
The claim: ADHD is comorbid with depression at elevated rates.
Best: Katzman et al. (2017), BMC Psychiatry — ADHD is strongly comorbid with mood disorders including depression. link
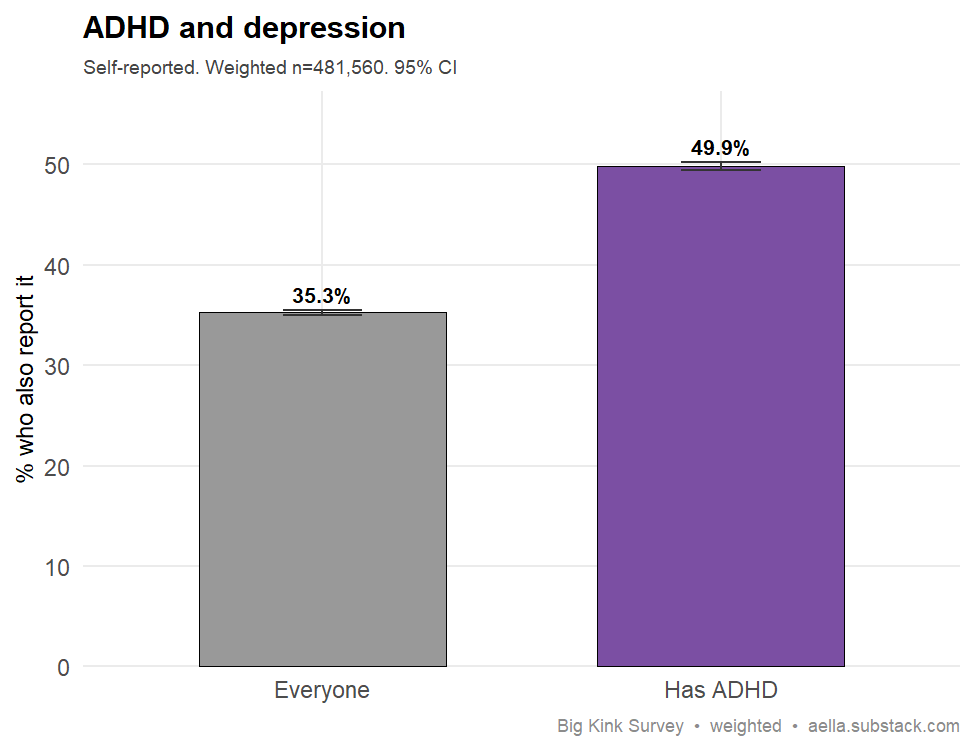
Your data: Among respondents who self-report ADHD, 49.9% also report moderate-to-severe depression (95% CI 49.5-50.3%), versus 27.8% of those without ADHD (95% CI 27.5-28.1%) — an overall sample rate of 35.3%. That's a 22-point gap, nearly doubling the depression rate. Weighted n=481,560. Both checklist items are self-reported "moderate to severe", not clinical diagnoses, but the comorbidity is large and unambiguous. Clear replication of the ADHD–depression link in the predicted direction.
Survey question(s) asked
- “Do you have any of the following” (checkbox list of 19 conditions; tip: “Please only check if they’re ‘moderate to severe’”) — ‘ADHD’ checked vs not, and ‘Depression’ checked vs not
- Both are self-checked boxes on the same checklist — symptom self-reports, not clinical diagnoses.
157. Autism → depression Replicates
The claim: Autistic people report markedly elevated rates of depression.
Best: Hudson, Hall & Harkness (2019), J. Abnormal Child Psychology 47(1):165–175 — meta-analysis finding autistic individuals are ~4× more likely to experience depression over their lifetime (self-report current prevalence 25.9%).
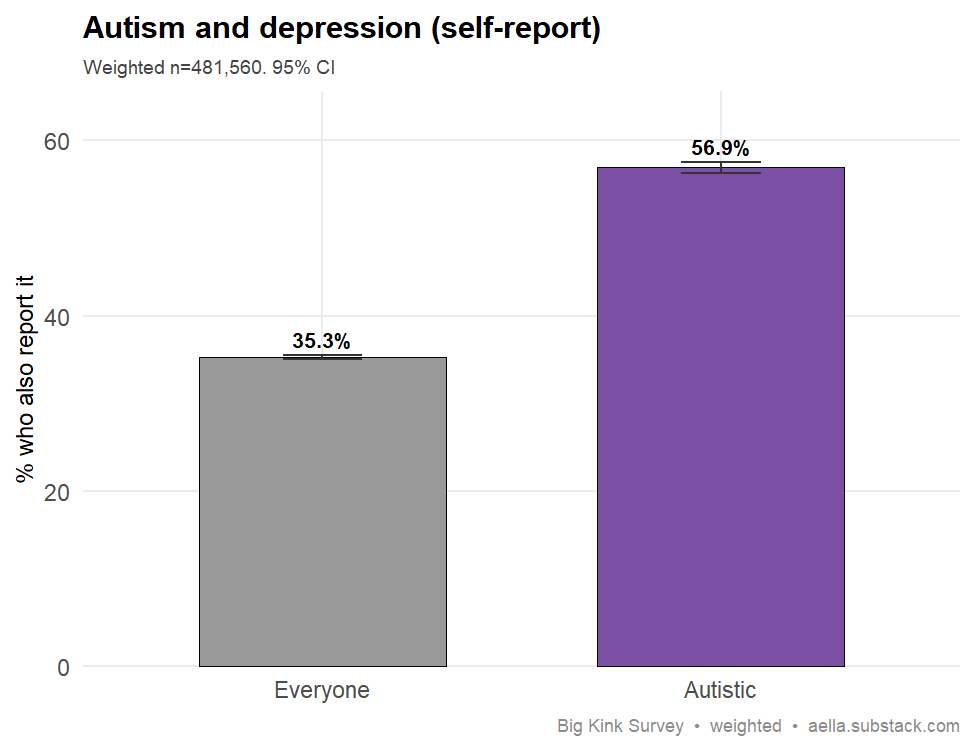
Your data: respondents who self-report autism are far more likely to also report depression — 56.9% (95% CI 56.3–57.6, weighted n=75,915 autistic) vs 32.9% of non-autistic respondents, a ~24-point gap (35.3% baseline overall). The gap survives a sex split and shows up in both: men 47.5% vs 23.3%, women 67.0% vs 42.8% (women have higher absolute depression, but the ~24pp autism penalty is roughly equal in each sex). Both are self-report checklist items ("moderate to severe"), not clinical diagnoses, but the elevation is large and robust. Clear replication of the meta-analytic finding.
Survey question(s) asked
- “Do you have any of the following” — checkbox list of 19 conditions (tip: “Please only check if they're 'moderate to severe'”); ‘Autism’ checked vs not defines the autism groups, ‘Depression’ checked vs not is the outcome
- Both are self-report checkbox items from the same list — respondents who didn't check a condition are counted as not having it. The survey never asks about formal diagnosis.
Childhood adversity → adult outcomes
158. Childhood verbal abuse → adult depression Replicates
The claim: Childhood emotional/verbal abuse uniquely predicts higher rates of adult depression.
Best: Mandelli, Petrelli & Serretti (2015), European Psychiatry — meta-analysis of childhood trauma and adult depression finds emotional abuse the maltreatment type most strongly associated with adult depression (OR=2.78, strongest of all types examined). link Backup: Spinhoven et al. (2010), J. Affective Disorders — in the NESDA cohort, childhood emotional maltreatment was specifically linked to depressive and anxiety disorders over and above other adversity types. link
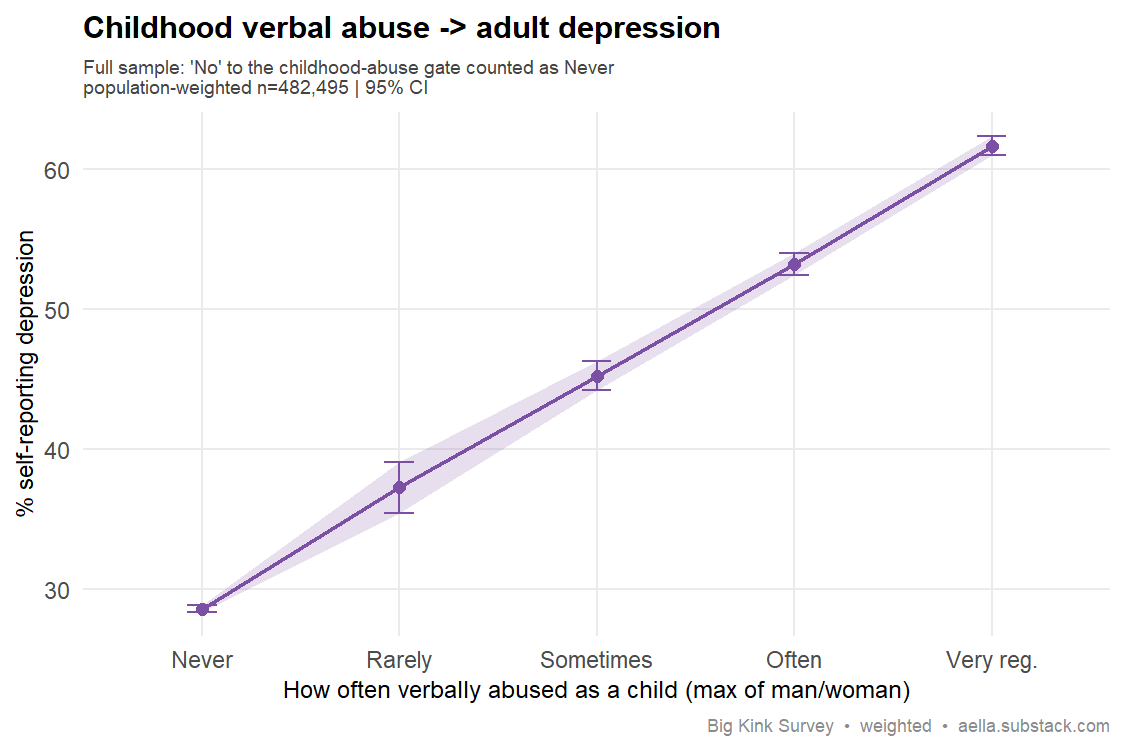
Your data: a clean, monotonic dose-response on the full sample. The frequency items were only shown to people answering Yes to "Were you (at least semiregularly) abused as a child?"; the ~73% who said No are counted here as Never. Self-reported depression climbs from 28.6% among those never verbally abused as children, to 37.3% (rarely), 45.2% (sometimes), 53.2% (often), and 61.7% (very regularly) — population-weighted n≈482,495, with tight non-overlapping 95% CIs at every step. The gradient holds in both sexes (men 21.2%→51.6%, women 37.8%→66.5%; women run higher throughout but the slope is the same) and survives age stratification — under-25s went 27.0%→61.3% and 25-34s went 30.6%→62.3%, so age does not explain it. (has_depression is a self-report checklist item, not a clinical diagnosis.) A textbook replication of the verbal-abuse → depression link.
Survey question(s) asked
- “Were you (at least semiregularly) abused as a child?” — No / Yes (tip: “'Abuse' means cruel treatment, such as significant neglect, insulting, or causing physical damage. This question does not include spanking”)
- “During your childhood, how often were you verbally abused by an adult man?” — Never / Rarely / Sometimes / Often / Very regularly (tip: “With 'verbal abuse' including things like insults, predictions you will fail in life, degrading you, etc.”)
- “During your childhood, how often were you verbally abused by an adult woman?” — same scale
- “Do you have any of the following” — checkbox (tip: only check if 'moderate to severe'); ‘Depression’ checked vs not
- The two verbal-abuse items were only asked of respondents who answered Yes to the abuse question above, so every point on the chart is among self-described abused respondents. The plotted abuse level is the higher of the adult-man and adult-woman answers.
159. Childhood physical abuse → BPD Replicates
The claim: Childhood physical abuse is a specific risk factor for borderline personality disorder.
Best: Porter et al. (2020), Acta Psychiatr. Scand. 141(1):6–20 — meta-analysis finding childhood adversity, including physical abuse, is strongly associated with borderline personality disorder (PMID 31630389). Backup: Zanarini et al. (1997), Am. J. Psychiatry 154(8):1101–6 — childhood abuse, including physical abuse, is markedly elevated in patients with BPD relative to other personality disorders (PMID 9247396).
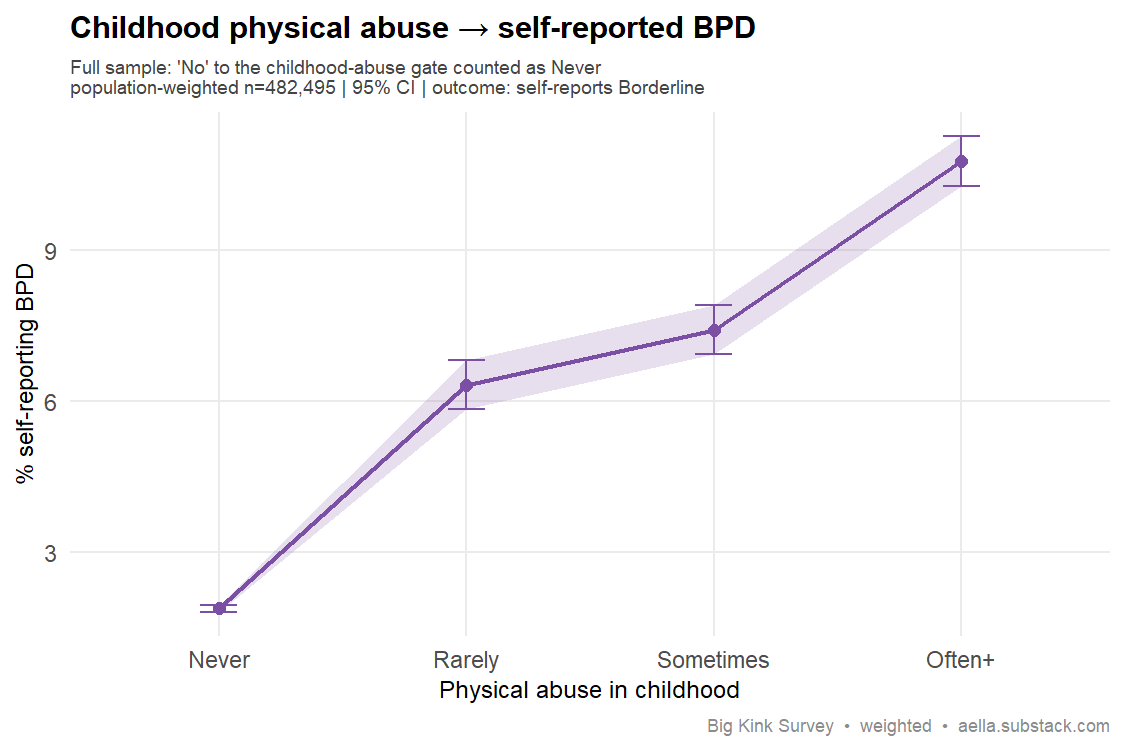
Your data: a clean dose-response on the full sample. The abuse-frequency items were only shown to people answering Yes to "Were you (at least semiregularly) abused as a child?"; the ~73% who said No are counted here as Never. Self-reported BPD rises monotonically with childhood physical abuse — Never 1.9%, Rarely 6.3%, Sometimes 7.4%, Often+ 10.8% (population-weighted n≈482,495). Any physical abuse vs none: 8.6% vs 1.9%. Within the Never bin, those reporting no childhood abuse of any kind sit at 1.6%, versus 4.5% for those abused in other ways but never physically — other abuse carries risk too, but the physical-abuse gradient stacks on top of it. The gradient survives controls: in a weighted logistic regression adjusting for sex and age, each step up the abuse scale raises the odds of self-reporting BPD by ~63% (OR 1.63, p≈0). It holds in both sexes (women Never 3.1% → Often+ 14.1%; men Never 0.8% → Often+ 5.6%), with women reporting BPD at two to four times the male rate at every level. A clear replication — note the outcome is self-reported "moderate-to-severe Borderline," not a clinical diagnosis.
Survey question(s) asked
- “Were you (at least semiregularly) abused as a child?” — No / Yes (tip: “'Abuse' means cruel treatment, such as significant neglect, insulting, or causing physical damage. This question does not include spanking”)
- “During your childhood, how often were you physically abused by a man?” — Never / Rarely / Sometimes / Often / Very regularly (tip: “Not including spankings”)
- “During your childhood, how often were you physically abused by a woman?” — same scale
- “Do you have any of the following” — checkbox (tip: only check if 'moderate to severe'); ‘Borderline’ checked vs not
- The two physical-abuse items were only asked of respondents who answered Yes to the abuse question above. The plotted abuse level is the higher of the man/woman answers, with ‘Often’ and ‘Very regularly’ combined into ‘Often+’.
160. Painful childhood spanking → adult arousal to receiving pain Replicates
The claim: More painful childhood corporal punishment is associated with greater adult eroticization of receiving pain.
Best: evidence here is suggestive rather than settled; see e.g. Labrecque, Potz, Larouche & Joyal (2020), The Journal of Sex Research 58(4) — practitioners of sexual masochism/submission describe instrumental learning, in which early painful or disciplinary experiences (e.g. being spanked) become eroticized, as one origin of adult interest in receiving pain (PDF). Note: a direct, quantitative childhood-spanking-severity → adult-masochism dose-response has not been firmly established.
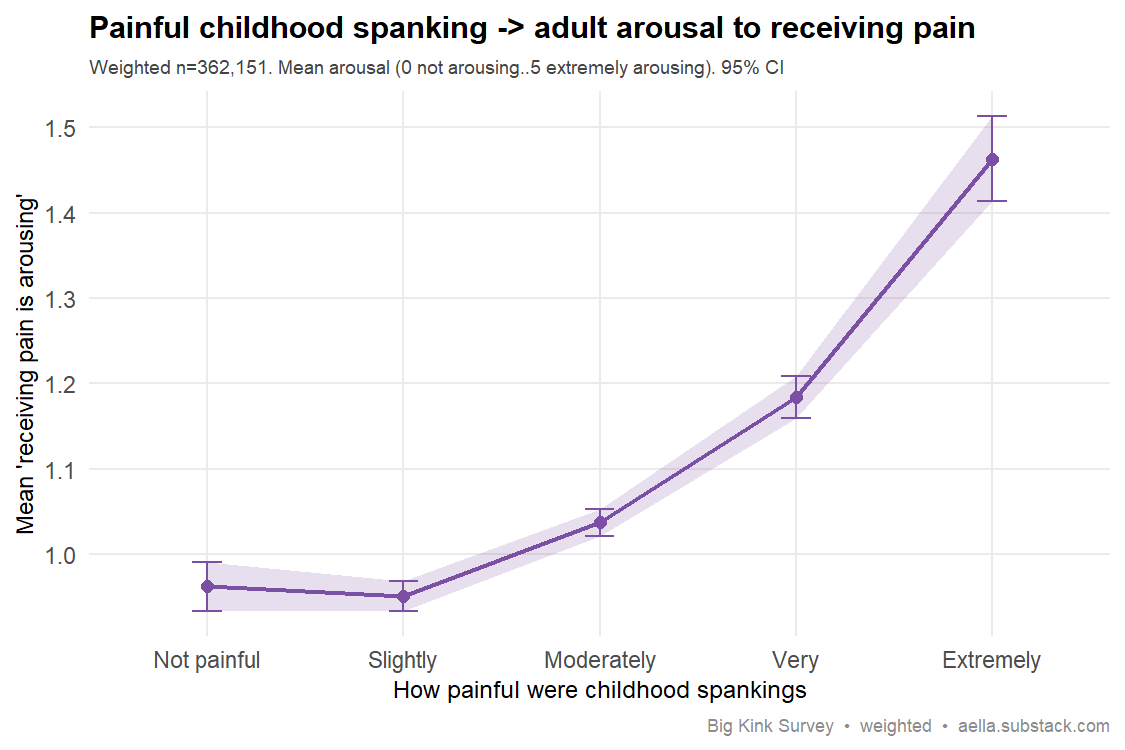
Your data: Among people who were spanked as kids, the more painful they recall those spankings being, the more they're aroused by receiving pain as adults — mean arousal (0 not arousing..5 extremely arousing) climbs from 0.96 for "not painful" and 0.95 "slightly," up through 1.04 "moderately," 1.18 "very," to 1.46 "extremely painful" (weighted n=362,151). The same gradient holds in both sexes (men 0.53→0.84, women 1.37→1.97) and inside every overall-kinkiness tertile, and the predictor stays significant in a weighted model controlling for sex and total fetish count (b=+0.057 per step, t=24, p<1e-128). Adding spanking frequency — the obvious competing exposure — attenuates severity to b=+0.022 per step (t=7.7), with frequency itself at b=+0.068, so pain severity keeps an independent, though smaller, effect. The effect is robust but modest: the lift really starts at "moderately painful" — the two lowest bins are essentially flat. A clear, confound-surviving dose-response — the claim replicates.
Survey question(s) asked
- “From the ages of 0-14, how often were you spanked as a form of discipline?” — Never / Rarely / Sometimes / Often / Very regularly (tip: “Spanking means striking the buttocks, with a hand or an implement such as a shoe or belt”)
- “Typically speaking, how painful were the spankings?” — Not painful / Slightly painful / Moderately painful / Very painful / Extremely painful (only asked of respondents who reported being spanked at all)
- “In erotic contexts, I find receiving pain to be:” — Not arousing / Slightly arousing / Somewhat arousing / Moderately arousing / Very arousing / Extremely arousing
- The receiving-pain item was only shown to respondents who checked “Sadomasochism (spanking, needle play, clamps, torture, etc.)” in the kink-category checklist and rated sadomasochism above ‘Not arousing’; everyone else is counted as 0 / 'no interest'. Arousal answers are recorded on a nonlinear raw scale (0, 1, 2, 3, 5, 8) and stored as ordinal 0–5 in the cleaned data.
More kink & sexual interests
161. Eroticized secretions → eroticized dirtiness Replicates
The claim: People who eroticize one disgust elicitor (bodily secretions) tend to also eroticize others (dirtiness/messiness), consistent with sexual arousal overriding disgust.
Best: On the underlying mechanism (sexual arousal can override disgust toward bodily secretions), see e.g. Borg & de Jong (2012), PLoS ONE 7(9):e44111 — experimentally induced sexual arousal weakened women's disgust and disgust-induced avoidance toward sex-related stimuli (saliva, sweat, semen and body odours are among the strongest disgust elicitors yet are involved in sex). link. Note: this demonstrates arousal dampening disgust rather than a direct correlation between eroticizing secretions and eroticizing dirtiness/messiness, which our own data illustrate.
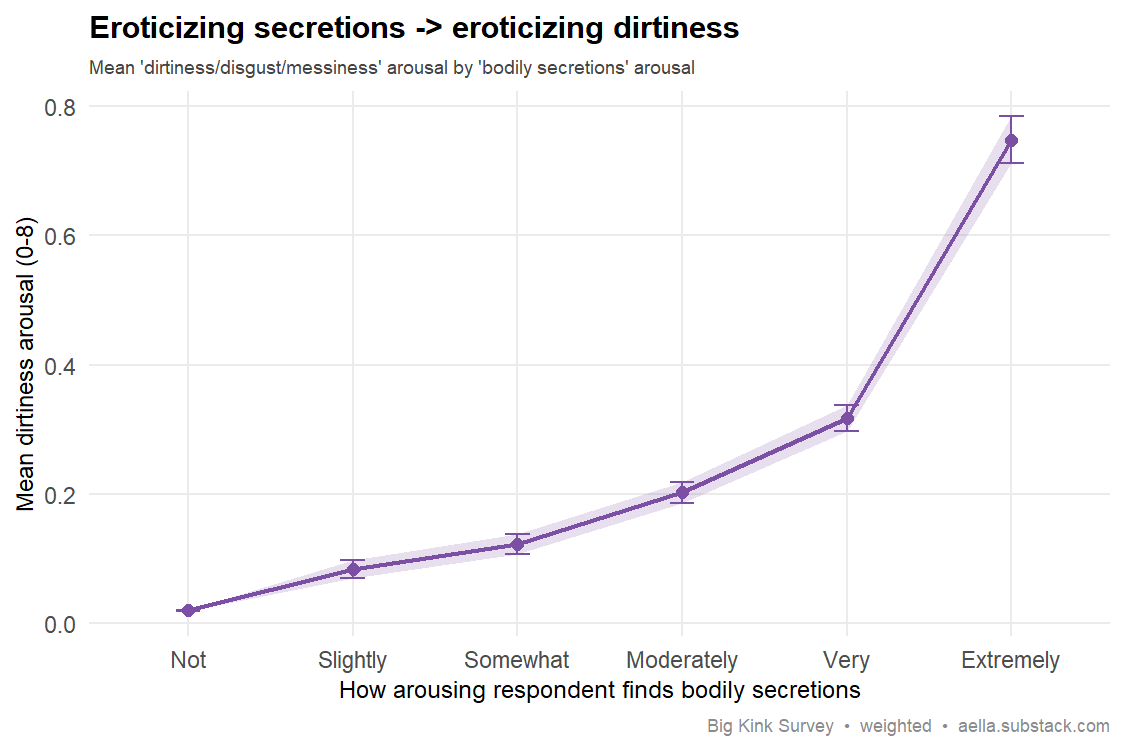
Your data: arousal to bodily secretions tracks arousal to dirtiness/disgust/messiness almost perfectly monotonically. Mean dirtiness arousal (0-5 eroticization scale) climbs from 0.02 among those who find secretions "Not" arousing, to 0.08 (Slightly), 0.12 (Somewhat), 0.20 (Moderately), 0.32 (Very), and 0.75 (Extremely) — a roughly 38-fold gradient. Weighted Pearson r = 0.27 (weighted n=482,496). The link survives controlling for overall kink breadth (the secretions slope shrinks from 0.10 to 0.063 but stays massively significant) and is present in both sexes (women r=0.23, men r=0.29). Replicates: eroticized disgust elicitors cluster together.
Survey question(s) asked
- “I find bodily secretions to be:” — Not arousing / Slightly arousing / Somewhat arousing / Moderately arousing / Very arousing / Extremely arousing (tip: “If you find one specific type of secretion to be erotic (for example, urine or farts), then answer with just that in mind, not the whole category.”)
- “I find dirtiness/disgust/messiness to be:” — same arousal scale (tip: “If you find one specific dirty scenario to be erotic (for example, being covered in trash), then answer with just that in mind, not the whole category.”)
- Each item was only shown to respondents who checked the matching category — “Bodily secretions (farts, squirt, urine, blood, etc.)” or “Dirtiness/disgust/messiness (cakesitting, STDs, soiling, etc.)” — in the “Uncommon things: Check all the following categories that contain a thing that arouses you” checklist; respondents who didn't check the category are counted as 0 / 'no interest'. Arousal answers use a nonlinear raw scale (0, 1, 2, 3, 5, 8) stored as ordinal 0–5.
162. Submission arousal → CGL (caregiver/little) interest Mixed
The claim: Caregiver/little (CGL/age-play) interest is a regressive-submissive kink that should rise with general submission arousal.
Best: Hawkinson & Zamboni (2014), Archives of Sexual Behavior 43(5):863–877 — in the adult baby/diaper-lover (age-play) community, both men and women rated being dominated as important, consistent with age-play as a submission-linked kink. doi:10.1007/s10508-013-0241-7 Backup: Tiidenberg & Paasonen (2019), Sexuality & Culture 23(2):375–393 — qualitative account of "littles"/age-play. (Note: Zamboni's data give little support for a stress-regulation function, so that framing is not well established.)
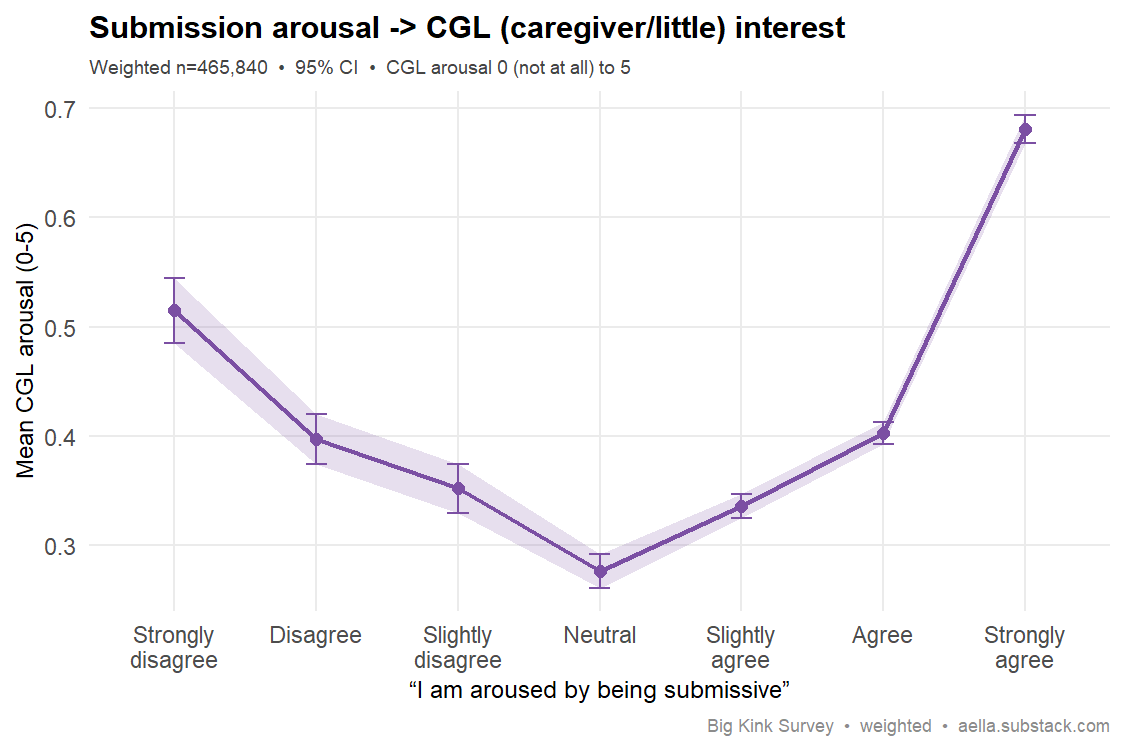
Your data: among the 465,840 (weighted) respondents who rated both, the predicted dose-response shows up clearly on the agreement side of "I am aroused by being submissive": mean CGL arousal (0–5 scale) climbs from 0.28 at Neutral to 0.34 (slightly agree) → 0.40 (agree) → 0.68 (strongly agree), all with tight non-overlapping 95% CIs. But the overall weighted correlation is only r=0.071 and the curve is U-shaped: the small "strongly disagree" group (n≈16k) is also elevated at 0.51, breaking monotonicity. The link is not driven by age — residualizing CGL on age leaves r unchanged (0.071) — and holds in both sexes, somewhat stronger in women (r=0.105) than men (r=0.053). Verdict: the submission→CGL gradient is real and survives controls among people who endorse submission, but it's weak overall and complicated by an elevated anti-submission minority, so this is a partial/mixed replication rather than a clean one.
Survey question(s) asked
- “I am aroused by being submissive in sexual interactions” — −3 Totally disagree … +3 Totally agree, 7-point
- “I find CGL (caregiver/little) dynamics to be:” — Not arousing / Slightly arousing / Somewhat arousing / Moderately arousing / Very arousing / Extremely arousing (tip: “A dynamic where a partner takes on a caregiver role towards their 'little', usually associated with age roleplay”)
- The CGL item sits behind two gates: it was only shown to respondents who checked “Age: nonstandard (age gaps, ageplay, unusual ages, etc.)” in the kink-category checklist and then rated the age-related category above ‘Not arousing’; everyone else is counted as 0 / 'no interest'. Arousal answers use a nonlinear raw scale (0, 1, 2, 3, 5, 8) stored as ordinal 0–5.
Body, BMI & orgasm
163. Higher BMI → lower sexual desire Reversed
The claim: Higher BMI is associated with reduced sexual desire (obesity linked to lower desire/function).
Best: Biernikiewicz, Rusiecka & Kałka (2025), J. Sexual Medicine 22(5):677–693 — systematic review & meta-analysis finding higher BMI/obesity is associated with lower sexual desire, with weight loss raising desire (PMID 40163679). Backup: Esposito et al. (2007), Int. J. Impotence Research 19:353–357 — higher BMI correlated with poorer female sexual function (arousal, lubrication, orgasm, satisfaction) (PMID 17287832).
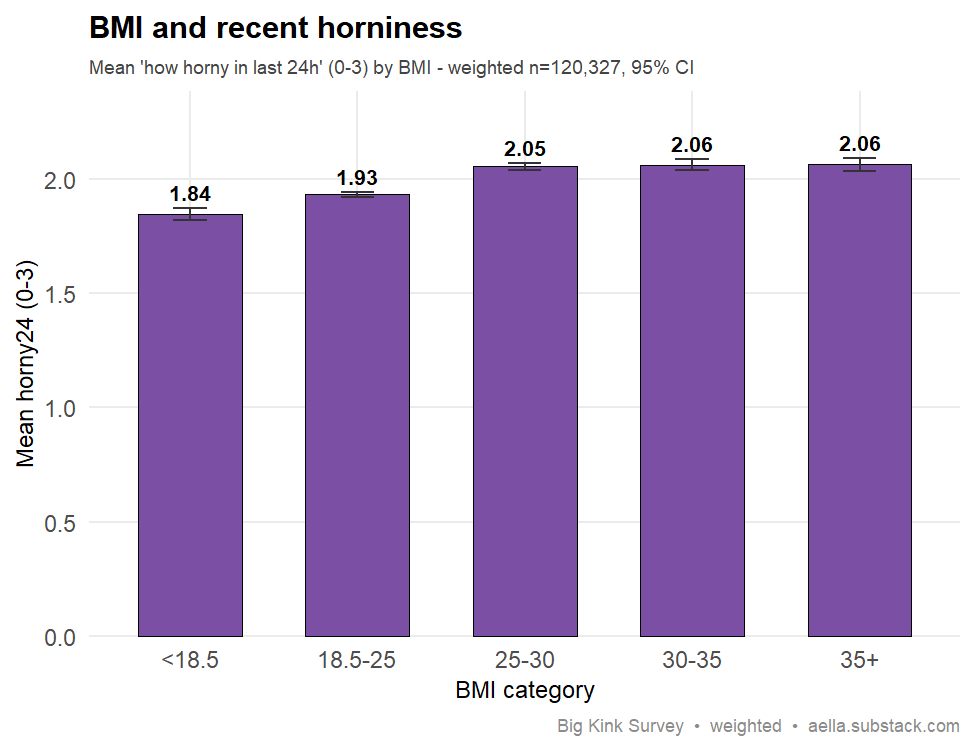
Your data: the direction is reversed. Mean recent horniness ("how horny in the last 24h," 0–3) rises with BMI rather than falling — 1.84 for underweight (<18.5), 1.93 for normal (18.5–25), 2.05 (25–30), 2.06 (30–35), and 2.06 for 35+ (weighted n=120,327). The weighted Pearson correlation is +0.06, the opposite sign of the predicted negative. Controlling for age and sex barely dents it (adjusted gradient 1.94 → 1.96 → 2.02 → 2.03 → 2.04), and both sexes show the same upward slope (men 1.91→2.16, women 1.78→1.99 across the BMI range). So in this sample higher BMI tracks slightly MORE self-reported recent horniness, not less. The classic obesity-lowers-desire finding does not appear here — if anything it's mildly reversed. (Caveat: horny24 is momentary horniness, not the broader sexual-function/desire constructs in the clinical literature.)
Survey question(s) asked
- “What's your height?” — bucketed options from <5'0" (<152cm) to 6'6+ (198cm), 1-inch steps
- “Your weight is closest to:” — bucketed options from <90lbs (<41kg) to >350lbs (>159kg), 20-lb steps
- “How horny have you been in the last 24 hours?” — Not horny at all / A little horny / Moderately horny / Real horny (scored 0–3)
- BMI is computed from the bucketed height and weight answers, not asked directly.
164. Vaginal-only orgasm → uncommon Replicates
The claim: Only a minority of women can reliably orgasm from vaginal penetration without clitoral stimulation.
Best: Herbenick, Fu, Arter, Sanders & Dodge (2018), J. Sex & Marital Therapy — in a U.S. probability sample (n=1,055), only 18.4% of women said intercourse alone was sufficient for orgasm, while most reported needing or preferring clitoral stimulation during intercourse.
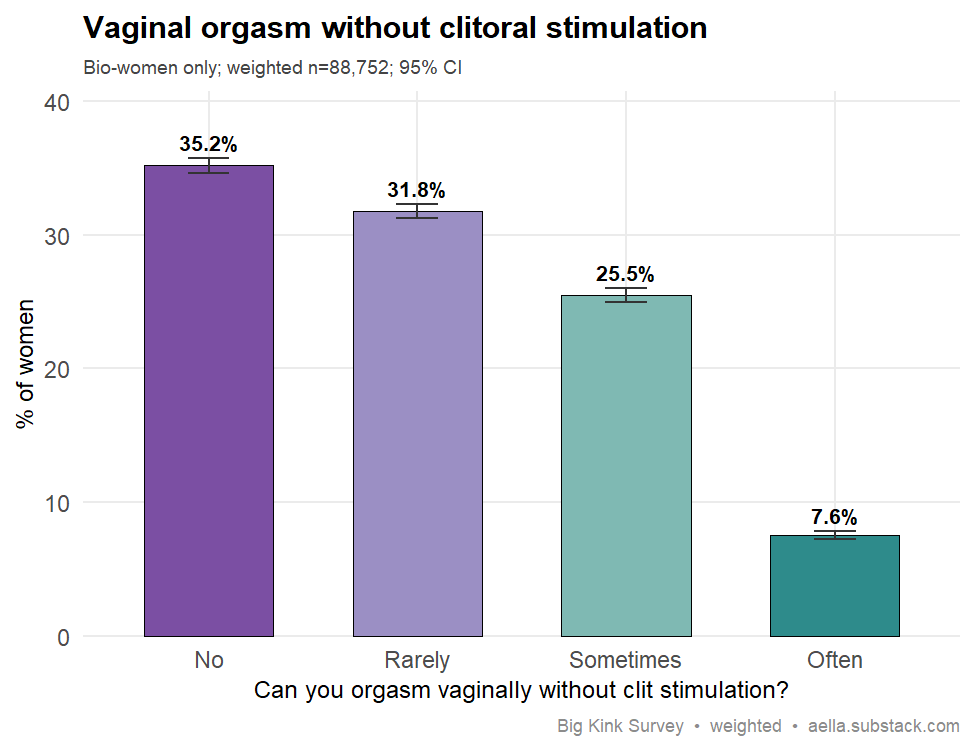
Your data: among bio-women (weighted n=88,752; raw n=108,298), asked "Can you have vaginal orgasms without clitoral stimulation?", 35.2% say No and 31.8% Rarely/with great effort — a combined 67.0% who can't reliably. Only 25.5% say Sometimes and just 7.6% Often/with low effort. So only about a third can do it at all reliably, and fewer than 1 in 13 do so easily. The base rate lands squarely in the predicted direction: vaginal-only orgasm is the minority experience.
Survey question(s) asked
- “Can you have vaginal orgasms without clitoral stimulation?” — No / Rarely/with great effort / Yes, sometimes/with medium effort / Yes, often/with low effort
- Only asked of respondents whose birth sex is female.
Attachment & leaving
165. Avoidant attachment → prefers porn to partnered sex Replicates
The claim: Attachment avoidance predicts a more solitary sexuality — preferring pornography over partnered intimacy — relative to secure attachment.
Best: Szymanski & Stewart-Richardson (2014), The Journal of Men's Studies 22(1), 64–82, doi:10.3149/jms.2201.64 — in young adult heterosexual men, pornography use was associated with more avoidant (and anxious) attachment, with avoidant individuals less sexually intimate with partners and using pornography as a low-intimacy outlet; cf. the Brennan & Shaver attachment framework.
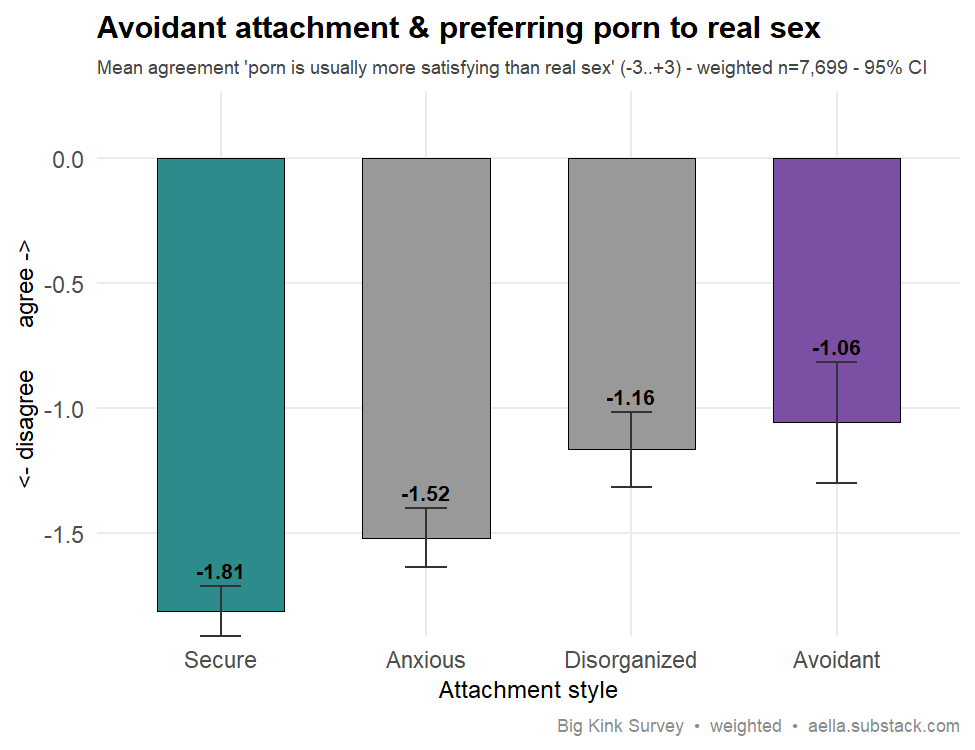
Your data: a clean monotonic gradient in the predicted direction. On "porn is usually more satisfying than real sex" (-3 strongly disagree to +3 strongly agree), Secure respondents sit lowest at -1.81 [-1.91, -1.71], rising through Anxious -1.52 and Disorganized -1.16 to Avoidant highest at -1.06 [-1.30, -0.82] (weighted n=7,699). The Secure-vs-Avoidant gap (~0.76 points) has non-overlapping 95% CIs. The effect survives controlling for age and sex — residualizing on factor(age) + sex preserves the ordering (Secure -0.24 vs Avoidant +0.40, CIs still non-overlapping) — and holds in both sexes (women: Secure -1.71 vs Avoidant -0.76; men: Secure -1.85 vs Avoidant -1.30). Two honest caveats: every group's mean is negative, so even avoidant people on average lean toward disagreeing that porn beats real sex — this is a relative shift, not an absolute preference; and the outcome was only asked of a subset (most rows are missing), so this rests on ~7,700 answerers rather than the full sample. Within those limits, avoidant attachment clearly tracks a stronger lean toward solitary porn over partnered sex. Replicates.
Survey question(s) asked
- “What's your attachment style?” — Don't know/not sure / Avoidant (avoidant/distant/commitment fears) / Anxious (codependent/clingy/abandonment fears) / Disorganized (mix of Avoidant and Anxious) / Secure (comfortable with intimacy) (tip: “Attachment style is the way you typically relate to relationships, usually romantic”)
- “Pornography/erotic content is usually more satisfying than sex with a real person” — Haven't had sex/NA, then Strongly agree +3 … Strongly disagree −3, 7-point
- Attachment style is a single self-labeled pick, not a validated attachment scale. “Haven't had sex/NA” answers are excluded, and the porn item was added to the survey in May 2026, which is why only ~7,700 respondents have both answers.
166. Anxious attachment → reluctant to leave Replicates
The claim: Attachment anxiety predicts reluctance to leave relationships, reflecting fear of abandonment.
Best: Slotter & Finkel (2009), Personality and Social Psychology Bulletin 35(1):85–100 — highly anxiously attached individuals sustain commitment and persist in relationships even when their needs go unmet, i.e. are reluctant to leave (PubMed).
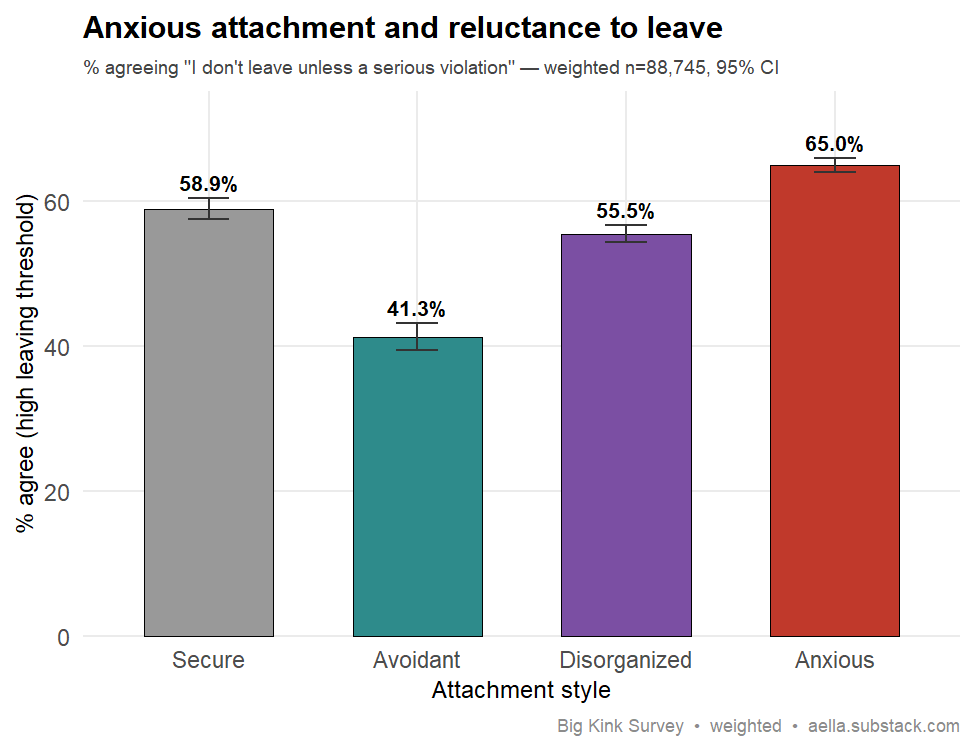
Your data: 65.0% of anxiously-attached respondents agreed "I usually don't leave romantic relationships unless there's a very serious violation" (95% CI 64.0–65.9), the highest of any style — vs 58.9% secure, 55.5% disorganized, and just 41.3% avoidant (39.4–43.1). Overall agreement was 58.4% (weighted n=88,745). The anxious-high / avoidant-low gradient is exactly as predicted and survives age control (age-adjusted GLM vs secure: anxious +0.26 logit, p≈3e-45; avoidant −0.72, p≈4e-167). Note: this item was only asked of female respondents, so the result is female-only and no sex-split is possible. Within that caveat, the data cleanly replicate Slotter & Finkel — anxious attachment tracks the highest leaving threshold (most reluctant to leave), avoidant the lowest.
Survey question(s) asked
- “What's your attachment style?” — Don't know/not sure / Avoidant (avoidant/distant/commitment fears) / Anxious (codependent/clingy/abandonment fears) / Disorganized (mix of Avoidant and Anxious) / Secure (comfortable with intimacy) (tip: “Attachment style is the way you typically relate to relationships, usually romantic”)
- “I usually don't leave romantic relationships unless there's a very serious violation” — I haven't had a relationship end / Strongly disagree / Disagree / Neutral / Agree / Strongly agree
- The leaving item was only asked of respondents whose birth sex is female. “Agreed” combines Agree and Strongly agree, and “I haven't had a relationship end” answers are excluded. Attachment style is a single self-labeled pick, not a validated scale.
Orientation, identity & belief
167. Orientation → femininity preference (women) Replicates
The claim: Among women, sexual orientation shifts partner-presentation preference along the masculine-feminine axis, with gynephilic (lesbian) women preferring more feminine partners than straight women.
Best: Zhang (2022), Archives of Sexual Behavior 51(7):3485–3495 — gynephilic (lesbian/bisexual) women prefer feminized faces, voice, and personality traits, mirroring heterosexual men's preferences. link
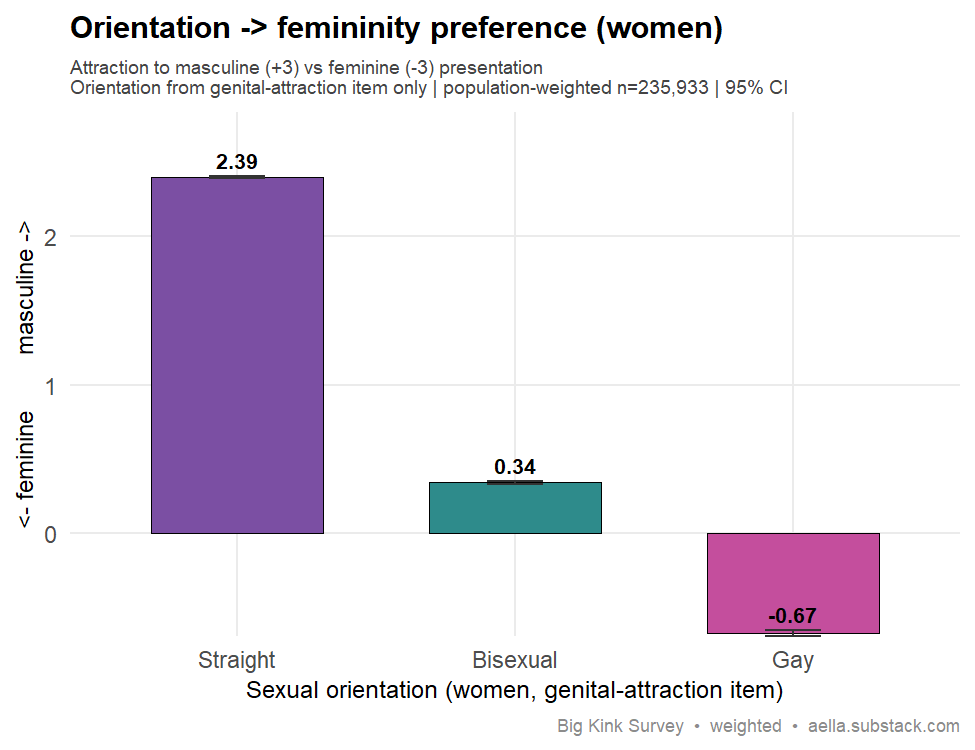
Your data: restricting to women and classifying orientation by the genital-attraction item alone — the site's composite orientation folds in the masc/fem-preference item itself, so using it here would be circular — mean attraction to masculine (+3) vs feminine (-3) presentation drops sharply across orientation: straight women +2.39 [2.39, 2.40] (raw n=179,413), bisexual women +0.34 [0.33, 0.35] (n=70,029), lesbians -0.67 [-0.69, -0.65] (n=30,303); population-weighted n=235,933. A clean, monotonic gynephilia gradient: straight women strongly prefer masculine partners, bi women sit just masculine of neutral, and lesbians clearly prefer feminine partners. Replicates Zhang (2022) — orientation tracks the masc/fem presentation preference in the predicted direction.
Survey question(s) asked
- “You're more sexually attracted to people who appear visually” — Totally masculine +3 / Somewhat masculine / Slightly masculine / Equally masculine and feminine 0 / Slightly feminine / Somewhat feminine / Totally feminine −3
- “You're sexually attracted to people with___” — Penises, exclusively / Penises, mostly / Penises, slightly / Both equally / Vaginas, slightly / Vaginas, mostly / Vaginas, exclusively
- Straight/Bisexual/Gay here are derived from these two attraction items relative to birth sex — the two are averaged into a composite and cut into bands — not a self-identification question. Note that the outcome plotted (masculine/feminine attraction) is also one of the two items used to build the orientation groups.
168. Bisexual attraction → mixed-gender ('Both') partnering Replicates
The claim: Bisexual orientation predicts partnering across genders — behavior tracks attraction, with bisexuals far more likely to be partnered with 'both' a man and a woman than straight or gay respondents.
Best: see Copen, Chandra & Febo-Vazquez (2016), National Health Statistics Reports No. 88 (NSFG) — bisexual-identified adults report partners of more than one sex at far higher rates than heterosexual or gay/lesbian respondents. link
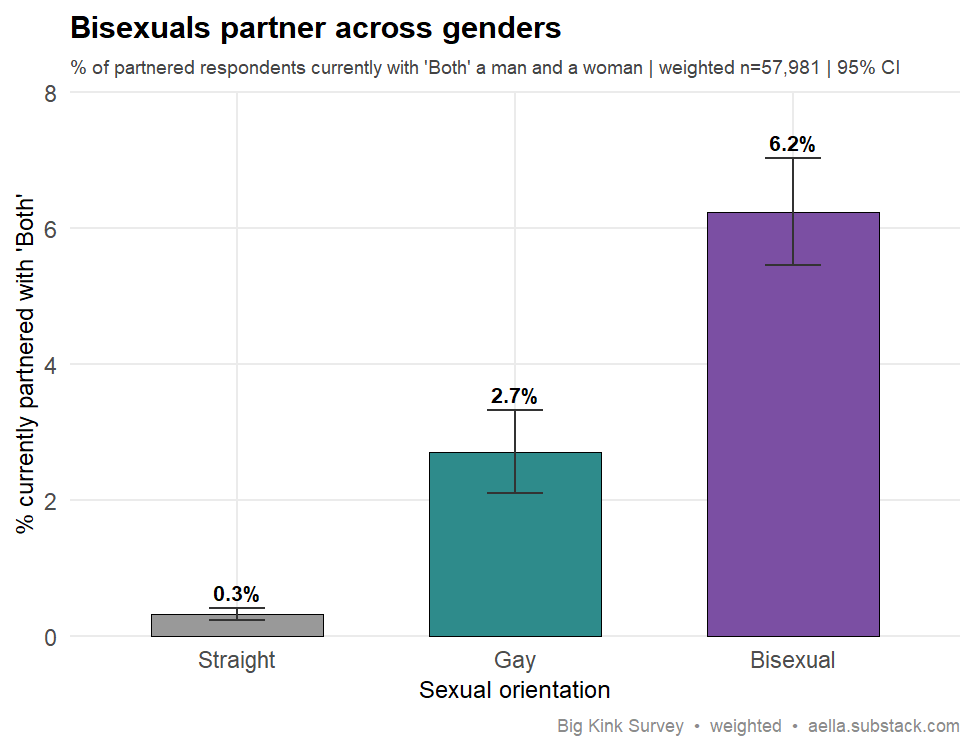
Your data: Among partnered respondents, 6.2% of bisexuals report currently being with 'both' a man and a woman, vs 2.7% of gay and just 0.33% of straight respondents (weighted n=57,981) — a clean monotonic gradient with non-overlapping 95% CIs. The effect survives the sex split: bisexual women 5.6% vs gay 2.9% vs straight 0.4%, and bisexual men 8.2% vs gay 2.4% vs straight 0.3%. Bisexual identity predicts mixed-gender partnering roughly 19x the straight rate, robustly across sexes. Clear replication of the pattern: partnering behavior tracks bisexuality. One construct note — BKS has no orientation self-ID item, so 'Bisexual' here means mid-range on the attraction composite; this tests attraction-based rather than identity-based bisexuality (the NSFG benchmark used self-ID). The partner-gender question was also added late in fielding, so the sample is the recent slice of respondents.
Survey question(s) asked
- “You're currently in a relationship with:” — A man / A woman / Both / Other
- “You're sexually attracted to people with___” — Penises, exclusively … Both equally … Vaginas, exclusively (7 options)
- “You're more sexually attracted to people who appear visually” — Totally masculine +3 … Totally feminine −3
- The partner question was only asked of respondents currently in a relationship, and was added to the survey in August 2025, so it covers recent respondents only; “Other” answers are excluded. Straight/Bisexual/Gay are derived from the two attraction items relative to birth sex — the survey never asks orientation identity directly.
169. Openness → supernatural belief Not seen
The claim: Openness to experience predicts greater belief in the supernatural/paranormal.
Best: Smith, Johnson & Hathaway (2009), Individual Differences Research 7(2), 85–96 — all six Openness-to-Experience facets correlated positively with paranormal belief, with Fantasy the strongest predictor.
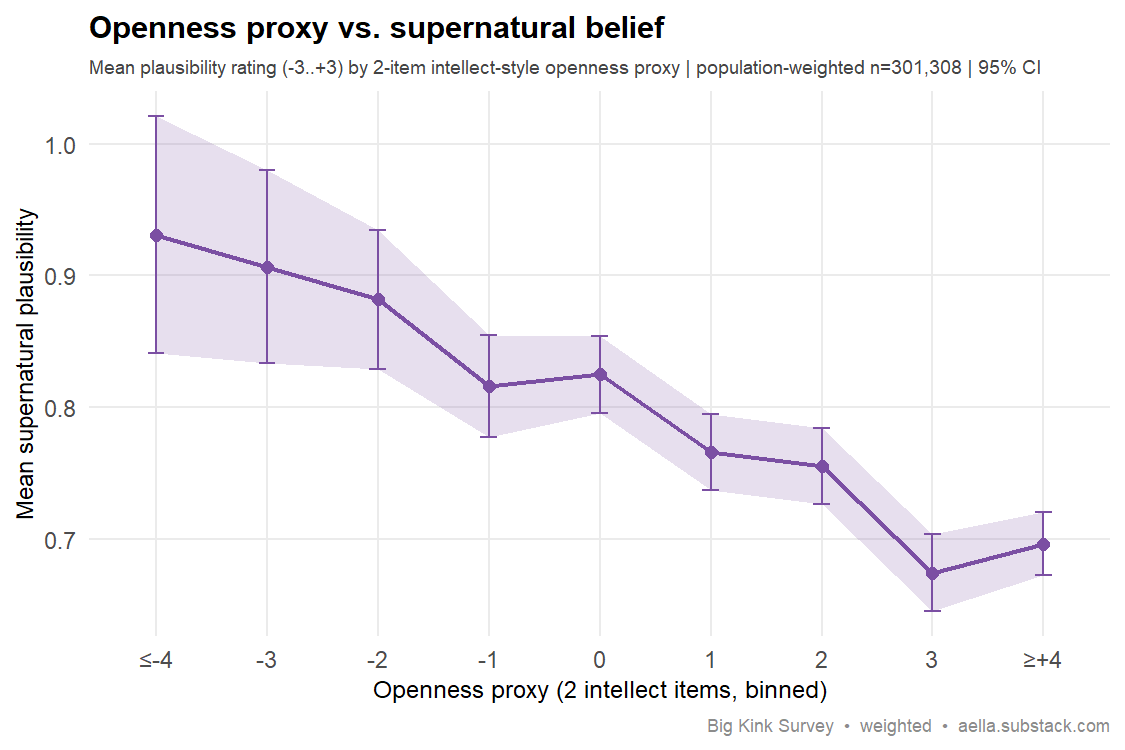
Your data: the predicted link is not seen — and the BKS measure can only half-test it. The openness score here is a two-item intellect proxy ("I have excellent ideas" minus "I have difficulty understanding abstract ideas") with none of the Fantasy, Aesthetics or Feelings facets, and the cited study found Fantasy the strongest paranormal-belief predictor. On this proxy, agreement with "I find the existence of the supernatural to be plausible" (-3..+3) correlates at just r=-0.03 (weighted n=301,308; age-residualized r=-0.03), below the page's threshold for a real effect, and the within-sex correlations straddle zero (women r=+0.02, men r=-0.02) — so the mild downward drift across bins (0.93 at the lowest openness to 0.70 at the highest, a gap of -0.23) is partly sex composition. The textbook Openness→paranormal-belief correlation is not seen here, with the caveat that an intellect-only proxy cannot rule out the Fantasy-facet effect the literature reports.
Survey question(s) asked
- “I have excellent ideas” — −3 Totally disagree … +3 Totally agree, 7-point
- “I have difficulty understanding abstract ideas” — same scale
- “I find the existence of the supernatural to be plausible” — same scale (tip: “e.g., ghosts, multi-dimensional beings, energy healing, astrology, etc.”)
- The “openness” score is the first item minus the second — a two-item intellect-style proxy running −6 to +6 — not a full Big-Five Openness scale.
Sex drive, dating & partner count
170. Sex motivation → more partners Replicates
The claim: Higher motivation to pursue real-life sexual encounters predicts more lifetime sexual partners.
Best: Kalichman & Rompa (1995), J. Personality Assessment 65(3):586–601, PMID 8609589 — the Sexual Sensation Seeking Scale corresponds to a greater number of sexual partners in both men and women.
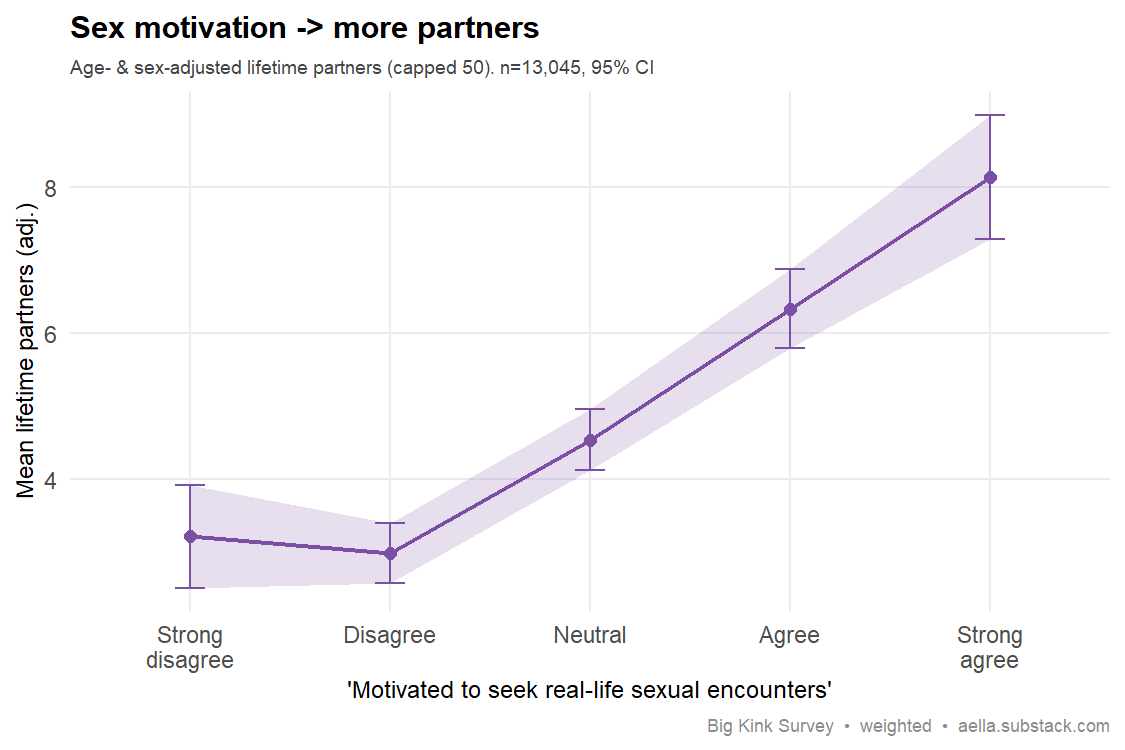
Your data: lifetime partners (capped at 50) climb steadily with self-reported sexual motivation. Age- and sex-adjusted means rise from 3.2 partners at "strongly disagree" to 4.5 at "neutral" to 8.1 at "strongly agree" — roughly +1.5 partners per step up the 5-point scale (adjusted slope +1.46, p<1e-100). Controlling for age and sex barely dents the effect (unadjusted slope +1.65), and it holds in both sexes (women +1.3, men +1.5 per step). Weighted n≈4,200 (13,045 respondents). The motivation-to-partners link replicates cleanly and is not an age or sex artifact. Note this is self-reported, correlational and cross-sectional — motivation and partner count are measured at the same moment, so it cannot show that drive causes the partners (or vice versa).
Survey question(s) asked
- “I am very motivated to seek out real-life sexual encounters” — Strong disagree (−2) / Disagree (−1) / Neutral (0) / Agree (+1) / Strong agree (+2)
- “How many people have you had sex with?” (tip: “By your definition of 'sex' - this typically means penetration, and sometimes includes oral sex.”) — free-entry number
- Partner counts are capped at 50 in this analysis. Age and sex (from the survey's demographics items) were used as statistical controls.
171. Bad at dating → fewer partners Replicates
The claim: Poorer self-perceived dating/courtship competence predicts fewer lifetime sexual partners.
Best: The courtship-competence → mating-success direction is illustrated by mate-attraction research such as Back, Penke, Schmukle, Sachse, Borkenau & Asendorpf (2011), European Journal of Personality, 25(2), 120–132, where observed flirting/courtship behavior predicted real-life speed-dating mate choices. Backup: For self-perceived dating success specifically as it relates to actual partner counts, see e.g. sociosexuality work such as Penke & Asendorpf (2008), Journal of Personality and Social Psychology, 95(5), 1113–1135. Treat as illustrative; the speed-dating measures here are mate choice, not lifetime partner totals.
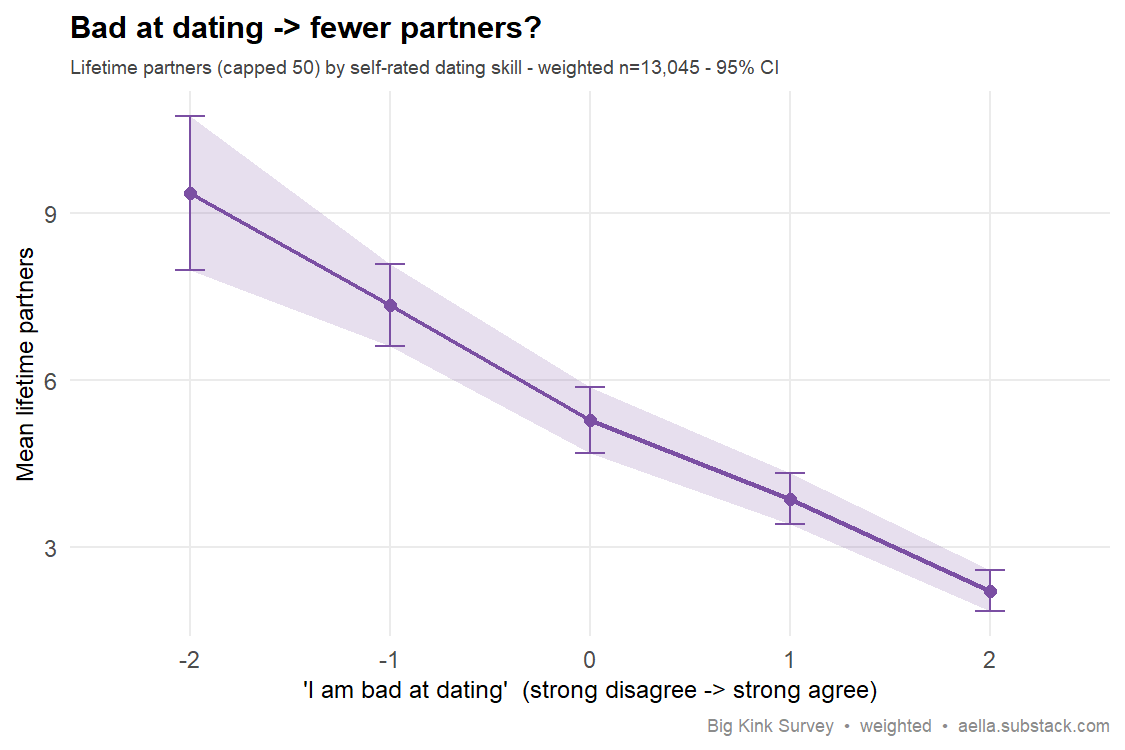
Your data: lifetime partners (capped at 50) fall steadily as self-rated dating skill drops. People who strongly disagree they're "bad at dating" average 9.4 partners; this declines monotonically through 7.4, 5.3, 3.9, down to 2.2 for those who strongly agree they're bad at dating — a roughly 4x gradient (weighted n=13,045). Controlling for age and sex, each step up the "bad at dating" scale costs about 1.6 partners (p<1e-100), and the gradient survives fully residualizing partner count on age. It holds in both sexes, steeply in men (11.9 → 1.8) and more gently in women (peak ~6.6 at mild disagreement, down to 3.0). Clear replication of the courtship-competence → mating-success link, though this is self-reported, correlational, and cross-sectional — low dating confidence and few partners likely reinforce each other rather than one simply causing the other.
Survey question(s) asked
- “I am bad at dating (asking people out, going on dates)” (tip: “Or 'would be bad' at dating if not currently trying to date”) — Strong disagree (−2) / Disagree (−1) / Neutral (0) / Agree (+1) / Strong agree (+2)
- “How many people have you had sex with?” (tip: “By your definition of 'sex' - this typically means penetration, and sometimes includes oral sex.”) — free-entry number
- Partner counts are capped at 50 in this analysis. Age and sex were used as statistical controls.
172. Higher sex drive → more partners Replicates
The claim: Higher trait sexual desire predicts more lifetime sexual partners, especially in men.
Best: see e.g. Ostovich & Sabini (2004), Personality and Social Psychology Bulletin 30(10):1255–1266 — sex drive is positively correlated with lifetime number of sexual partners (though when sociosexual orientation is also controlled, sociosexuality is the stronger independent predictor). Illustrative of the bivariate sex-drive/partner-count association rather than a clean within-sex effect.
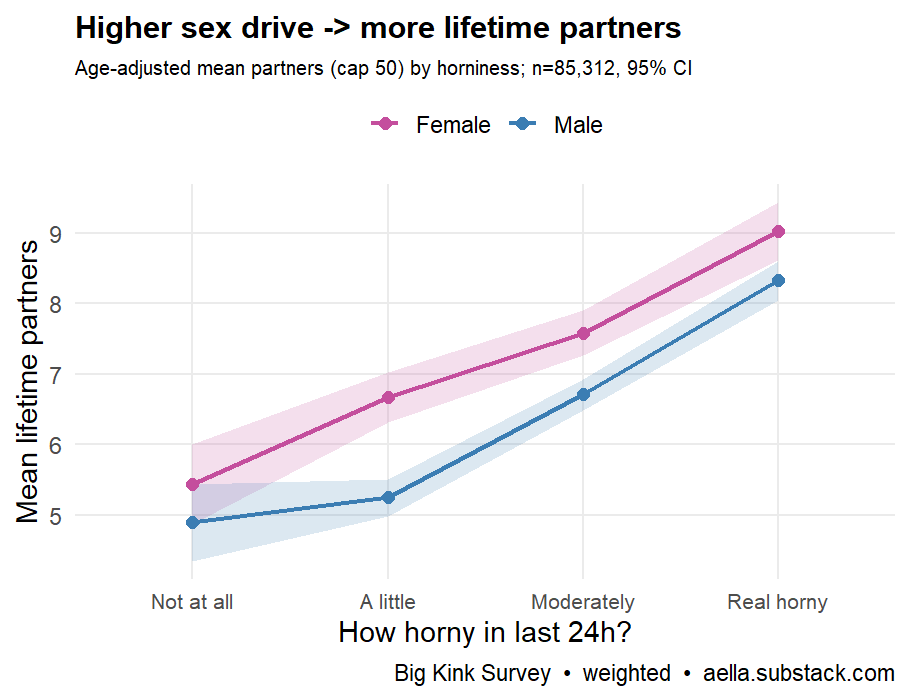
Your data: a clean dose-response. Among people who reported being "not at all" horny in the last 24h, age-adjusted mean lifetime partners (capped at 50) was 4.9 for men and 5.4 for women; this climbs monotonically through "a little" and "moderately" to 8.3 (men) and 9.0 (women) among the "real horny" group — non-overlapping 95% CIs across the whole range. In an age-controlled weighted regression each step up the 4-point horniness scale adds about +1.25 partners overall (+1.45 men, +1.18 women, both p<1e-100), so the gradient is slightly steeper in men, matching Lippa. Weighted n=85,312. Replicates — though this is a same-day mood item used as a proxy for trait desire, and the data are cross-sectional and self-reported, so reverse/shared causation can't be excluded.
Survey question(s) asked
- “How horny have you been in the last 24 hours?” — Not horny at all (0) / A little horny (1) / Moderately horny (2) / Real horny (3)
- “How many people have you had sex with?” (tip: “By your definition of 'sex' - this typically means penetration, and sometimes includes oral sex.”) — free-entry number
- Partner counts are capped at 50 in this analysis; age was used as a statistical control. Note the horniness item asks about the last 24 hours (a state measure) and is used here as a proxy for trait sex drive.
Personality & sexual style
173. Need for control → dominance arousal Replicates
The claim: Dispositional need for control/power predicts preference for the dominant sexual role.
Best: Jansen, Fried & Chamberlain (2021), Journal of Sexual Medicine 18(3):549-555 — BDSM practitioners who identify as dominant score significantly higher on trait/interpersonal dominance (PAI Dominance scale) than switches, who in turn score higher than submissives, supporting that dispositional need for control predicts preference for the dominant sexual role. link
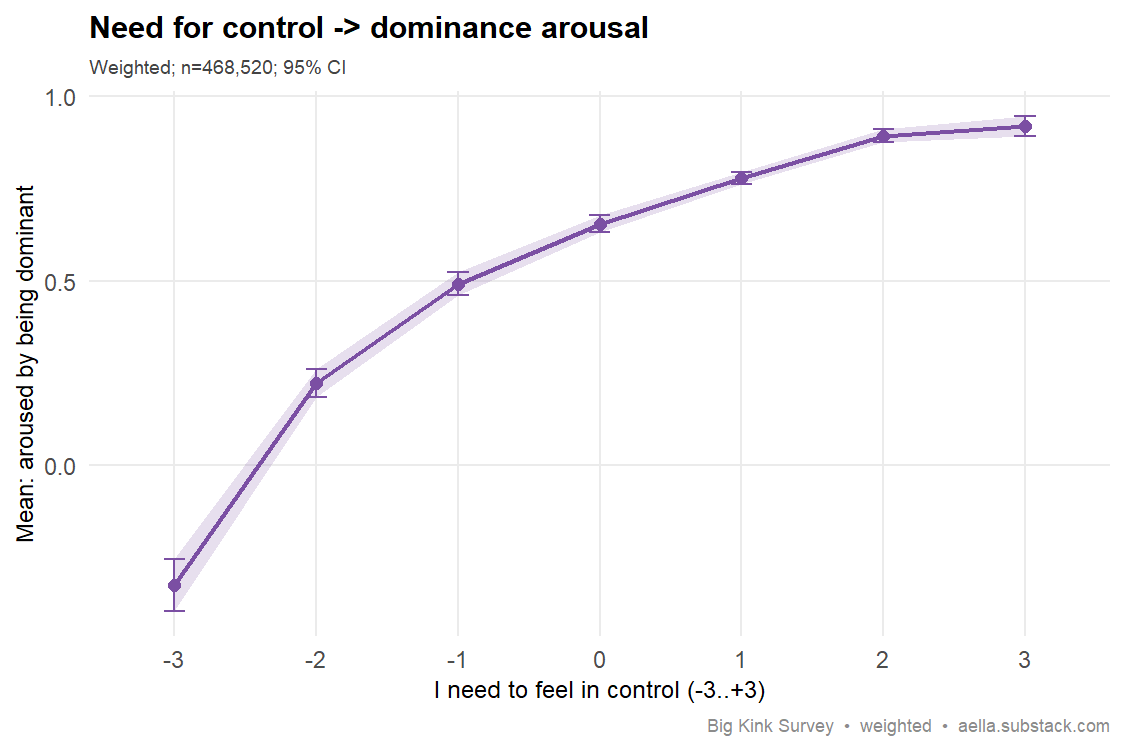
Your data: "I need to feel in control" tracks dominance arousal in a clean, monotonic gradient. Mean agreement with "aroused by being dominant" climbs from -0.33 among those who reject needing control (incontrol=-3) to +0.66 at the midpoint and +0.92 among those who strongly need control (+3) — on a -3..+3 scale. Weighted r = 0.12 overall (effective weighted n ≈ 155k; complete-case n = 468,520). The effect holds within each sex and is noticeably stronger in men (r = 0.23) than women (r = 0.16), so it is not a sex artifact. Residualizing dominance arousal on narcissism and agreeableness leaves the association essentially unchanged (partial r = 0.13), so it is not just narcissism. Replicates: dispositional need for control predicts dominance arousal. Correlational and cross-sectional — self-reported trait and self-reported arousal, no causal claim.
Survey question(s) asked
- “I need to feel in control” — −3 Totally disagree … +3 Totally agree, 7-point agreement scale
- “I am aroused by being dominant in sexual interactions” — −3 Totally disagree … +3 Totally agree, 7-point
- “To what extent do you agree with this statement: I am a narcissist.” (tip: “The word 'narcissist' means egotistical, self-focused, and vain.”) — −3 Totally disagree … +3 Totally agree, 7-point
- “I sympathize with others' feelings” / “I feel little concern for others” — each −3 Totally disagree … +3 Totally agree, 7-point
- The narcissism item and the agreeableness composite (“sympathize” item minus “little concern” item) were used only as statistical controls for the robustness check, not as the headline variables.
174. Low agreeableness → dominance arousal Confounded
The claim: Lower agreeableness is associated with more dominance-oriented sexuality.
Best: see e.g. Allen & Walter (2018), Psychological Bulletin — meta-analysis finding lower agreeableness relates to more sexually aggressive/dominance-oriented behavior (r = −.20). link Backup: Wismeijer & van Assen (2013), Journal of Sexual Medicine — BDSM practitioners score lower on agreeableness, most so in dominant roles. link
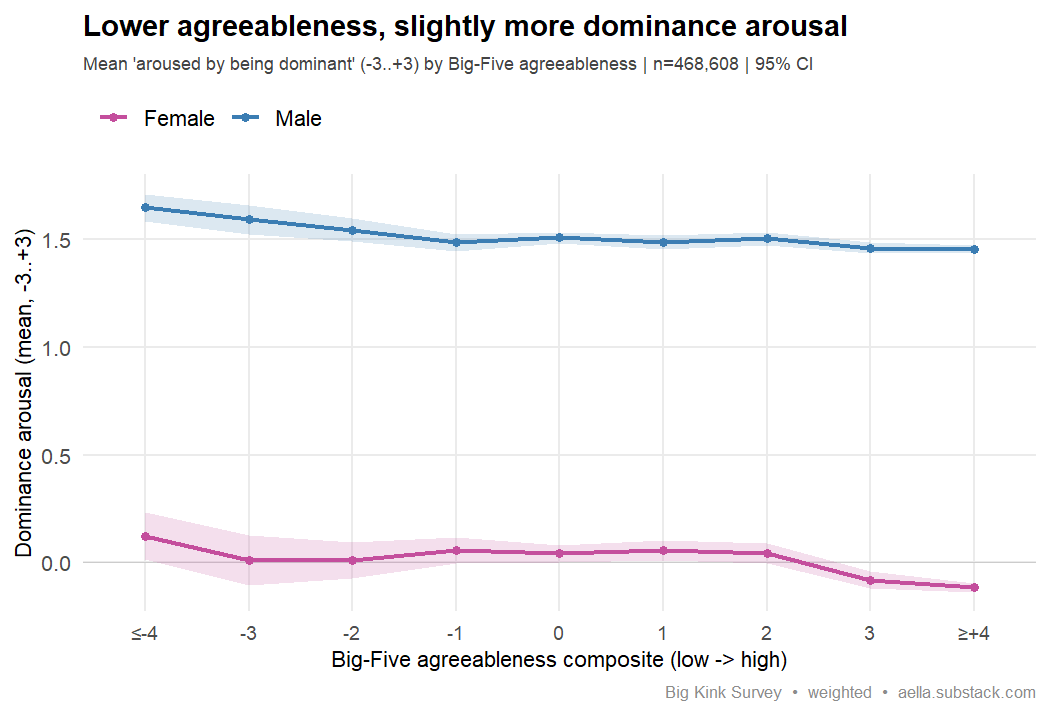
Your data: the predicted direction shows up, but it is weak and mostly explained by other things. Across everyone, mean arousal at "being dominant in sexual interactions" (-3..+3) falls steadily from +1.11 in the least-agreeable group (≤-4) to +0.58 in the most-agreeable (≥+4); overall weighted correlation r = -0.08 (n = 468,608). But sex drives most of it: men sit uniformly high (~+1.5) almost regardless of agreeableness, while the gradient lives mostly within women (+0.12 at low agreeableness down to -0.11 at high). Controlling for sex roughly halves the slope (-0.054 → -0.022), and adding narcissism shrinks it to -0.008 (still significant at p=0.001, but trivially small). So the Schmitt & Buss direction replicates, but as a faint, sex-and-narcissism-confounded effect rather than a strong standalone personality signal. Self-report, correlational, cross-sectional.
Survey question(s) asked
- “I sympathize with others' feelings” — −3 Totally disagree … +3 Totally agree, 7-point agreement scale
- “I feel little concern for others” — −3 Totally disagree … +3 Totally agree, 7-point
- “I am aroused by being dominant in sexual interactions” — −3 Totally disagree … +3 Totally agree, 7-point
- “To what extent do you agree with this statement: I am a narcissist.” (tip: “The word 'narcissist' means egotistical, self-focused, and vain.”) — −3 Totally disagree … +3 Totally agree, 7-point
- The agreeableness score is a two-item composite: the “sympathize” item minus the “little concern” item (each −3..+3, so the composite runs −6..+6). The narcissism item was used only as a statistical control.
175. Low conscientiousness → porn-induced fetishes Weak / mostly null
The claim: Impulsivity / low conscientiousness predicts greater porn-driven fetish escalation or acquisition of novel sexual interests.
Best: Bocci Benucci et al. (2024), J. Sexual Medicine 21(10):922–939 — meta-analysis finding a moderate positive association between impulsivity and (problematic) pornography use. link Backup: the related habituation/novelty ("Coolidge-effect") literature is sometimes invoked for escalation toward novel sexual content, but a direct low-conscientiousness→fetish-acquisition link is not established by a single study and should be read as illustrative.
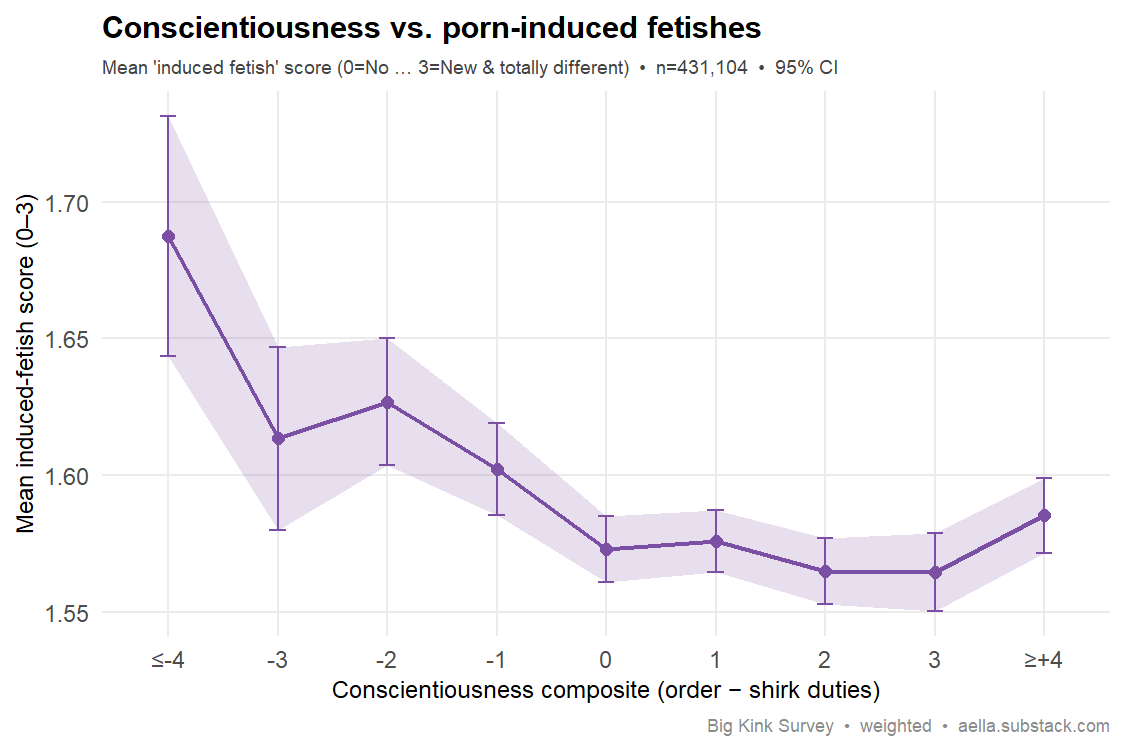
Your data: the direction matches but the effect is trivially small. Across the conscientiousness composite (order minus "shirk duties"), mean induced-fetish score (0=No … 3=new & totally different) falls only from ~1.69 at the lowest conscientiousness to ~1.57 at the highest — a ~0.1 shift on a 0–3 scale. Weighted correlation r=−0.011; bivariate slope −0.0051 per point (p<0.001, significant only because n=431,104). The share reporting any induced fetish is essentially flat (~82–84%) across all bins. Controlling for porn frequency, openness, and age nearly erases it (slope −0.0015, p=0.038), with porn frequency (pornhabit β=0.13) the dominant predictor. The slope is also sex-dependent: near-zero in women (−0.0002) and small in men (−0.0049). Verdict: weak/mostly null — correct-signed but negligible in size, largely a proxy for how much porn someone consumes, and absent in women. Self-report, cross-sectional, correlational.
Survey question(s) asked
- “I like order” — −3 Totally disagree … +3 Totally agree, 7-point agreement scale
- “I shirk my duties” — −3 Totally disagree … +3 Totally agree, 7-point
- “Do you feel as though you've "induced" new fetishes into yourself through the use of porn or erotic content, that otherwise would not have existed for you?” (tip: “If multiple apply, select the lowest on the list”) — I don't really have fetishes (no value stored) / No (0) / Yes: Variations on my current preexisting fetishes (1) / Yes: New but still similar to my preexisting fetishes (2) / Yes: New and totally different to my preexisting fetishes (3)
- “How often do you watch or read pornographic/erotic content?” (tip: “for the purposes of getting aroused”) — I don't (0) up through Less than once a year (1) … Multiple times a day (9), 10-point frequency scale
- Conscientiousness is a two-item composite: “I like order” minus “I shirk my duties” (composite −6..+6). Respondents answering “I don't really have fetishes” store no value and drop out of the analysis. The porn-frequency item, an openness composite (“I have excellent ideas” minus “I have difficulty understanding abstract ideas”), and age were used as statistical controls.
176. Bad at dating → porn over partnered sex Replicates
The claim: People who struggle with real-life courtship are more likely to rate pornography as more satisfying than partnered sex.
Best: No single study directly tests this; framed as illustrative of sexual-substitution / mate-deprivation models. See e.g. Wright, Sun, Steffen & Tokunaga (2019), Sexual and Relationship Therapy 34(4) — a "preference for pornographic over partnered sexual excitement" predicts lower partnered sexual satisfaction. Backup: Pizzol, Bertoldo & Foresta (2016), Int. J. of Adolescent Medicine & Health 28(2):169-173 — earlier/heavier adolescent porn exposure is linked to reduced interest in, and satisfaction with, partnered sex (general association, not a direct test of courtship difficulty).
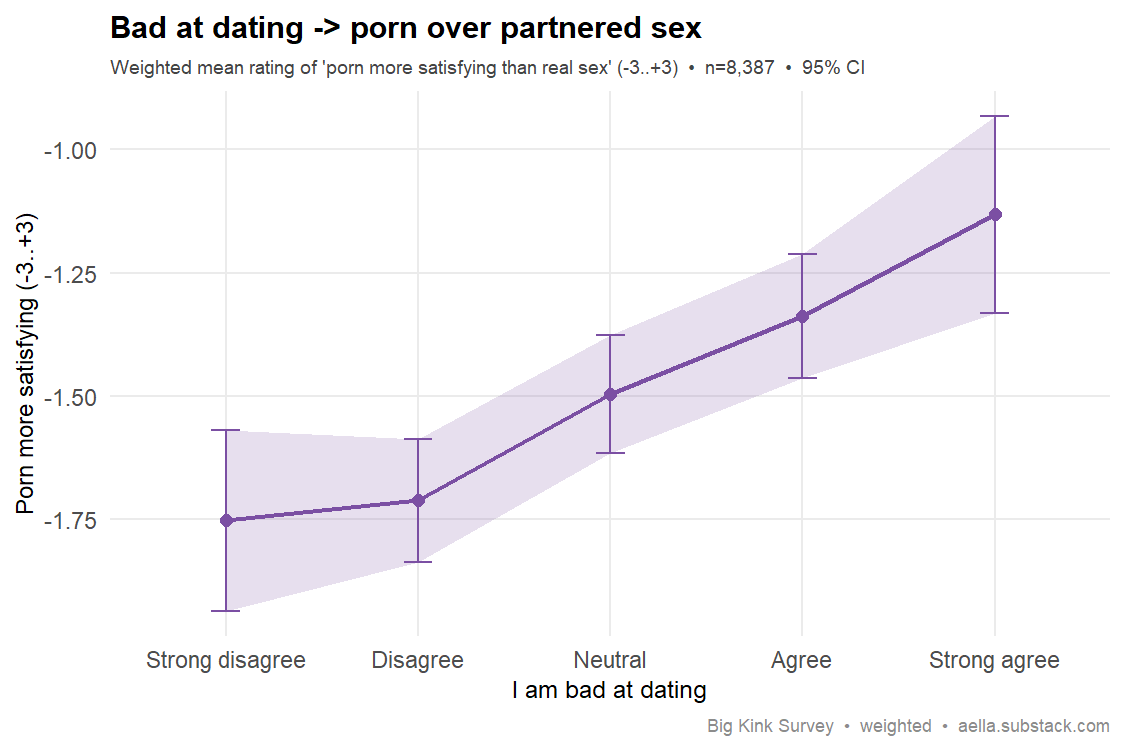
Your data: a clean dose-response gradient. As self-rated 'I am bad at dating' climbs from strong-disagree to strong-agree, the mean rating of 'porn is more satisfying than sex with a real person' (-3 to +3) rises monotonically from -1.75 to -1.13 (weighted r = 0.12, weighted n ≈ 8,200). The effect survives age residualization (r = 0.12) and a weighted regression controlling for sex, age, and relationship status (badatdating coefficient holds at +0.15, p < 0.001), and appears in both sexes (women r = 0.14, men r = 0.11). Important context: nearly everyone disagrees overall (group mean -1.51; only 26% rate porn at least as satisfying), so worse daters don't flip to preferring porn — they're just markedly less negative about it. Directionally consistent with the substitution claim, though correlational and cross-sectional, so causation is unproven.
Survey question(s) asked
- “I am bad at dating (asking people out, going on dates)” (tip: “Or 'would be bad' at dating if not currently trying to date”) — Strong disagree (−2) / Disagree (−1) / Neutral (0) / Agree (+1) / Strong agree (+2)
- “Pornography/erotic content is usually more satisfying than sex with a real person” — Haven't had sex/NA (no value stored) / Strongly agree (+3) / Agree (+2) / Slightly agree (+1) / Neutral (0) / Slightly disagree (−1) / Disagree (−2) / Strongly disagree (−3)
- “Your romantic relationship status is:” (tip: “If you have multiple romantic relationships, answer for the most serious one”) — Single (0) / Relationship (casual) (1) / Relationship (serious) (2) / Relationship (married) (3)
- Respondents choosing “Haven't had sex/NA” store no value, so the analysis covers only people with partnered-sex experience. Relationship status, sex, and age were used as statistical controls.
Attention, objectification & arousal
177. Narcissism → likes being catcalled Replicates
The claim: Narcissism predicts enjoyment of admiration and attention, including sexual objectification directed at the self — so self-rated narcissists should feel more positively about being catcalled.
Best: Morf & Rhodewalt (2001), Psychological Inquiry 12:177-196 — the dynamic self-regulatory model casts narcissism as organized around the chronic goal of obtaining continuous external self-affirmation and admiration. Backup: Back et al. (2013), JPSP 105:1013-1037 — admiration-seeking (charm, grandiosity, striving for uniqueness) is a core dimension of narcissism in the NARQ model. (Supports the general admiration/attention-seeking mechanism; neither directly tests reactions to catcalling.)
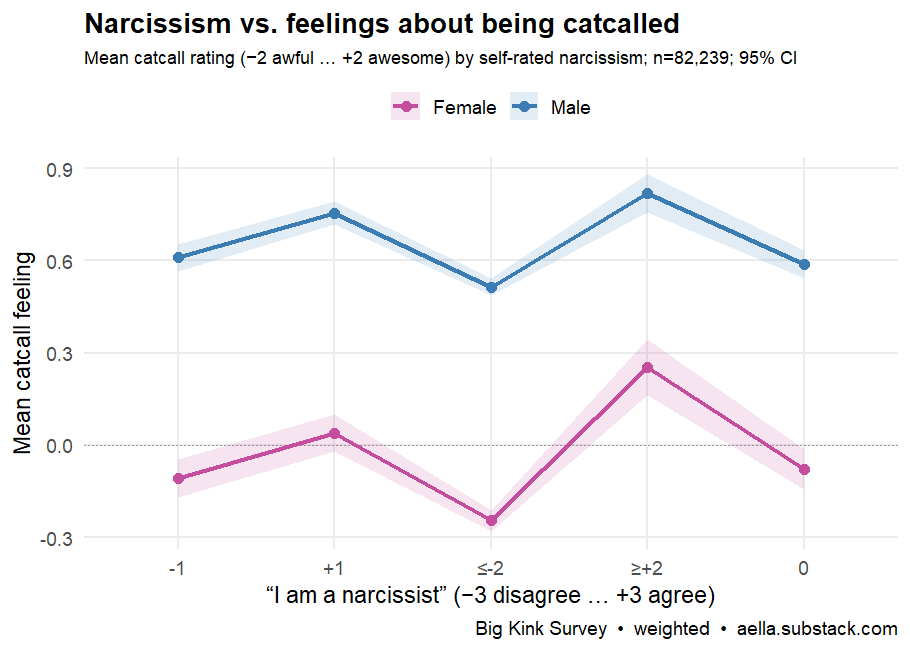
Your data: across 82,239 respondents (weighted analysis), higher self-rated narcissism tracks more positive feelings about being catcalled (weighted r = 0.13). The gradient rises overall, flat through the middle: pooled mean catcall rating (−2 awful … +2 awesome) climbs from +0.17 at the most non-narcissistic end (≤−2) to +0.34, +0.33, +0.53, and +0.64 at the most narcissistic (≥+2). Because women are catcalled more and rate it far more negatively, the sex split is the real test — and the effect holds in both. Women: mean rises from −0.25 (least narcissistic) to +0.25 (most), r = 0.11, n = 41,539. Men: from +0.51 to +0.82, r = 0.10, n = 40,700, even though men feel much more positive about catcalls overall. The slope survives the main confound, so this is a genuine within-sex association rather than a sex artifact. Replicates the admiration-seeking account of narcissism (Morf & Rhodewalt; Back et al.). Caveats: self-report, correlational, cross-sectional. Controlling for self-rated attractiveness leaves the within-sex correlations essentially unchanged (women r = 0.11, men r = 0.09), so the link is not an attractiveness artifact.
Survey question(s) asked
- “To what extent do you agree with this statement: I am a narcissist.” (tip: “The word 'narcissist' means egotistical, self-focused, and vain.”) — −3 Totally disagree … +3 Totally agree, 7-point agreement scale
- “Getting catcalled on the street (or the thought of getting catcalled) feels more:” (tip: “Assume a single, standard, objectifying catcall, such as "lookin sexy, baby" as you walk by.”) — Awesome (+2) / A bit positive (+1) / Neutral (0) / A bit negative (−1) / Awful (−2)
178. Sex → erotic interest in opposite-gender pairings Replicates
The claim: Men are more aroused than women by watching two other-sex people together (a man's "opposite gender" pairing is F/F, a woman's is M/M).
Best: see e.g. Chivers, Rieger, Latty & Bailey (2004), Psychological Science 15(11):736–744, PMID 15482445 — men show category-specific arousal (much stronger to their preferred sex than to the non-preferred sex), whereas women respond more similarly to both; illustrative of the broader sex difference rather than a direct test of arousal to other-sex pairings.
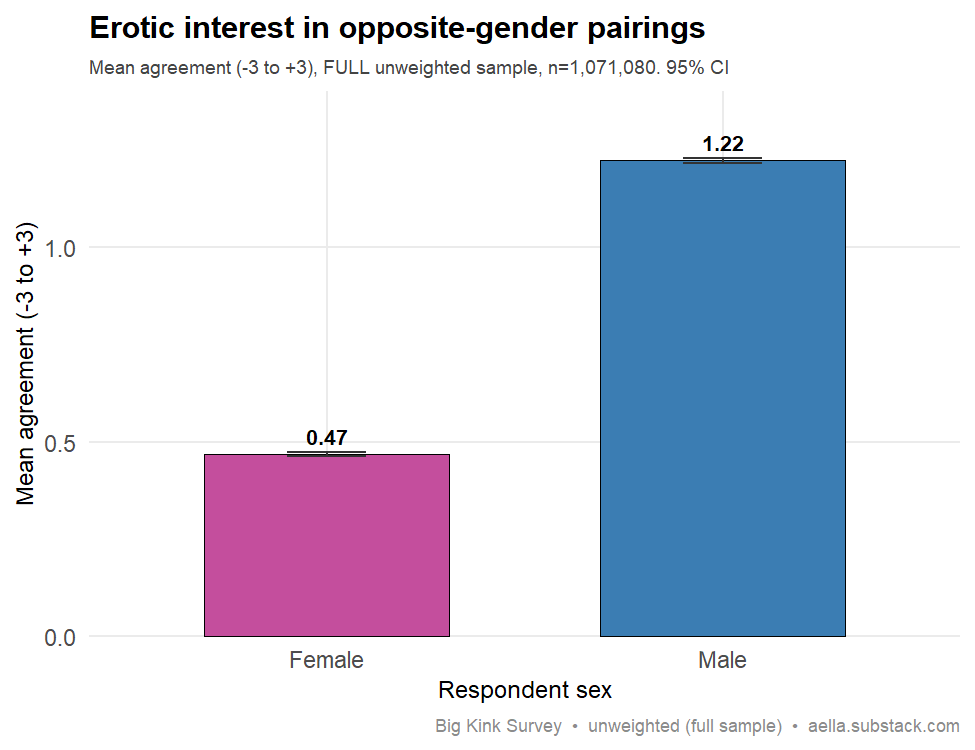
Your data: on a -3 to +3 agreement scale ("I find it erotic when two people of the opposite gender to me sexually interact"), men averaged +1.22 [95% CI 1.218-1.230] versus women +0.47 [0.464-0.474] — men score 0.76 points higher (raw, full unweighted sample, n=1,071,080). Because "opposite gender" means F/F for men and M/M for women, this is a clean test of the claim, and it holds. Restricting to heterosexual respondents (removing the orientation confound) widens the gap rather than shrinking it: men +1.56 vs women +0.28. Self-report and correlational, but the sex difference is large, monotonic, and robust. Clear replication of Chivers et al. (2004).
Survey question(s) asked
- “Which category fits you best?” — Man (cis) / Man (trans) / Woman (cis) / Woman (trans) / Nonbinary/other (assigned male at birth) / Nonbinary/other (assigned female at birth)
- “I find it erotic when two people of the opposite gender to me sexually interact with each other” (tip: “For example, if you are a man, then this would be imagining two women. If you're a woman, this would be imagining two men.”) — −3 Totally disagree … +3 Totally agree, 7-point agreement scale
- “You're sexually attracted to people with___” — Penises, exclusively / mostly / slightly / Both equally / Vaginas, slightly / mostly / exclusively
- “You're more sexually attracted to people who appear visually” — Totally masculine (+3) … Equally masculine and feminine (0) … Totally feminine (−3)
- The Male/Female split uses birth sex derived from the category item. The heterosexual-only robustness check uses Straight/Bisexual/Gay derived from the two attraction items relative to birth sex — not a self-identification question.
Relationships & non-monogamy
179. Extraversion → more likely partnered Replicates
The claim: Extraverts are more likely to be in a romantic relationship.
Best: Stern, Krämer, Schumacher, MacDonald & Richter (2024), Psychological Science 35(12):1364–1381 — in a large SHARE sample (N = 77,064), lifelong singles scored lower on extraversion than ever-partnered individuals, i.e. extraversion is associated with being partnered. Backup: Malouff et al. (2010), Journal of Research in Personality 44:124–127 — meta-analysis linking higher extraversion to greater relationship satisfaction among intimate partners.
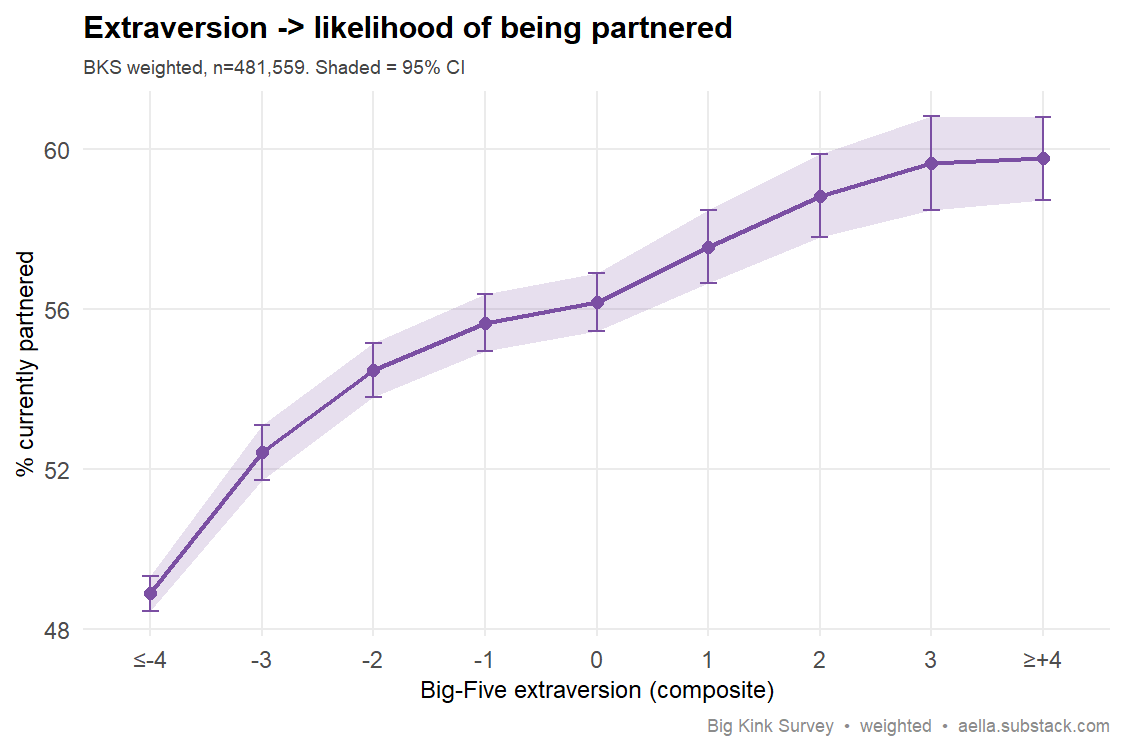
Your data: a clean, monotonic gradient. The share currently partnered climbs from 48.9% among the least extraverted (composite ≤-4) to 59.8% among the most extraverted (≥+4) — about an 11-point spread. Pooling the tails, 51.0% of introverts (≤-2) are partnered vs 59.4% of extraverts (≥+2). The effect is not an age artifact: in a weighted logistic model the extraversion coefficient barely moves after controlling for age and sex (0.054 → 0.051, both p < 1e-300). One caveat — it is strongly sex-dependent: among men the partnered rate rises 14 points across the extraversion range (48.9% → 63.3%), but among women it is nearly flat (53.1% → 54.5%, ~1.4 points). Weighted n = 481,559. Plain verdict: replicates clearly overall, driven mainly by men; correlational and cross-sectional, so direction of causation is not established.
Survey question(s) asked
- “I am the life of the party” — −3 Totally disagree … +3 Totally agree, 7-point agreement scale
- “I am quiet around strangers” — −3 Totally disagree … +3 Totally agree, 7-point
- “Your romantic relationship status is:” (tip: “If you have multiple romantic relationships, answer for the most serious one”) — Single (0) / Relationship (casual) (1) / Relationship (serious) (2) / Relationship (married) (3)
- Extraversion is a two-item composite: “life of the party” minus “quiet around strangers” (each −3..+3; composite −6..+6). “Partnered” means any answer other than Single. Age and sex were used as statistical controls.
180. Polyamory orientation → better casual sex Replicates (women)
The claim: People oriented toward non-monogamy report more positive experiences with casual sex.
Best: Conley, Piemonte, Gusakova & Rubin (2018), J. Social and Personal Relationships 35(4) — people in consensually non-monogamous relationships report equivalent-to-higher sexual satisfaction than monogamous people (swingers highest). link
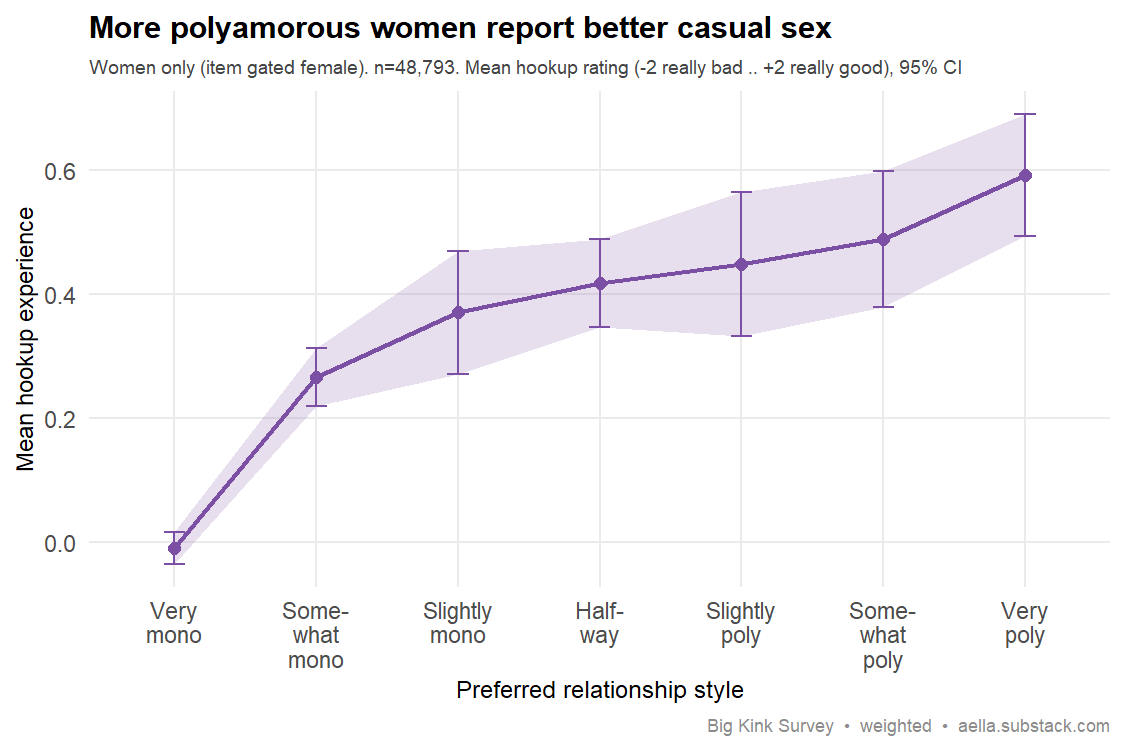
Your data: among women (the hookup item was asked of women only, weighted n=48,793), mean hookup-experience rating climbs cleanly with polyamory orientation: very-monogamous women sit at essentially neutral (-0.01, 95% CI -0.04 to +0.02), rising through slightly-poly (+0.45) to very-polyamorous (+0.59, 95% CI +0.49 to +0.69) on the -2 (really bad) to +2 (really good) scale. The gradient is monotonic across all seven levels (weighted r=0.14) and survives controlling for age (age-residualized means still run from -0.12 to +0.45). Replicates the predicted direction. Caveats: this is women only, self-reported, and cross-sectional/correlational — causality is unresolved (e.g., women who have had bad casual sex may drift toward monogamy rather than orientation driving experience).
Survey question(s) asked
- “Personally, your preferred relationship style is:” (tip: “Monogamy is preferring a relationship structure where both people are expected not to have sexual/romantic intimacy outside the relationship. Polyamory is a relationship structure where sexual/romantic intimacy outside the relationship is allowed.”) — Very monogamous (−3) / Somewhat monogamous (−2) / Slightly monogamous (−1) / Halfway between mono/poly (0) / Slightly polyamorous (+1) / Somewhat polyamorous (+2) / Very polyamorous (+3)
- “In general, casual sexual hookups have been a ___ experience for me” — I haven't hooked up (no value stored) / Really bad (−2) / Kinda bad (−1) / Neutral (0) / Kinda good (+1) / Really good (+2)
- The hookup item was only asked of natal-female respondents (survey gate: birth sex female), which is why this card is women-only. Respondents choosing “I haven't hooked up” store no value and are excluded.
Sex work: partners & wellbeing
181. Sex work → more sexual partners Replicates
The claim: People who have done sex work report more lifetime sexual partners.
Best: Brewer, Potterat, Garrett et al. (2000), PNAS 97(22):12385-8 — sex workers (prostitute women) report very high numbers of sexual partners relative to the general population. link Backup: see e.g. Vanwesenbeeck (2001), Annual Review of Sex Research 12:242-289, a review of sex-work research.
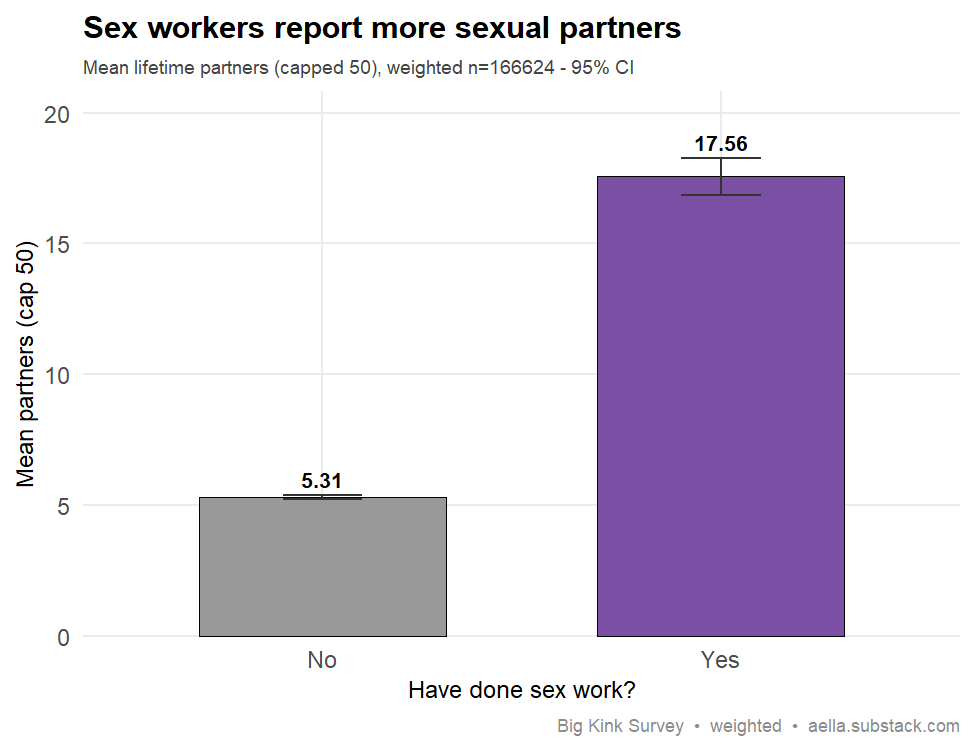
Your data: people who've done sex work report a mean of 17.6 lifetime partners (95% CI 16.9-18.3) versus 5.3 for everyone else (95% CI 5.2-5.4), with partner counts capped at 50; weighted n=166,624 (8,593 sex workers). The gap is large in both sexes (women 17.9 vs 5.2; men 17.1 vs 5.4) and persists across age strata (e.g. age 18-24: 10.9 vs 2.3; age 25-34: 22.4 vs 10.0). Adjusting for age and sex in a weighted regression, sex work still predicts about +10.3 additional partners (p<0.001). Clear replication. Caveats: this is self-reported, correlational, and cross-sectional — direction of causality is undetermined. The count uses each respondent's own definition of "sex," so it may or may not include paid clients, which could partly inflate the sex-worker figure.
Survey question(s) asked
- “Have you done sex work (as a performer/provider/etc.?)” — Yes / No
- “How many people have you had sex with?” (tip: “By your definition of 'sex' - this typically means penetration, and sometimes includes oral sex.”) — free-entry number
- Partner counts are capped at 50 in this analysis; age and sex were used as statistical controls. Per the survey's follow-up questions, “performer” includes online-only work such as cam or subscription-site performing.
182. Sex work → mental-health conditions Confounded (selection)
The claim: Sex workers are not uniformly more psychologically distressed than the general population — contra the 'damaged sex worker' stereotype, the gap should be small/modest rather than dramatic.
Best: Evidence here is mixed and context-dependent rather than settled: several studies in legalized/indoor settings — e.g. Rössler et al. (2010), Acta Psychiatrica Scandinavica 122(2):143-152 (Zurich) and Krumrei-Mancuso (2017), Archives of Sexual Behavior 46(6):1843-1856 (Netherlands) — find distress closer to general-population levels, whereas broader meta-analyses (e.g. Martín-Romo et al., 2023, Acta Psychiatrica Scandinavica) report elevated depression, PTSD and anxiety. Outcomes track working conditions (violence, safety, legal status) more than sex work per se, so the "uniformly damaged" stereotype is not supported even though a clean null gap is not established. Backup: Benoit, Jansson, Smith & Flagg (2018), Journal of Sex Research 55(4-5):457-471 — on stigma as a fundamental driver of sex workers' health outcomes (illustrative of the conditions-not-character framing).
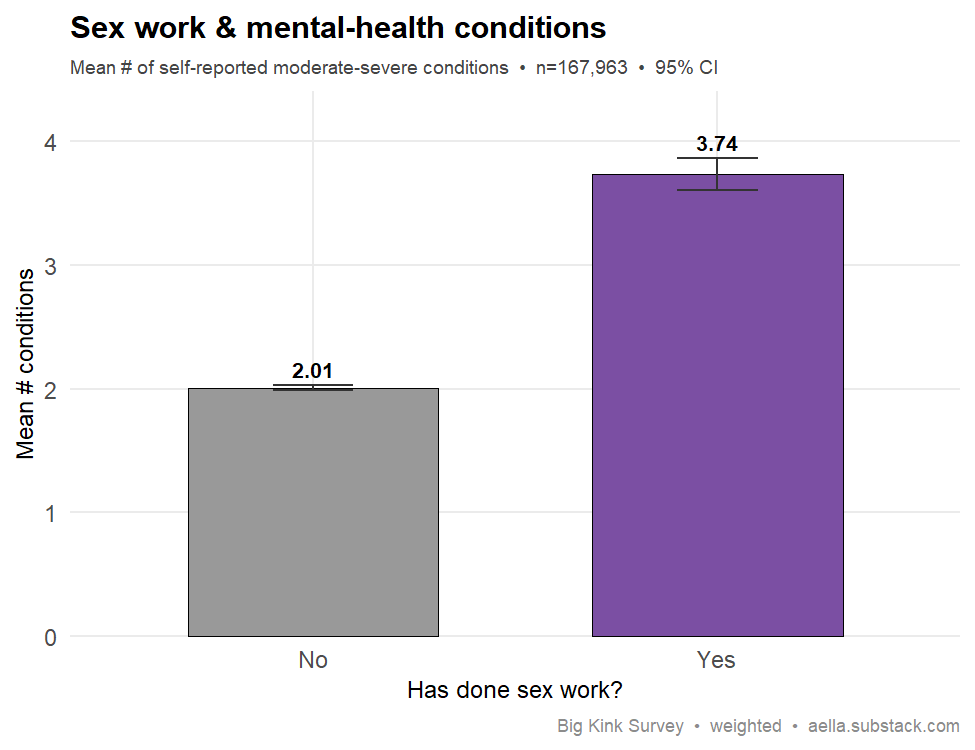
Your data: respondents who report having done sex work carry markedly more self-reported moderate-to-severe mental-health conditions than those who haven't — a weighted mean of 3.74 conditions (95% CI 3.61–3.87) vs 2.01 (1.99–2.03), roughly +1.7 conditions or 86% higher (weighted n=167,963; sex-worker cell n=8,777). On the binary cut, 84.8% of sex workers report at least one condition vs 67.1% of others. The gap holds within each sex (Female 4.30 vs 2.72; Male 3.06 vs 1.54), so it isn't driven by sex workers skewing more female. Rather than the small/modest difference the de-stigmatization framing predicts, the raw elevation is large — but this is precisely the comparison most vulnerable to selection (people with prior distress are likelier to both enter sex work and to check more boxes), so BKS can't cleanly test, let alone refute, whether sex work itself harms wellbeing. Caveats: this is self-report, cross-sectional, and correlational — it cannot separate any effect of sex work itself from trauma/childhood-adversity selection (people with prior distress are likelier to both enter sex work and check more boxes), and it says nothing about causation or direction.
Survey question(s) asked
- “Have you done sex work (as a performer/provider/etc.?)” — Yes / No
- “Do you have any of the following” (checkbox; tip: “Please only check if they're 'moderate to severe'”) — ADHD / Anorexia / Anxiety / Autism / Bipolar I / Bipolar II / Body Dysmorphia / Borderline / Bulimia / C-PTSD / Depersonalization-derealization / Depression / Disassociative Identity Disorder / OCD / PTSD / Schizophrenia / Social anxiety / Sociopathy / Substance Abuse Disorder
- The outcome is the number of boxes checked (0–19); respondents who checked nothing are counted as 0. These are self-reported conditions, not clinical diagnoses — the question never mentions diagnosis.
Autism & sexuality
183. Autism → less exclusively hetero Replicates
The claim: Autistic people show elevated rates of non-heterosexual orientation.
Best: George & Stokes (2018), “Sexual Orientation in Autism Spectrum Disorder,” Autism Research — 69.7% of autistic adults reported non-heterosexual orientation vs 30.3% of comparison adults. Backup: Weir, Allison & Baron-Cohen (2021), “The sexual health, orientation, and activity of autistic adolescents and adults,” Autism Research — autistic adults less likely to report heterosexuality (n = 2,386).
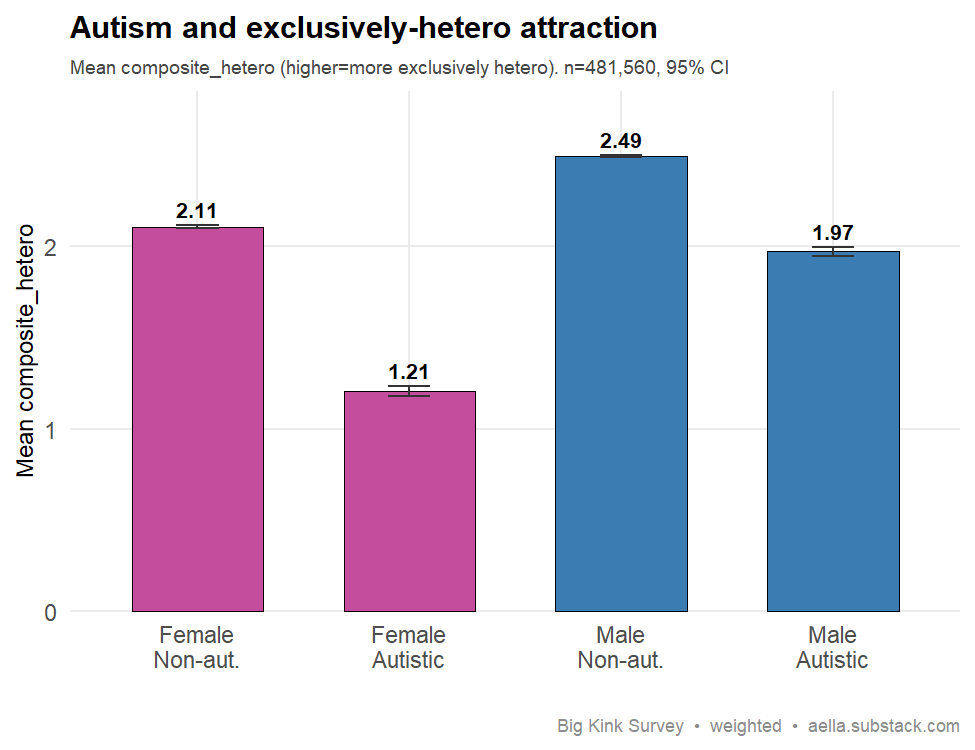
Your data: Self-reported autistic respondents score notably lower on composite_hetero (a sex-relative blend of genital- and visual-gender attraction, higher = more exclusively hetero) in both sexes. Women: 2.11 (non-autistic, n=235,066) vs 1.21 (autistic, n=44,679). Men: 2.49 (non-autistic, n=170,579) vs 1.97 (autistic, n=31,236). All four group CIs are non-overlapping; the gap is larger in women but clearly present in both. Autistic respondents are heavily enriched for trans/nonbinary identity, which lowers this sex-relative composite by construction; among cis respondents only the gap roughly halves but stays clear (women 2.21 vs 1.70, men 2.54 vs 2.28, CIs still non-overlapping). Weighted n=481,560. Replicates: autism tracks with less exclusively heterosexual attraction. Self-reported autism (checkbox, "moderate to severe"), correlational and cross-sectional.
Survey question(s) asked
- “Do you have any of the following” — checkbox list of conditions (tip: “Please only check if they're 'moderate to severe'”); “Autism” checked vs not
- “You're sexually attracted to people with___” — Penises, exclusively / Penises, mostly / Penises, slightly / Both equally / Vaginas, slightly / Vaginas, mostly / Vaginas, exclusively (7-point)
- “You're more sexually attracted to people who appear visually” — Totally masculine / Somewhat masculine / Slightly masculine / Equally masculine and feminine / Slightly feminine / Somewhat feminine / Totally feminine (7-point)
- “Which category fits you best?” — Man (cis) / Man (trans) / Woman (cis) / Woman (trans) / Nonbinary/other (assigned male at birth) / Nonbinary/other (assigned female at birth)
- The outcome (composite_hetero) averages the two attraction items scored relative to birth sex, so higher = more exclusively heterosexual. It is derived from these attraction items — the survey never asks a “what is your sexual orientation?” self-identification question. The women/men split uses sex assigned at birth from the category item.
184. Autism → fewer sexual partners Sex-dependent
The claim: Autistic adults report fewer lifetime sexual partners / less sexual experience than non-autistic adults.
Best: Evidence is mixed, but see e.g. Motamed et al. (2025), BMC Psychiatry — a systematic review reporting that some studies find autistic adults (especially males) are less likely to have had partnered sexual experiences than non-autistic peers, while others find no difference. link Backup: Byers, Nichols & Voyer (2013), Autism — sexual well-being in autistic adults (within-group, illustrative).
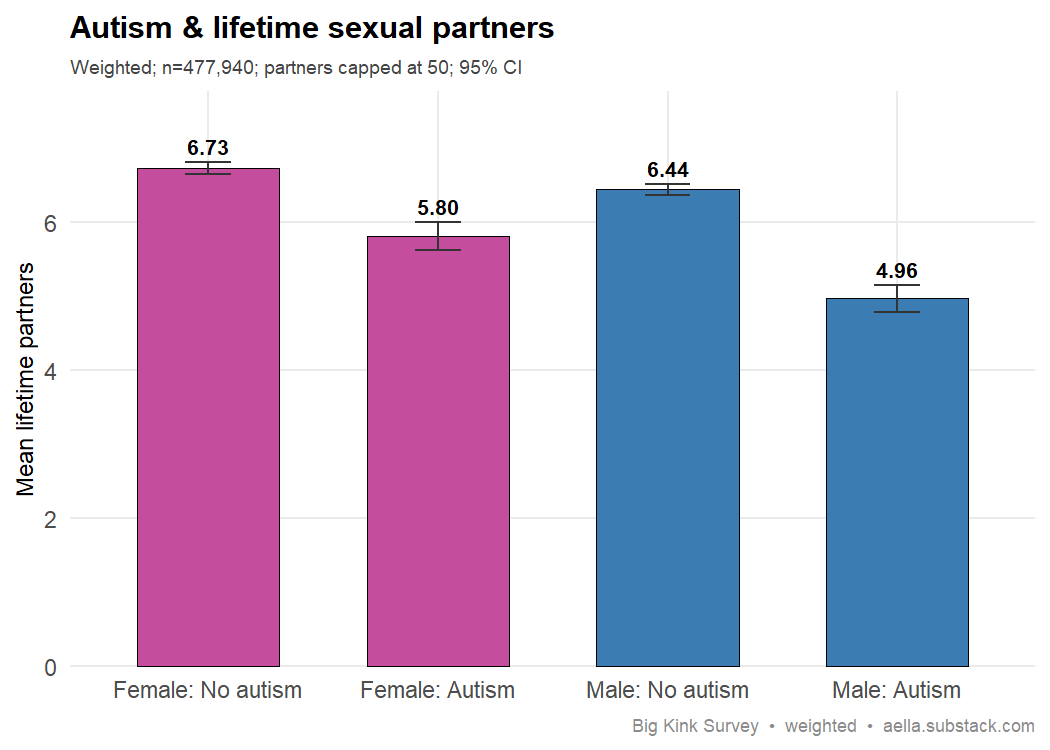
Your data: self-reported autistic respondents report fewer lifetime partners overall (5.37 vs 6.58 weighted mean, partners capped at 50; weighted n=477,940). The gap survives controlling for age (autism sits ~0.39 partners below its age-expected level vs +0.04 for non-autistic). But it is strongly sex-dependent: among men the autism gap is large and robust after age control (residual -0.74; raw 4.96 vs 6.44), whereas among women it nearly vanishes once age is controlled (residual +0.08; raw 5.80 vs 6.73). So the claim replicates clearly for men but is weak-to-absent for women. Self-report (autism not clinically confirmed), correlational and cross-sectional — no causal or directional inference.
Survey question(s) asked
- “Do you have any of the following” — checkbox list of conditions (tip: “Please only check if they're 'moderate to severe'”); “Autism” checked vs not
- “How many people have you had sex with?” — free numeric response (tip: “By your definition of 'sex' - this typically means penetration, and sometimes includes oral sex.”)
- “Which category fits you best?” — Man (cis) / Man (trans) / Woman (cis) / Woman (trans) / Nonbinary/other (assigned male at birth) / Nonbinary/other (assigned female at birth)
- Partner counts are capped at 50 for this analysis. Autism is a self-reported checkbox, not a diagnosis question. The men/women split uses sex assigned at birth from the category item.
185. Autism → age at first sex Reversed
The claim: Autistic people tend to have their first sexual experience later (Dewinter et al. 2017).
Best: Dewinter, Vermeiren, Vanwesenbeeck & Van Nieuwenhuizen (2016), European Child & Adolescent Psychiatry 25(9):969–978 — autistic adolescent boys were more likely than matched peers to report no partnered sexual experience. link
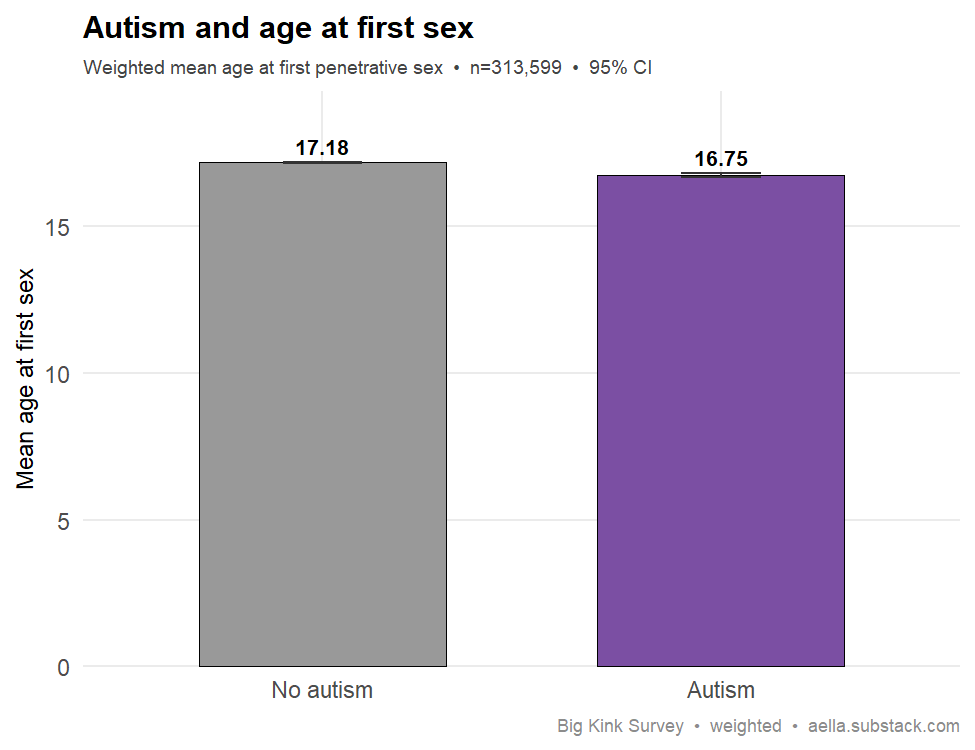
Your data: among the 313,599 weighted respondents who reported an age at first penetrative sex, those self-reporting (moderate-to-severe) autism debuted slightly EARLIER, not later — mean 16.75 yrs (95% CI 16.69–16.81) vs 17.18 yrs (17.16–17.20) for non-autistic respondents. Controlling for current age (debut recency), autistic respondents sit about 0.16 yrs below their age-matched peers (resid −0.16, CI −0.21 to −0.11). The gap is entirely female-driven: autistic women debut ~0.32 yrs earlier than age-matched non-autistic women (CI −0.39 to −0.25), while autistic men show no difference (−0.01, CI −0.09 to +0.07). This reverses the cited "later debut" claim. Two caveats temper a hard reversal: (1) this is a heavily kink-skewed self-selected sample with self-reported autism, not a clinical population; (2) ~168k respondents who answered "I haven't had sex" are excluded as missing — if autistic people are likelier to never debut, this conditional-on-debut analysis would miss the "less experience overall" half of Dewinter. Among those who do debut, the direction is reversed and female-specific.
Survey question(s) asked
- “Do you have any of the following” — checkbox list of conditions (tip: “Please only check if they're 'moderate to severe'”); “Autism” checked vs not
- “At what age did you first have penetrative sexual intercourse?” — I haven't had sex / 12 or younger / single years 13–25 / 26-30 / 31-35 / 36-40 / 41+
- Banded answers are coded to representative ages (“12 or younger”→11, “26-30”→28, “31-35”→34, “36-40”→38, “41+”→45). “I haven't had sex” is treated as missing, so the analysis is conditional on having debuted — the basis of the card's selection caveat.
Dark traits, coercion & kink
186. Sociopathy → broader kink repertoire Replicates
The claim: Antisocial / dark-triad traits correlate with a broader repertoire of sexual interests.
Best: Baughman, Jonason, Veselka & Vernon (2014), “Four shades of sexual fantasies linked to the Dark Triad,” Personality & Individual Differences 67, 47–51, doi:10.1016/j.paid.2014.01.034 — psychopathy linked to exploratory, impersonal, and sadomasochistic fantasies and higher sex drive. Backup: see e.g. the broader literature linking psychopathic/antisocial traits to a wider range of paraphilic and deviant sexual interests (illustrative, not a single canonical source).
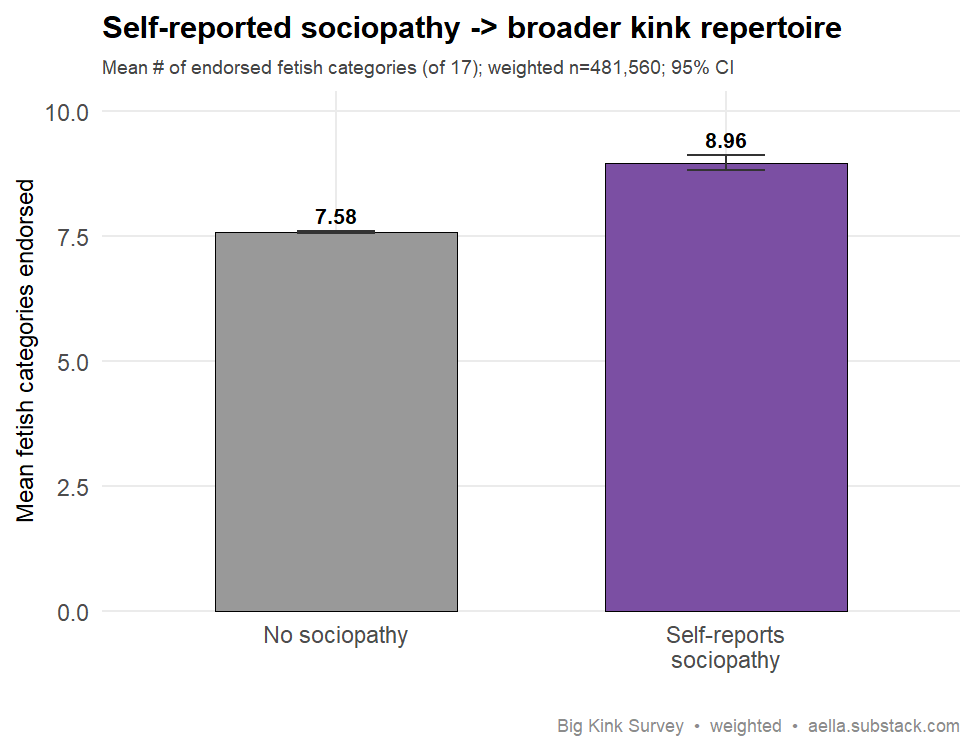
Your data: respondents who self-report sociopathy ("moderate to severe") endorse a mean of 8.96 fetish categories (95% CI 8.81–9.11) versus 7.58 for everyone else (95% CI 7.56–7.60) — about +1.4 more interests, with non-overlapping CIs (weighted n=481,560; sociopathy cell n=6,626). The gap is essentially identical in both sexes (Female 9.06 vs 7.67; Male 8.92 vs 7.50), so it is not a sex artifact. Controlling for the number of other self-reported conditions (a proxy for overall mental-illness burden and checkbox-endorsement style), the gap shrinks to +0.77 categories but remains clear. Consistent with the dark-triad / sexual-exploration literature. Caveats: sociopathy is self-reported (a checkbox, not a clinical diagnosis), the sample is kink-saturated, and the association is correlational and cross-sectional — it shows a co-occurrence, not that antisocial traits cause broader interests.
Survey question(s) asked
- “Do you have any of the following” — checkbox list of conditions (tip: “Please only check if they're 'moderate to severe'”); “Sociopathy” checked vs not
- “Common things: Check all the following categories that contain a thing that arouses you.” — 17-category checkbox, each with examples in parentheses: Appearance states / Body parts (non-genital) / Bondage / Clothing / Eagerness / Exhibitionism/voyeurism / Gentleness / Humiliation / Incest / Multiple partners / Mythical/fictional creatures / Nonconsent / Power dynamics & D/s / Roles / Sadomasochism / Sensory / Toys
- The outcome is the number of categories checked (0–17); respondents who checked none are counted as 0. The condition item is a self-report checkbox labeled simply “Sociopathy” — it does not ask about diagnosis or use the term ASPD.
187. Self-reported coercion → arousal to giving pain Replicates
The claim: Self-reported sexual coercion is associated with greater eroticized arousal to inflicting pain.
Best: Lohr, Adams & Davis (1997), Journal of Abnormal Psychology 106(2), 230–242 — self-reported sexually coercive men show greater genital arousal to force/aggression cues and fail to inhibit arousal when force is introduced. PMID 9131843. Backup: Russell & King (2016), Personality and Individual Differences 99, 340–345 — everyday (esp. physical) sadism predicts male sexual aggression and coercion.
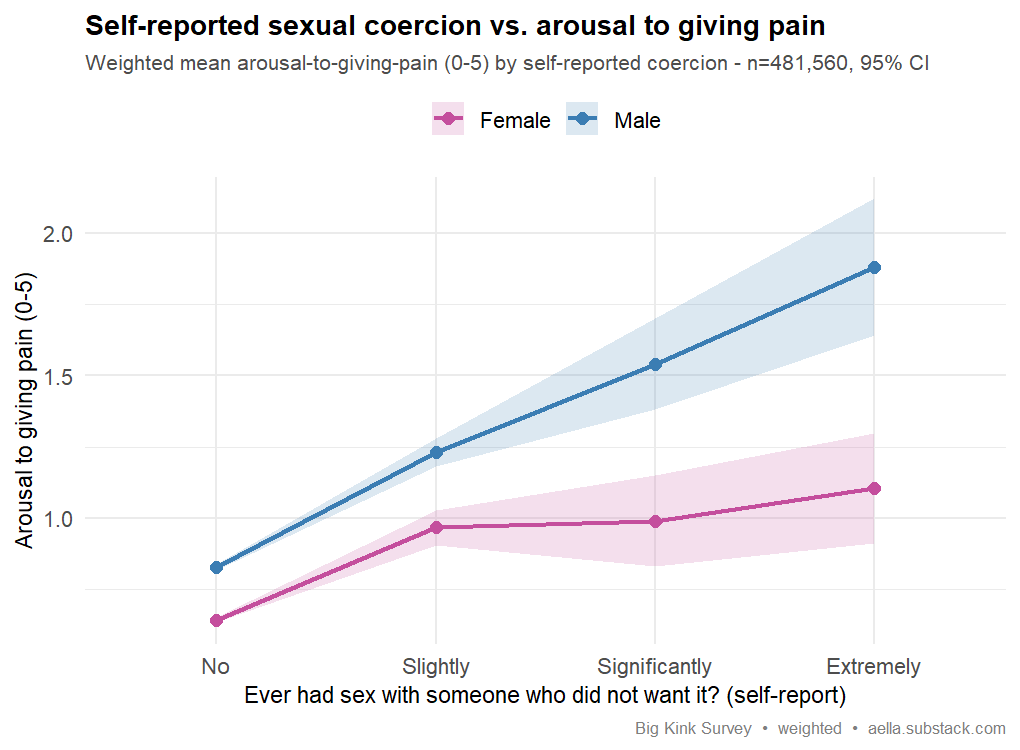
Your data: A clean, monotonic dose-response. Among the 481,560 weighted respondents, mean arousal to giving pain (0-5 scale) rose with self-reported coercion: 0.74 for those reporting no such experience (n=453,772), 1.15 "slightly" (n=23,104), 1.31 "significantly" (n=2,889), and 1.54 "extremely" (n=1,795), with non-overlapping 95% CIs across the gradient. The pattern holds in both sexes but is steeper in men (0.83 to 1.88) than women (0.64 to 1.11). This is a self-report, cross-sectional, correlational association, not evidence of causation; the predictor asks whether the respondent ever had sex with someone they knew did not want it (explicitly excluding consensual nonconsent). Direction and gradient match the literature, so the finding replicates, with the caveat that the effect is markedly sex-dependent.
Survey question(s) asked
- “Have you ever had a sexual experience with someone else who did not want the experience?” — No / Yes, slightly / Yes, significantly / Yes, extremely (tip: “And you knew that they didn't want it? This *doesn't* include consensual nonconsent, such as roleplaying an abduction.”)
- “In erotic contexts, I find *giving* pain to others to be:” — Not arousing / Slightly arousing / Somewhat arousing / Moderately arousing / Very arousing / Extremely arousing (6-point)
- “Which category fits you best?” — Man (cis) / Man (trans) / Woman (cis) / Woman (trans) / Nonbinary/other (assigned male at birth) / Nonbinary/other (assigned female at birth)
- The survey scores the arousal labels 0/1/2/3/5/8; the cleaned data used here stores them as an ordinal 0–5 recode (Not arousing = 0 … Extremely arousing = 5). The men/women split uses sex assigned at birth from the category item.
188. Higher BMI → feederism arousal Not seen
The claim: Higher body weight is associated with greater feederism (feeder/feedee) erotic interest.
Best: see e.g. Terry, Suschinsky, Lalumière & Vasey (2012), “Feederism: An Exaggeration of a Normative Mate Selection Preference?”, Archives of Sexual Behavior 41:249–260 (PubMed) — characterizes feederism as eroticizing feeding and weight gain, framed as a partner-directed size preference. Note: illustrative of the feederism construct only; available sources do not establish that a person’s own higher BMI predicts greater feederism interest (study samples cluster around healthy BMI), so no direct support for an own-weight→arousal correlation is cited.
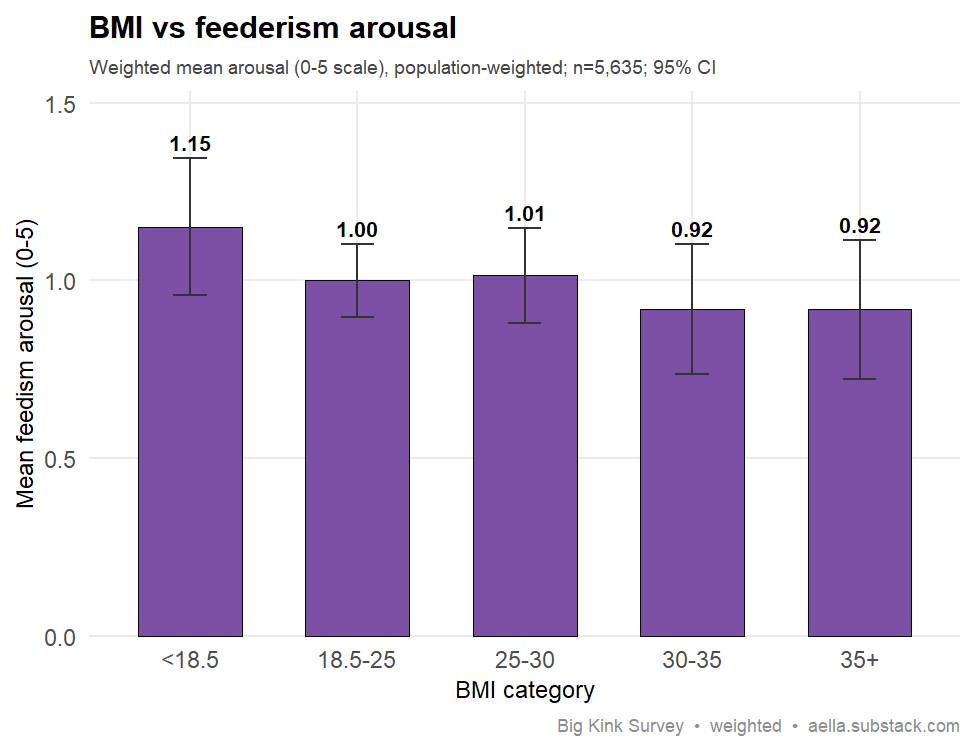
Your data: across 5,635 respondents who answered the feedism item ("I find feedism/feederism to be:", six-point arousal scale coded 0-5), the weighted correlation between BMI and feedism arousal is essentially zero (r = 0.003; age-residualized r = 0.015). The predicted gradient is absent: binned mean arousal runs 1.15 (BMI <18.5), 1.00 (18.5-25), 1.01 (25-30), 0.92 (30-35), 0.92 (35+) — flat to slightly reversed, with underweight respondents scoring highest and obese respondents lowest, and all CIs overlapping. The two sexes disagree weakly (women r = 0.10, men r = -0.04), so there is no coherent positive signal even after splitting. The claim that higher body weight tracks feederism interest is not seen here. Note: the feedism item was added late in fielding, so n is far smaller than other kink items; this is correlational and cross-sectional and cannot speak to direction or causation.
Survey question(s) asked
- “I find feedism/feederism to be:” — Not arousing / Slightly arousing / Somewhat arousing / Moderately arousing / Very arousing / Extremely arousing (6-point)
- “What's your height?” — banded options from <5'0" (<152cm) to 6'6"+ (198cm), in 1-inch steps
- “Your weight is closest to:” — banded options from <90lbs (<41kg) to >350lbs (>159kg), in 20lb steps
- BMI is computed from the two banded height/weight self-reports. The survey scores the arousal labels 0/1/2/3/5/8; the cleaned data used here stores them as an ordinal 0–5 recode. The feedism item was added late in fielding (Feb 2026), which is why its n is far smaller than other kink items.
Biomarkers & orientation
189. Finger length (2D:4D proxy) → orientation Not seen
The claim: A more masculinized digit ratio (longer ring finger, lower 2D:4D) is associated with same-sex attraction, especially in women.
Best: Williams et al. (2000), Nature 404:455–456 — finger-length (2D:4D) ratios differ by sexual orientation, with homosexual women showing more masculinized (lower) ratios. PMID 10761903
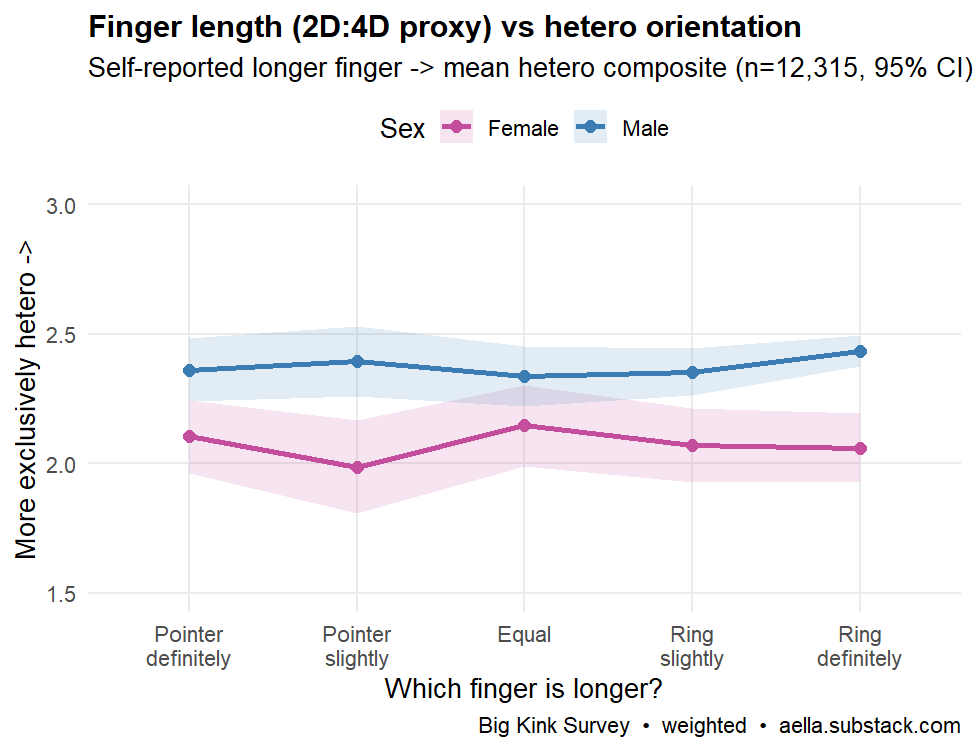
Your data: respondents reported which finger is longer (pointer to ring, -2..+2, a crude single-item 2D:4D proxy) against the hetero composite, split by sex (weighted n=12,315). In women, mean hetero score is flat across the whole range — 2.10 at "pointer definitely," 2.15 at "equal," 2.06 at "ring definitely" — with overlapping CIs and a weighted correlation of just r=-0.005. The predicted "more ring-dominant → less exclusively hetero" gradient, supposedly strongest in women, is absent. In men it's likewise flat (2.36 to 2.44; r=+0.025), if anything tilting the trivially-opposite way. This does not replicate Williams et al. (2000). Caveats: the predictor is a coarse self-reported proxy, not a physical measurement, so attenuation toward null is expected; correlational and cross-sectional.
Survey question(s) asked
- “On your hands, which finger is longer - your pointer (index) finger or your ring finger?” — Pointer, definitely (−2) / Pointer, maybe/slightly (−1) / They seem about the same length (0) / Ring finger, maybe/slightly (+1) / Ring finger, definitely (+2)
- “You're sexually attracted to people with___” — Penises, exclusively / Penises, mostly / Penises, slightly / Both equally / Vaginas, slightly / Vaginas, mostly / Vaginas, exclusively (7-point)
- “You're more sexually attracted to people who appear visually” — Totally masculine / Somewhat masculine / Slightly masculine / Equally masculine and feminine / Slightly feminine / Somewhat feminine / Totally feminine (7-point)
- “Which category fits you best?” — Man (cis) / Man (trans) / Woman (cis) / Woman (trans) / Nonbinary/other (assigned male at birth) / Nonbinary/other (assigned female at birth)
- The outcome (composite_hetero) averages the two attraction items scored relative to birth sex (higher = more exclusively heterosexual) — derived from attraction, not a self-identification question. The finger item was added late in fielding (May 2026), which is why n is much smaller than most cards. The women/men split uses sex assigned at birth.
Big Five personality, by sex
190. Conscientiousness: women slightly higher Replicates
The claim: Women score slightly higher than men in conscientiousness, especially orderliness.
Best: Schmitt, Realo, Voracek & Allik (2008), J. Personality & Social Psychology 94:168–182 (55 nations, N=17,637) — women report modestly higher Conscientiousness across most cultures. Backup: Weisberg, DeYoung & Hirsh (2011), Frontiers in Psychology — the difference is carried by the Orderliness aspect (women higher, d=0.18), with little net difference at the broad Conscientiousness level.
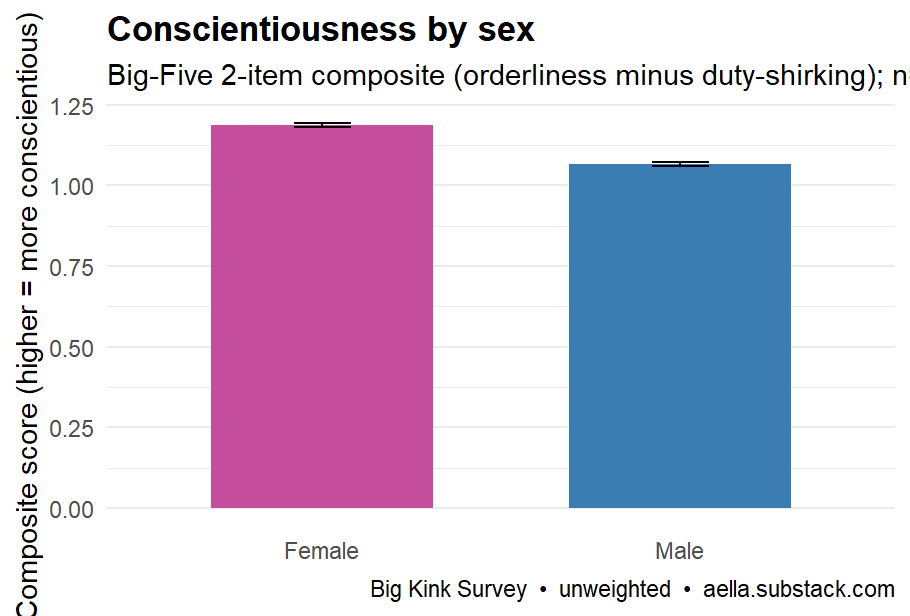
Your data: women average 1.19 on the 2-item conscientiousness composite (95% CI 1.18–1.19) vs men 1.07 (95% CI 1.06–1.07), n=1,071,342 (unweighted, since sex is a raking variable). The gap is highly significant (p<2e-16) but small (Cohen's d≈0.06), exactly the "small" effect the literature predicts. Direction (women > men) holds and is robust to controlling for age — adjusting for age actually widens the male deficit slightly, while conscientiousness rises with age (~0.05/yr). The composite is a coarse 2-item proxy (orderliness "I like order" minus duty-shirking "I shirk my duties"), self-report and cross-sectional, so the magnitude should be read as approximate; nonetheless the predicted small female advantage replicates clearly.
Survey question(s) asked
- “I like order” — Totally agree (+3) / Agree (+2) / Somewhat agree (+1) / Neither agree nor disagree (0) / Somewhat disagree (−1) / Disagree (−2) / Totally disagree (−3)
- “I shirk my duties” — same 7-point agreement scale
- “Which category fits you best?” — Man (cis) / Man (trans) / Woman (cis) / Woman (trans) / Nonbinary/other (assigned male at birth) / Nonbinary/other (assigned female at birth)
- The conscientiousness composite = “I like order” minus “I shirk my duties” (range −6 to +6). Women/men are grouped by sex assigned at birth from the category item.
191. Openness (ideas facet) → men score higher Replicates
The claim: On the ideas/intellect facet of openness, men tend to score slightly higher, even though overall openness sex differences are mixed and facet-dependent.
Best: Weisberg, DeYoung & Hirsh (2011), Frontiers in Psychology — openness sex differences are aspect-specific: men score higher on the Intellect aspect, women higher on the Openness aspect (Aesthetics/Feelings). Backup: Costa, Terracciano & McCrae (2001), J. Pers. Soc. Psychol. — across 26 cultures, men higher on Openness to Ideas, women higher on Openness to Feelings.
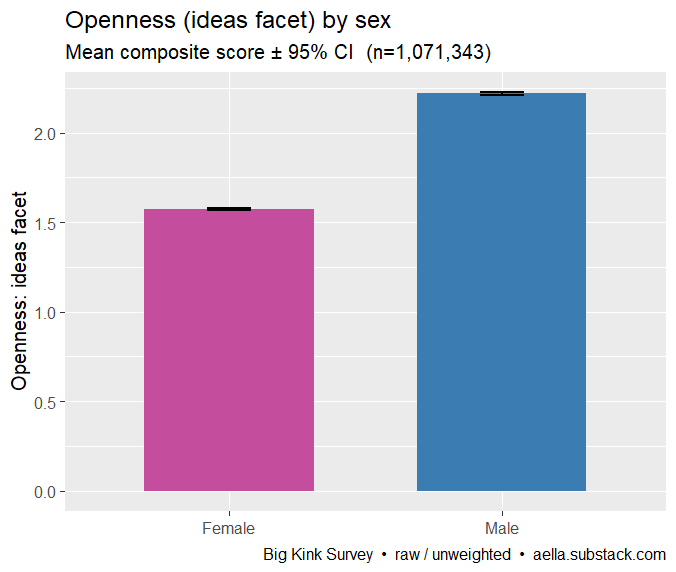
Your data: on a 2-item ideas-facet composite ("I have excellent ideas" minus "I have difficulty understanding abstract ideas", range -6 to +6), men average 2.22 [95% CI 2.21, 2.23] vs women 1.57 [1.57, 1.58] — a 0.64-point gap (Cohen's d = 0.28, p < 2e-16, n = 1,071,343). The predicted direction holds clearly: men score higher on the ideas/intellect facet of openness. The effect is small-to-moderate and, given the enormous sample, more sharply estimated than the "mixed" literature implies — but directionally it matches. Caveats: raw/unweighted, self-report, cross-sectional, and a coarse 2-item Big-Five proxy that taps only the ideas facet, not global openness (where sex differences genuinely wash out).
Survey question(s) asked
- “I have excellent ideas” — Totally agree (+3) / Agree (+2) / Somewhat agree (+1) / Neither agree nor disagree (0) / Somewhat disagree (−1) / Disagree (−2) / Totally disagree (−3)
- “I have difficulty understanding abstract ideas” — same 7-point agreement scale
- “Which category fits you best?” — Man (cis) / Man (trans) / Woman (cis) / Woman (trans) / Nonbinary/other (assigned male at birth) / Nonbinary/other (assigned female at birth)
- The ideas-facet composite = “I have excellent ideas” minus “I have difficulty understanding abstract ideas” (range −6 to +6). Men/women are grouped by sex assigned at birth from the category item.
192. Extraversion → little sex difference No difference
The claim: Global extraversion shows a negligible sex difference (any split shows up only at the facet level: women higher on warmth, men higher on assertiveness).
Best: Weisberg, DeYoung & Hirsh (2011), Frontiers in Psychology — “Gender Differences in Personality across the Ten Aspects of the Big Five”; sex differences in Extraversion diverge at the aspect level, rendering the global difference small or undetectable (women higher Enthusiasm/warmth, men higher Assertiveness).
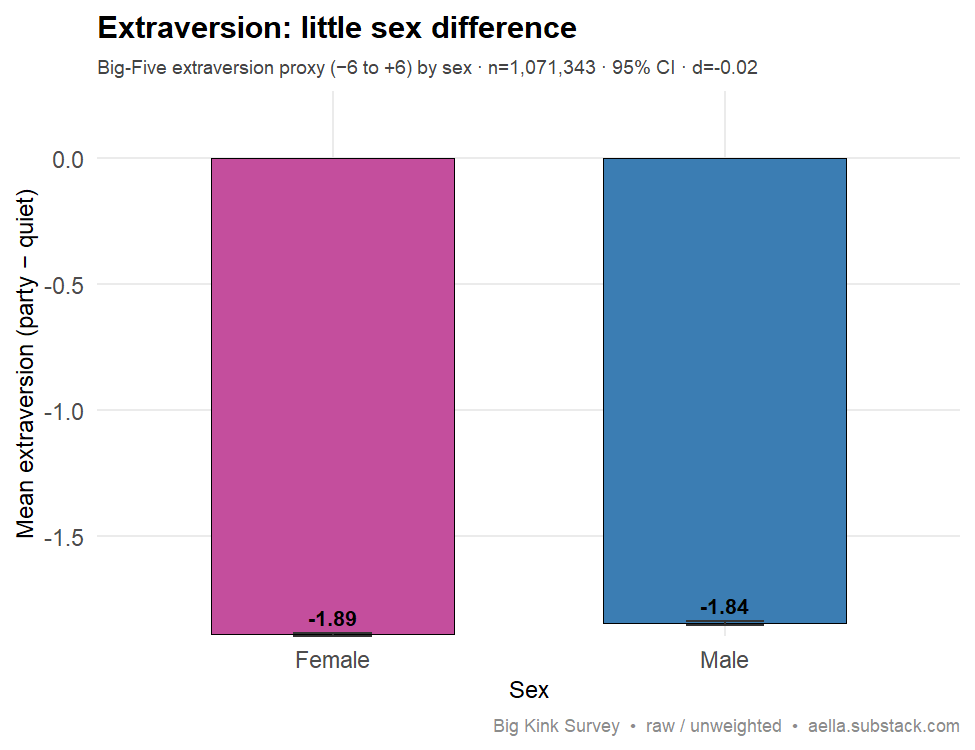
Your data: on a 2-item extraversion proxy ("I am the life of the party" minus "I am quiet around strangers", scored −6 to +6), women average −1.89 (95% CI −1.90 to −1.88, n=665,971) and men average −1.84 (95% CI −1.85 to −1.84, n=405,372), total n=1,071,343 (raw/unweighted, since sex is a raking variable). The gap is 0.05 scale points — Cohen's d = −0.02, i.e. statistically detectable (p≈9e-16) only because the sample is over a million people, but practically nil. This is a clean replication of the predicted near-null global sex difference. Caveats: self-report, cross-sectional, and a 2-item proxy is a coarse stand-in for full-Big-Five extraversion — it can't speak to the warmth-vs-assertiveness facet split where literature does expect divergence.
Survey question(s) asked
- “I am the life of the party” — Totally agree (+3) / Agree (+2) / Somewhat agree (+1) / Neither agree nor disagree (0) / Somewhat disagree (−1) / Disagree (−2) / Totally disagree (−3)
- “I am quiet around strangers” — same 7-point agreement scale
- “Which category fits you best?” — Man (cis) / Man (trans) / Woman (cis) / Woman (trans) / Nonbinary/other (assigned male at birth) / Nonbinary/other (assigned female at birth)
- The extraversion proxy = “I am the life of the party” minus “I am quiet around strangers” (range −6 to +6). Women/men are grouped by sex assigned at birth from the category item.
Narcissism, drive & non-monogamy, by sex
193. Narcissism: men > women Replicates
The claim: Men score reliably higher than women in narcissism.
Best: Grijalva et al. (2015), Psychological Bulletin (meta-analysis, n > 475k) — men score modestly but reliably higher in narcissism than women.
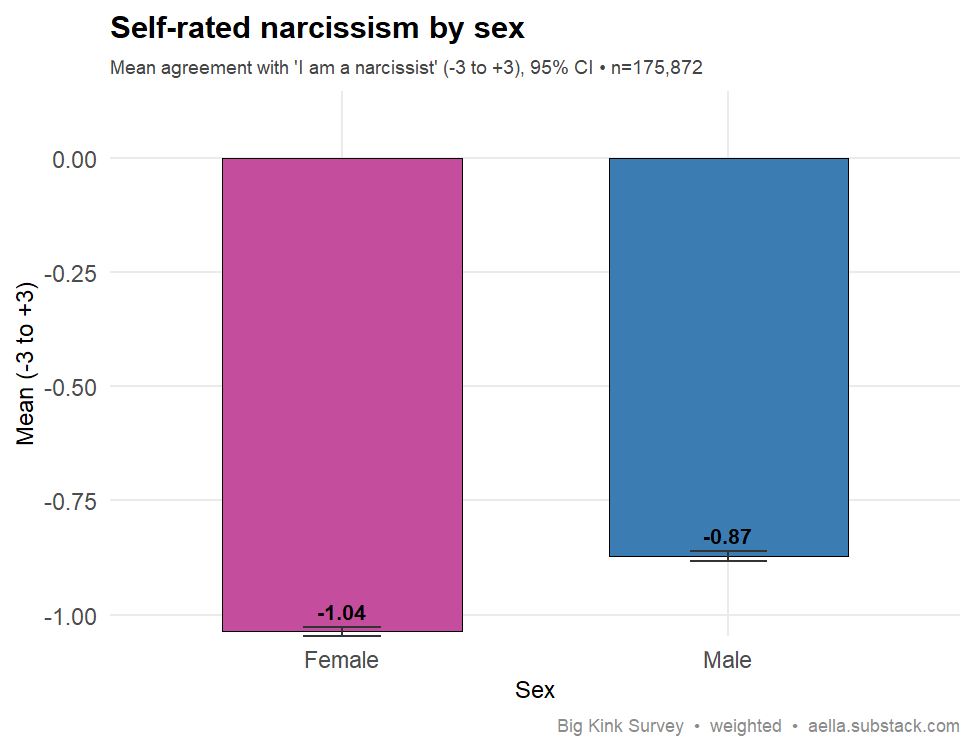
Your data: men agree more with "I am a narcissist" (mean -0.87, 95% CI [-0.88, -0.86], n=79,265) than women (mean -1.04, 95% CI [-1.05, -1.03], n=96,607); difference 0.17 points on a -3 to +3 scale, t=20.8, p<2.2e-16, n=175,872. The predicted direction (men > women) holds, but the effect is small (Cohen's d=0.10, vs the meta's d≈0.26). Both sexes lean toward disagreeing — men just disagree less. Adjusting for age widens the gap rather than explaining it (age-adjusted M-F diff 0.28), so age is not a confound here. Limitations: a single coarse self-label item, self-report, raw/unweighted, and cross-sectional.
Survey question(s) asked
- “To what extent do you agree with this statement: I am a narcissist.” — Totally agree (+3) / Agree (+2) / Somewhat agree (+1) / Neither agree nor disagree (0) / Somewhat disagree (−1) / Disagree (−2) / Totally disagree (−3) (tip: “Note: The word 'narcissist' means egotistical, self-focused, and vain.”)
- “Which category fits you best?” — Man (cis) / Man (trans) / Woman (cis) / Woman (trans) / Nonbinary/other (assigned male at birth) / Nonbinary/other (assigned female at birth)
- A single self-label item (the tip's definition narrows the construct vs NPI-style narcissism inventories). It was added to the survey in Nov 2025, so only later respondents saw it — hence the smaller n than other sex-difference cards. Men/women are grouped by sex assigned at birth.
194. Men more motivated to seek real-life sex Replicates
The claim: Men report greater unrestricted sociosexuality, including stronger motivation to pursue real-life sexual encounters.
Best: Schmitt (2005), Behavioral & Brain Sciences, 28(2), 247–275 — 48-nation study finding sex differences in unrestricted sociosexuality are large and cross-culturally universal (men higher). Cambridge Core. Backup: Simpson & Gangestad (1991), Journal of Personality and Social Psychology — original Sociosexual Orientation Inventory (SOI) validation.
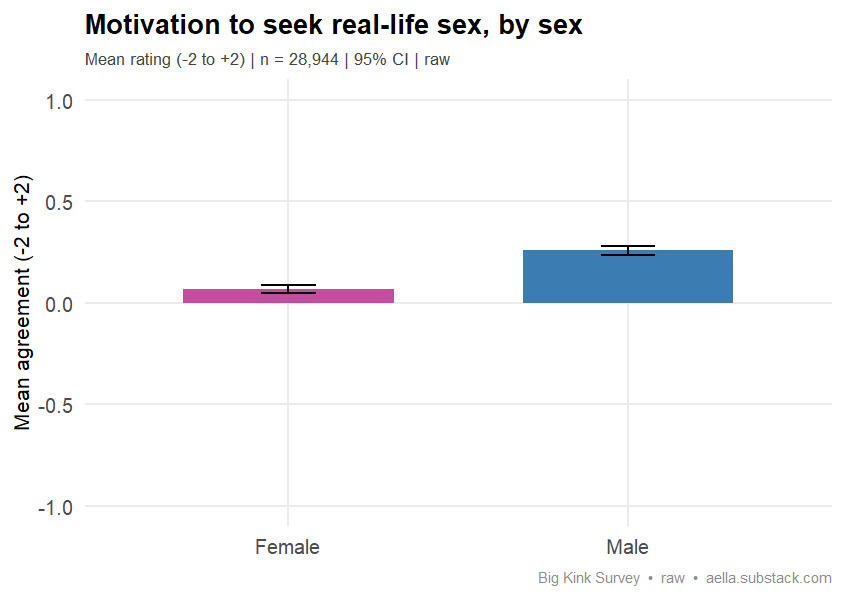
Your data: on the item "I am very motivated to seek out real-life sexual encounters" (-2 to +2), men averaged 0.26 (95% CI 0.24-0.28, n=13,875) versus 0.07 for women (95% CI 0.05-0.09, n=15,069); total n=28,944. The male-female gap of 0.19 points is highly significant (p≈4e-41) and points in the predicted direction. The difference survives adjustment for age (age-controlled sex coefficient 0.18, p≈2e-34), so it is not driven by the age composition of the two groups. The effect size is small (Cohen's d≈0.16). This replicates Schmitt's (2005) cross-national finding that men are more unrestricted in sociosexuality. Limitations: single self-report item, cross-sectional and correlational; raw (unweighted) data; sample skews young (median age 20).
Survey question(s) asked
- “I am very motivated to seek out real-life sexual encounters” — Strong disagree (−2) / Disagree (−1) / Neutral (0) / Agree (+1) / Strong agree (+2)
- “Which category fits you best?” — Man (cis) / Man (trans) / Woman (cis) / Woman (trans) / Nonbinary/other (assigned male at birth) / Nonbinary/other (assigned female at birth)
- This item was added to the survey in May 2026, so only late-fielding respondents saw it — hence the much smaller (and younger) n than other sex-difference cards. Men/women are grouped by sex assigned at birth.
195. Men prefer non-monogamy more Replicates
The claim: Men are more open to non-monogamy / polyamorous relationship styles than women.
Best: Moors, Gesselman & Garcia (2021), Frontiers in Psychology — in a national U.S. sample, men were nearly three times more likely than women to report a desire to engage in polyamory, and over twice as likely to report prior engagement. link Backup: Schmitt (2005), Behavioral and Brain Sciences — 48-nation study finding men report substantially more unrestricted sociosexuality (greater openness to sex outside committed relationships).
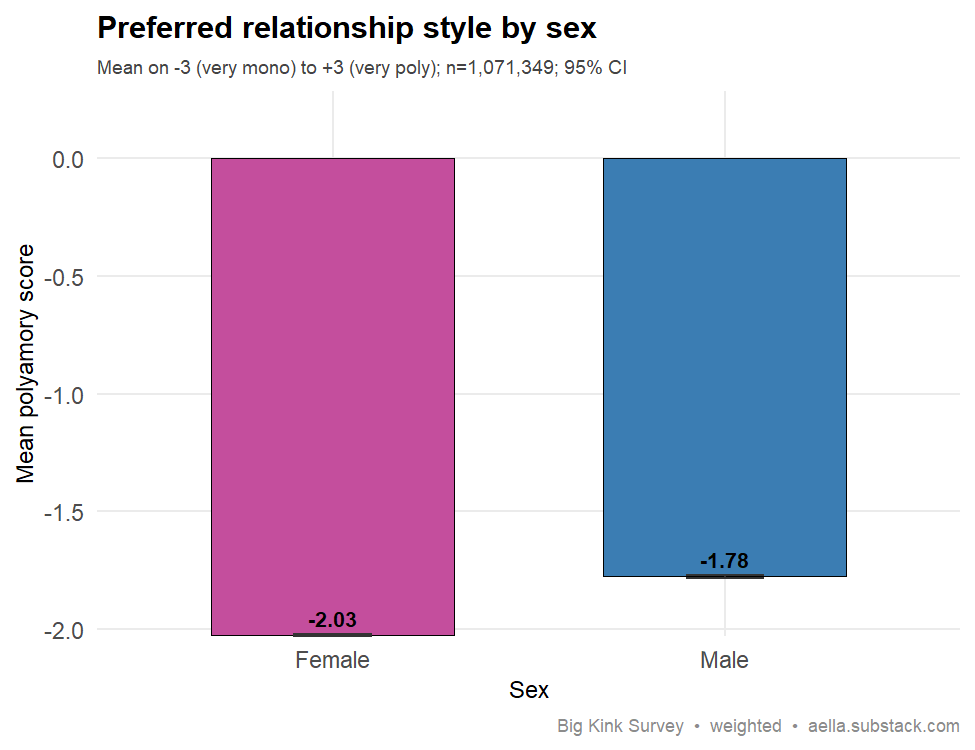
Your data: on a -3 (very monogamous) to +3 (very polyamorous) scale, men average -1.78 (95% CI -1.78 to -1.77) versus -2.03 for women (95% CI -2.03 to -2.02), a 0.25-point gap in the predicted direction (Welch t = -75.5, p < 2.2e-16, n = 1,071,349). On a binary cut, 12.5% of men but only 8.7% of women lean at least slightly polyamorous. Men are reliably more open to non-monogamy, matching Schmitt (2005) and Conley et al. (2011). The difference is small but extremely robust given the sample size. Caveats: both sexes skew strongly monogamous (a kink-recruited, non-representative sample, so absolute levels shouldn't be read as population rates); single-item, self-report, cross-sectional; raw/unweighted since sex is a raking variable.
Survey question(s) asked
- “Personally, your preferred relationship style is:” — Very monogamous (−3) / Somewhat monogamous (−2) / Slightly monogamous (−1) / Halfway between mono/poly (0) / Slightly polyamorous (+1) / Somewhat polyamorous (+2) / Very polyamorous (+3) (tip defines monogamy as expecting no outside sexual/romantic intimacy and polyamory as allowing it)
- “Which category fits you best?” — Man (cis) / Man (trans) / Woman (cis) / Woman (trans) / Nonbinary/other (assigned male at birth) / Nonbinary/other (assigned female at birth)
- Men/women are grouped by sex assigned at birth from the category item (e.g. trans women count as Male, trans men as Female).
Sex differences in fantasy
196. Sex → 'free use' fantasy endorsement Replicates
The claim: Men more often eroticize low-negotiation 'free use' (open sexual access) fantasies than women.
Best: Schmitt et al. (2003), "Universal sex differences in the desire for sexual variety," J. Personality & Social Psychology 85(1):85–104 — across 52 nations, men more than women desire sexual variety and want sex sooner with less investment/negotiation (PubMed). Backup: Clark & Hatfield (1989), J. Psychology & Human Sexuality — men far more receptive than women to immediate, no-negotiation casual-sex offers.
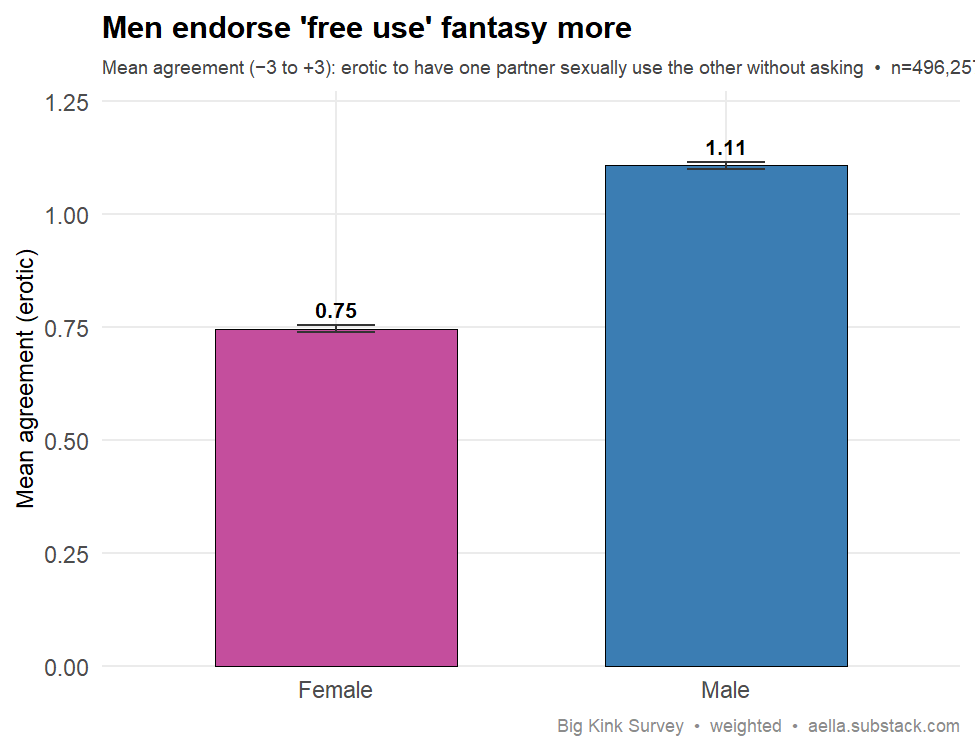
Your data: On a −3 to +3 agreement scale ("I find free-use dynamics — one partner can sexually use the other without asking — erotic"), men average 1.11 [1.10, 1.11] vs women 0.75 [0.74, 0.75] (Welch t=−66.9, p<2.2e-16; n=227,757 men / 268,500 women, unweighted). At the endorsement threshold (any agreement, >0), 71.0% [70.8, 71.2] of men vs 63.8% [63.6, 64.0] of women find it erotic. The men>women direction matches Lehmiller's prediction and the gap is sizable and highly significant. Caveats: self-report, cross-sectional, single item; ~54% of respondents have no answer (survey branch missingness, treated as missing not as 0 — the scale carries its own 0 midpoint).
Survey question(s) asked
- “I find personal freeuse dynamics, arrangements where one partner can sexually "use" the other without asking or negotiating, to be erotic” — Totally agree (+3) / Agree (+2) / Somewhat agree (+1) / Neither agree nor disagree (0) / Somewhat disagree (−1) / Disagree (−2) / Totally disagree (−3)
- “Which category fits you best?” — Man (cis) / Man (trans) / Woman (cis) / Woman (trans) / Nonbinary/other (assigned male at birth) / Nonbinary/other (assigned female at birth)
- “Men” and “women” here are birth sex derived from this category item. The freeuse item was added partway through the survey’s run, so roughly half of respondents (earlier takers) never saw it; they are treated as missing, not as 0.
197. Group / multi-partner sex arousal → higher in men Weak (age-confounded)
The claim: Men more often find multi-partner / group-sex scenarios arousing (Lehmiller 2018: multipartner sex is among the most common fantasies and is male-skewed in intensity).
Best: Ellis, B. J. & Symons, D. (1990), “Sex Differences in Sexual Fantasy: An Evolutionary Psychological Approach,” Journal of Sex Research, 27(4): 527–555 — men report fantasies involving partner variety and group sex far more than women (male:female ratio of roughly 4.2 on the group-sex item). Backup: Joyal, Cossette & Lapierre (2015), Journal of Sexual Medicine, 12(2): 328–340 — group sex / multiple-partner scenarios are among the most commonly reported fantasies and are reported more often by men; see also Lehmiller, J. J. (2018), Tell Me What You Want.
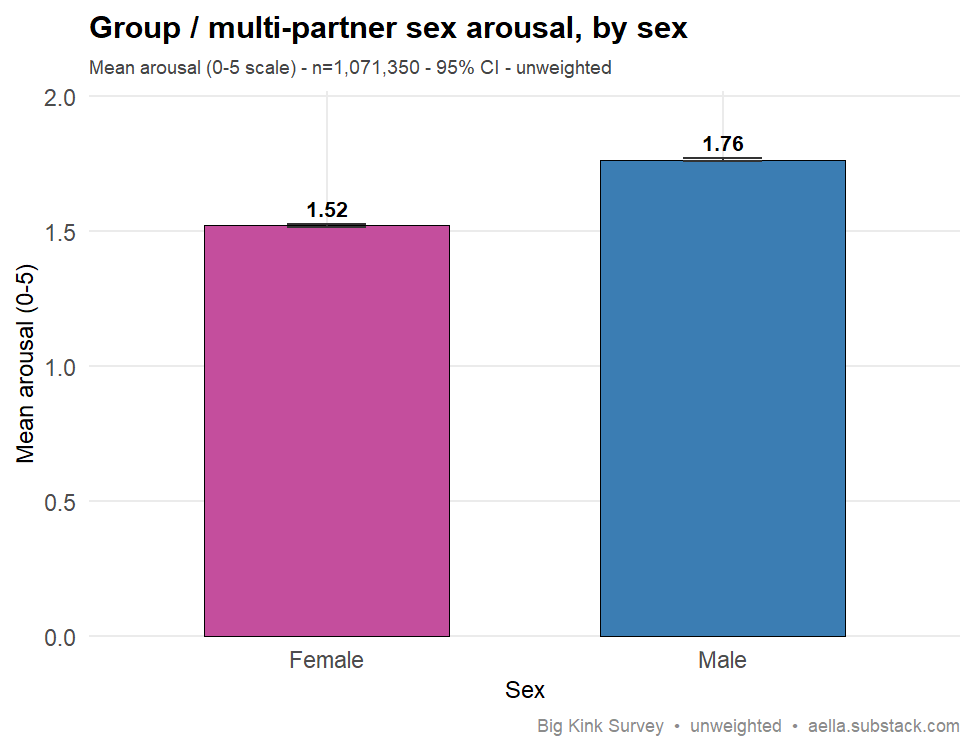
Your data: on the "I find sexual scenarios involving multiple partners to be…" arousal item (0-5, non-endorsers coded 0; full sample, n=1,071,350), men averaged 1.76 [95% CI 1.76-1.77] vs women 1.52 [1.51-1.52] . The raw gap is +0.24 points male-higher (d ≈ 0.12, p<1e-300), but age composition — which does confound it — absorbs most of that: controlling for current age (factor(age_int)), the male advantage is +0.06 points (d ≈ 0.03, still p<1e-60). The direction is reliably male-higher, but the magnitude is far below the literature's large male skew (Ellis & Symons report a roughly 4:1 male:female ratio on group-sex fantasy), so this is direction-only support rather than a replication of the effect size. Self-report, cross-sectional, non-probability sample; "multiple partners" pools several sub-fantasies (threesomes, swinging, orgies, etc.).
Survey question(s) asked
- “Common things: Check all the following categories that contain a thing that arouses you.” — checklist; the relevant category is “Multiple partners (hotwifing, gangbangs, freeuse, threesomes, etc.)”
- “I find sexual scenarios involving multiple partners to be:” (tip: “If you find one specific type of multiple partner scenario to be erotic (for example, gangbangs, cuckolding, freeuse, etc.), then answer with just that in mind, not the whole category.”) — Not arousing / Slightly arousing / Somewhat arousing / Moderately arousing / Very arousing / Extremely arousing
- “Which category fits you best?” — Man (cis) / Man (trans) / Woman (cis) / Woman (trans) / Nonbinary/other (assigned male at birth) / Nonbinary/other (assigned female at birth); analyzed as birth sex (Male/Female)
- The arousal item was only shown to respondents who checked the “Multiple partners” category; respondents who didn’t check it are counted as 0 (“Not arousing”) by design. Raw response values {0,1,2,3,5,8} are stored as an ordinal 0–5 scale in the cleaned data.
Attachment style, by sex
198. Attachment style by sex Mixed
The claim: Women are modestly higher in anxious attachment and men higher in avoidant attachment (Del Giudice 2011 meta-analysis).
Best: Del Giudice (2011), Personality and Social Psychology Bulletin, 37(2), 193–214 — meta-analysis (113 samples, N = 66,132): women higher in attachment anxiety, men higher in attachment avoidance.
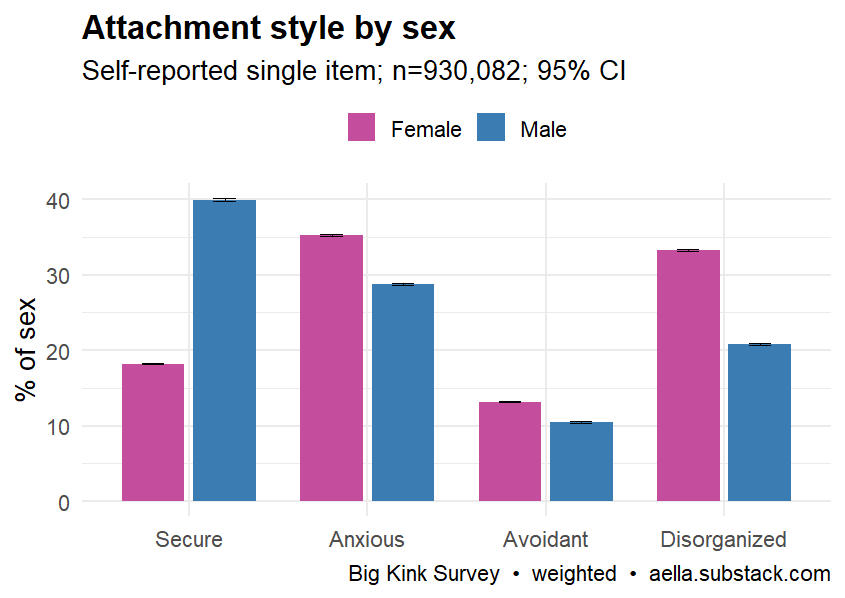
Your data: Among respondents picking one of the four styles (n=930,082 raw/unweighted; 583,924 women, 346,158 men), women report Anxious more than men (35.3% vs 28.8%; difference +6.5pp, 95% CI 6.3-6.7pp) — matching the prediction. But the avoidant half reverses: women report Avoidant MORE than men (13.2% vs 10.5%; +2.7pp, 95% CI 2.6-2.8pp), the opposite of the predicted men-higher pattern. Instead, men are far more likely to call themselves Secure (40.0% vs 18.2%) and women far more likely Disorganized (33.3% vs 20.8%). Overall sex difference is large and significant (chi-sq=55,111, df=3, p<2e-16). Verdict: mixed — anxious replicates, avoidant reverses. Caveats: this is a single-item self-labeled categorical measure (each person picks exactly one mutually-exclusive style), which is much coarser than and not directly comparable to the continuous ECR anxiety/avoidance dimensions Del Giudice meta-analyzed; "Don't know/not sure" (n≈141k) was excluded. Self-report, cross-sectional, correlational; raw unweighted (sex is a raking variable so weighting was inappropriate).
Survey question(s) asked
- “What's your attachment style?” (tip: “Attachment style is the way you typically relate to relationships, usually romantic”) — Don't know/not sure / Avoidant (avoidant/distant/commitment fears) / Anxious (codependent/clingy/abandonment fears) / Disorganized (mix of Avoidant and Anxious) / Secure (comfortable with intimacy)
- “Which category fits you best?” — Man (cis) / Man (trans) / Woman (cis) / Woman (trans) / Nonbinary/other (assigned male at birth) / Nonbinary/other (assigned female at birth); analyzed as birth sex (Male/Female)
- Respondents pick exactly one style; “Don't know/not sure” answers (≈141k) were excluded from the four-way percentages.
Mental health, by sex
199. OCD → small sex difference? Replicates
The claim: Adult OCD is roughly equally prevalent across sexes, with only a slight female skew.
Best: Fawcett, Power & Fawcett (2020), J. Clin. Psychiatry 81(4):19r13085 — meta-analysis of 34 community studies: lifetime OCD ~1.5% in women vs ~1.0% in men (~1.6x), a small but consistent female preponderance in adults. link Backup: Ruscio, Stein, Chiu & Kessler (2010), Molecular Psychiatry 15(1):53-63 — NCS-R: odds of OCD onset ~2.1x higher in females (males skew earlier-onset). link
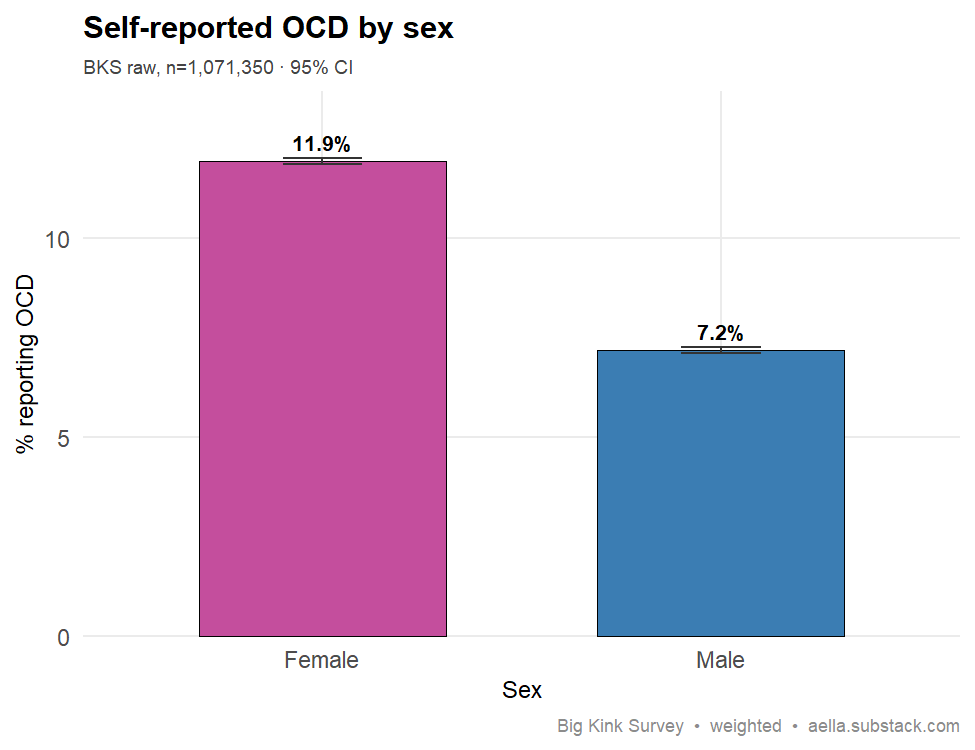
Your data: 11.9% of women (79,385/665,974) vs 7.2% of men (29,111/405,376) self-report moderate-to-severe OCD — a 4.7pp gap (95% CI 4.6–4.9pp), p<2e-16, n=1,071,350 (raw, unweighted). The female:male ratio is 1.66x (95% CI 1.64–1.68), an almost exact match to Fawcett et al.'s ~1.6x meta-analytic adult skew — the absolute levels run ~8x the clinical lifetime rates because a self-report checkbox sets a far lower bar than a diagnosis, but the relative skew replicates cleanly. Population-weighted the picture is the same (11.5% vs 6.6%, 1.74x). Ruscio et al.'s "roughly equal" adult framing fits less well. Limitations: self-reported presence (checkbox tip "moderate to severe"), not a clinical diagnosis; cross-sectional, correlational; a kink-survey sample where women may over-endorse mental-health items, plausibly widening the gap.
Survey question(s) asked
- “Do you have any of the following” (checkbox list of 19 conditions; tip: “Please only check if they're 'moderate to severe'”) — ‘OCD’ box checked vs not checked
- “Which category fits you best?” — Man (cis) / Man (trans) / Woman (cis) / Woman (trans) / Nonbinary/other (assigned male at birth) / Nonbinary/other (assigned female at birth); analyzed as birth sex (Male/Female)
- Self-reported presence of the condition, not a diagnosis question; respondents who left the box unchecked are counted as “no.”
200. ADHD by sex → men higher? Reversed
The claim: ADHD is more commonly reported in men, though the adult sex gap is narrower than in childhood.
Best: Willcutt (2012), Neurotherapeutics 9(3):490–499, doi:10.1007/s13311-012-0135-8 — meta-analytic review of DSM-IV ADHD prevalence; reports a male-skewed sex ratio (about 3:1 in community samples of youth), with adult samples consistently showing a narrower male-to-female gap than childhood samples.
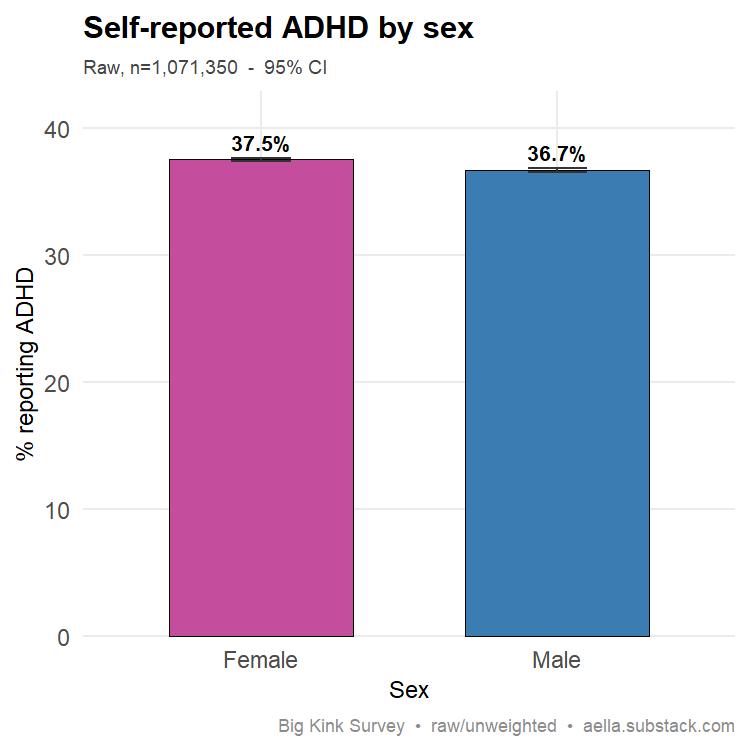
Your data: self-reported moderate-to-severe ADHD is essentially flat by sex, and if anything slightly higher in women: 37.5% of women (249,993/665,974) [95% CI 37.4-37.7] vs 36.7% of men (148,901/405,376) [36.6-36.9], n=1,071,350 (raw/unweighted). The predicted male skew is not seen — the gap is reversed (women ≥ men by ~0.8 pp). With ~1.07M respondents the difference is statistically "significant" (non-overlapping CIs) but the effect is trivially small, so the honest read is that sex is essentially unrelated to ADHD self-report here, with no male advantage. This contradicts the childhood-clinical male skew of Willcutt (2012). Likely a self-selection/self-report artifact: clinical/childhood ADHD samples are heavily male, but adult self-reported ADHD gaps narrow or vanish, and a kink-survey audience may further flatten or invert it (women's adult ADHD is historically under-diagnosed and may be over-represented in self-report). Limitations: self-report checkbox (no clinical confirmation), correlational, cross-sectional, non-representative sample.
Survey question(s) asked
- “Do you have any of the following” (checkbox list of 19 conditions; tip: “Please only check if they're 'moderate to severe'”) — ‘ADHD’ box checked vs not checked
- “Which category fits you best?” — Man (cis) / Man (trans) / Woman (cis) / Woman (trans) / Nonbinary/other (assigned male at birth) / Nonbinary/other (assigned female at birth); analyzed as birth sex (Male/Female)
- Self-reported presence of the condition, not a diagnosis question; respondents who left the box unchecked are counted as “no.”
Background: debut & upbringing
201. Earlier sexual debut → more partners Replicates
The claim: Earlier age at first penetrative sex predicts more lifetime sexual partners.
Best: Sandfort, Orr, Hirsch & Santelli (2008), American Journal of Public Health 98(1):155–161, 10.2105/AJPH.2006.097444 — early initiation of sexual intercourse was associated with an increased number of sexual partners.
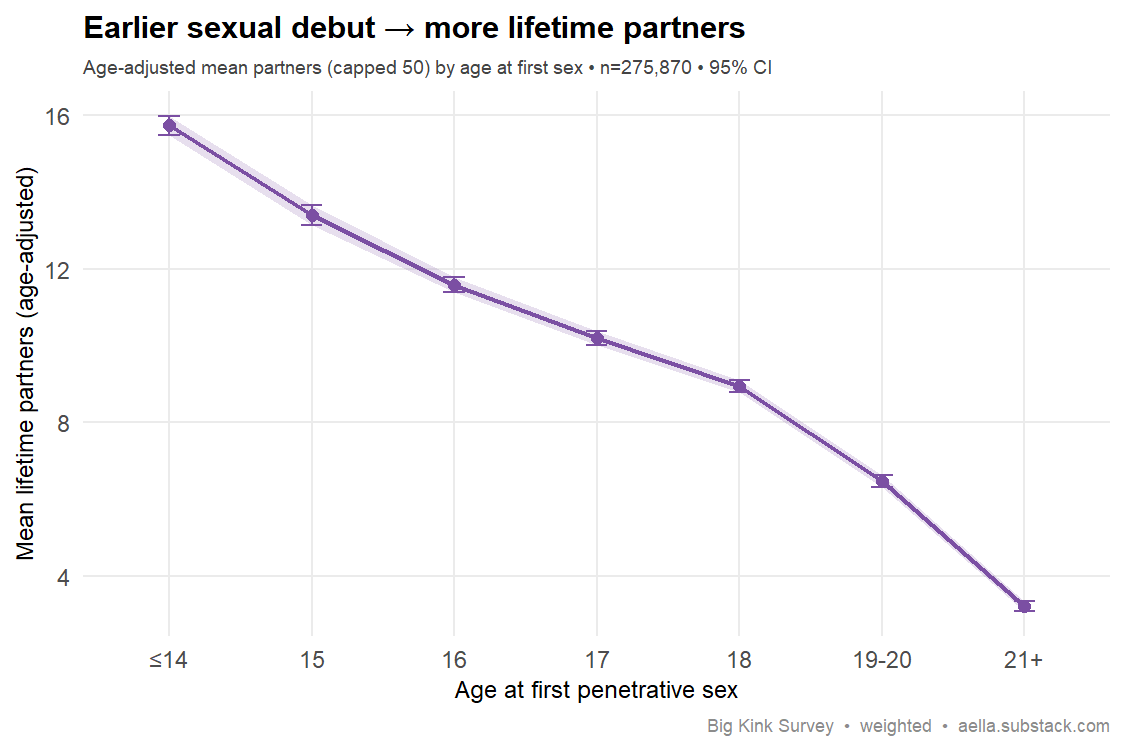
Your data: a clean, monotonic dose-response. After adjusting for each respondent's current age (so this isn't just older people having had more time), mean lifetime partners (capped at 50) falls from 15.7 for those who debuted at age 14 or younger, to 11.6 at 16, 8.9 at 18, and just 3.2 for those who debuted at 21+ (n=275,870, 95% CI bands tight and non-overlapping across bins). Each extra year of delayed debut is associated with ~1.3 fewer lifetime partners (p<0.001); weighted partial correlation r=-0.33. Notably, controlling for current age strengthens the gradient rather than explaining it away, ruling out the main confound. The prediction's direction (earlier debut → more partners) holds robustly. Caveats: self-report, cross-sectional and correlational (no causal claim — earlier debut and more partners may share common causes like sociosexuality or sensation-seeking), and lifetime-partner counts are right-censored at 50.
Survey question(s) asked
- “At what age did you first have penetrative sexual intercourse?” — I haven't had sex / 12 or younger / 13 / 14 / … / 25 / 26-30 / 31-35 / 36-40 / 41+
- “How many people have you had sex with?” (tip: “By your definition of 'sex' - this typically means penetration, and sometimes includes oral sex.”) — free number entry
- “How old are you?” — free number entry (used only to adjust for current age)
- Banded debut options are coded to single values (12 or younger → 11, 26-30 → 28, 31-35 → 34, 36-40 → 38, 41+ → 45); the analysis kept debut ages 8-40, excluded “I haven't had sex,” and capped lifetime partner counts at 50.
202. Repressive upbringing → less porn use Weak / tiny effect
The claim: A sexually repressive or conservative upbringing predicts less pornography use in adulthood.
Best: Rasmussen & Bierman (2016), How does religious attendance shape trajectories of pornography use across adolescence?, Journal of Adolescence — higher religious attendance predicts weaker/lower pornography-use trajectories across adolescence. Backup: see e.g. Perry & Hayward (2017), Social Forces, on the religiosity–pornography link (note: effects are clearest for individual religiosity; conservative community context can run the other way).
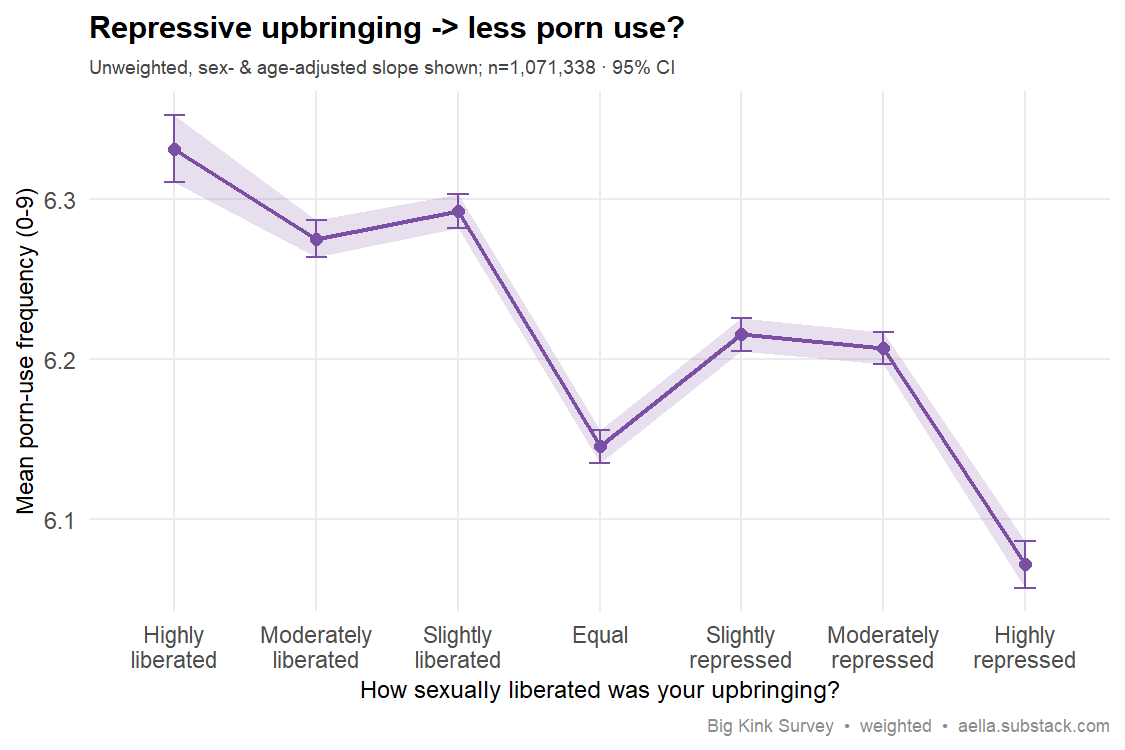
Your data: among 1,071,338 respondents, a more repressed upbringing predicts slightly less porn use, controlling for sex and age (slope -0.022 points of porn-frequency per upbringing step, 95% CI [-0.024, -0.019], p<1e-60; raw r = -0.023). The direction matches the literature, and it holds in both sexes (women -0.024, men -0.016). But the effect is trivially small: across the full 6-step range from "highly liberated" to "highly repressed," mean porn-use frequency moves only from ~6.33 to ~6.07 on a 0-9 scale. The gradient is also non-monotonic — the neutral "equal" group sits unusually low (6.15), a midpoint artifact rather than a clean dose-response. So the claim replicates in sign but is far weaker than a "repressive upbringing suppresses porn use" framing implies. Self-report, correlational, cross-sectional; upbringing is a single retrospective item and current religiosity (finding #48) is not controlled here.