TL;DRThe pre-dawn window really does select for a different kind of person.
People who start a long sex survey between roughly 2am and 6am local time report more mental illness across nearly every condition measured — with the biggest relative spikes in the rarer, heavier diagnoses (schizophrenia, substance abuse, borderline, bipolar). They're also more likely to be single, slightly more trans/nonbinary, less exclusively heterosexual, hornier, kinkier, and heavier. These effects survive controlling for age, gender, region, survey year, and weekend — and replicate independently in the US, UK, Canada, Europe, Australia, and Latin America.
Meanwhile some of the flashiest raw patterns are confounders in disguise: early-morning submitters average 7.2 lifetime sex partners against ~4.4 at 1am, which looks wild until you notice the 7am crowd is simply three years older — adjust for age and gender and the entire effect evaporates.
01The shape of the day
Every submission carries a UTC start timestamp, and respondents say what country they live in — with the US split into east / south / middle-north / west regions. That's enough to place nearly everyone in an approximate local timezone (details in Methods). N = 1,237,246 submissions from 2017–2026, ages 14–80, spanning North America, Europe, Australia, Latin America, Asia, and Russia.
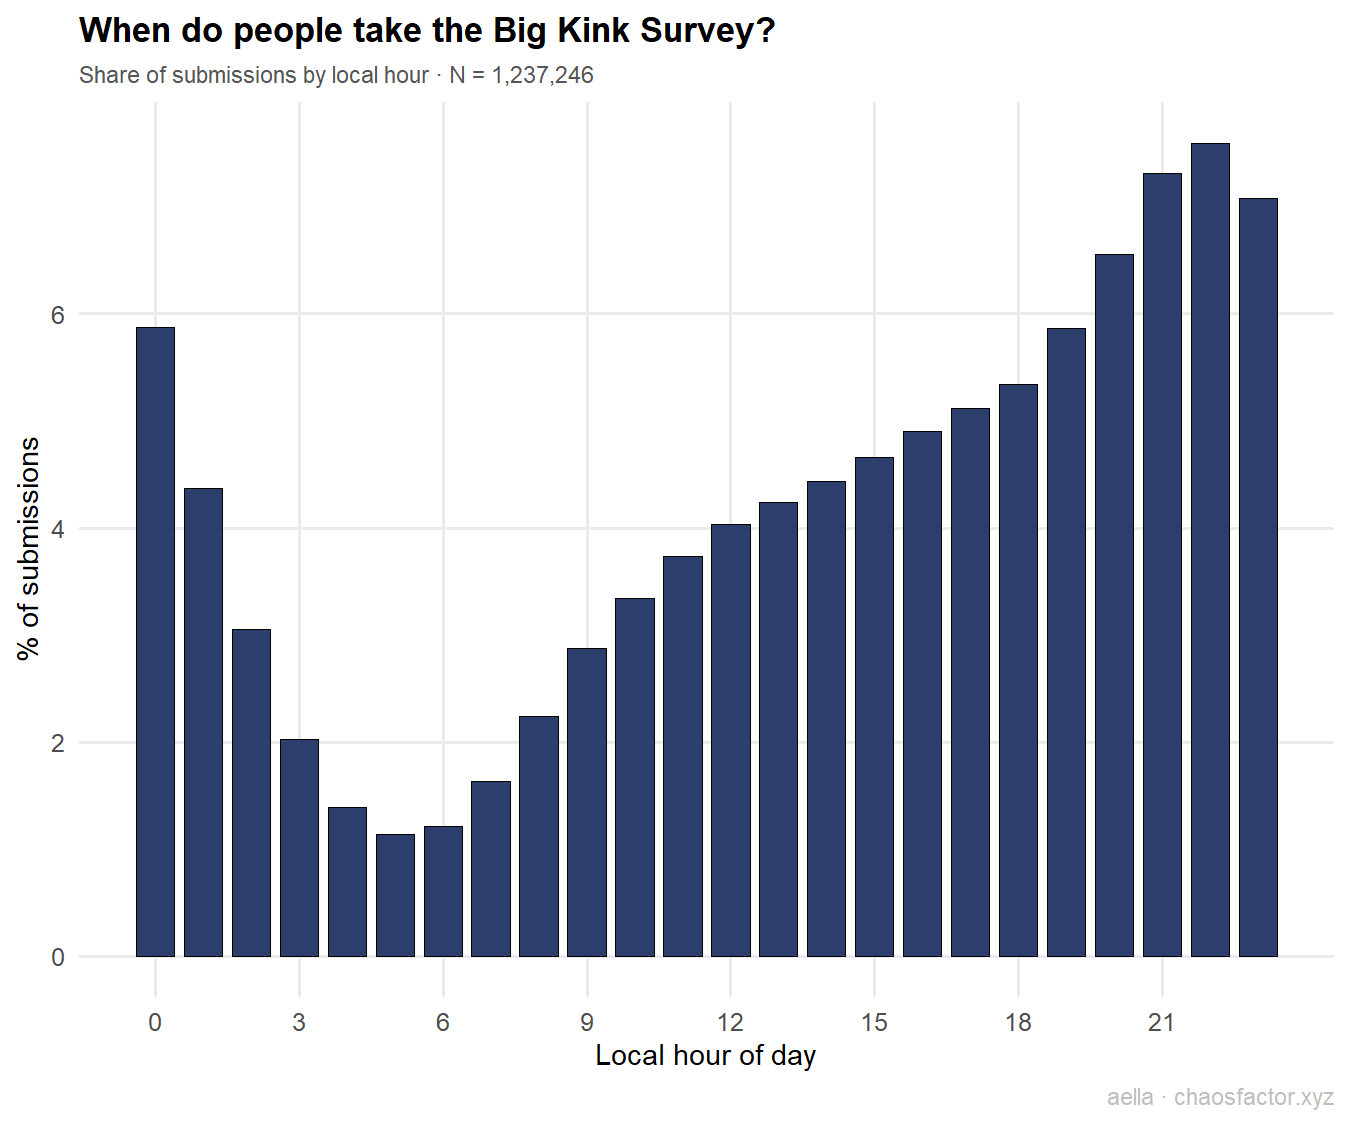
The rhythm is what you'd expect for a survey spread through social media: volume climbs all evening, peaks at 10–11pm (7.6% of all submissions in the 10pm hour), decays through the night, and bottoms out at 5am (1.1%). The 2–6am window holds 8.8% of all submissions — about 109,000 people, so the "small" hours still have enormous samples.
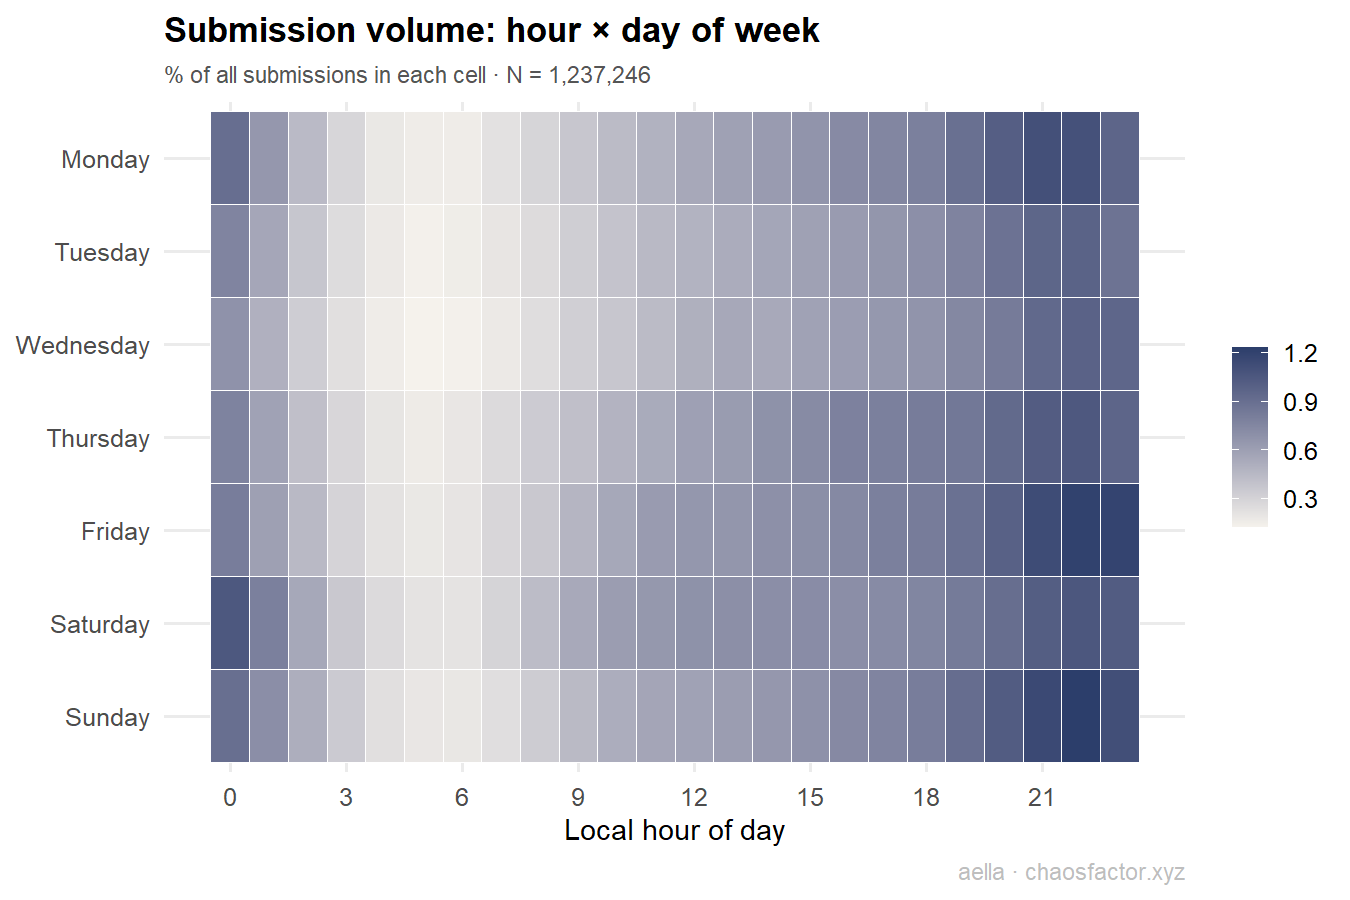
Day-of-week barely matters compared to hour-of-day: weekend late nights run a little hotter (Friday and Saturday nights bleed further into the early morning), but the vertical banding shows the daily cycle dominates.
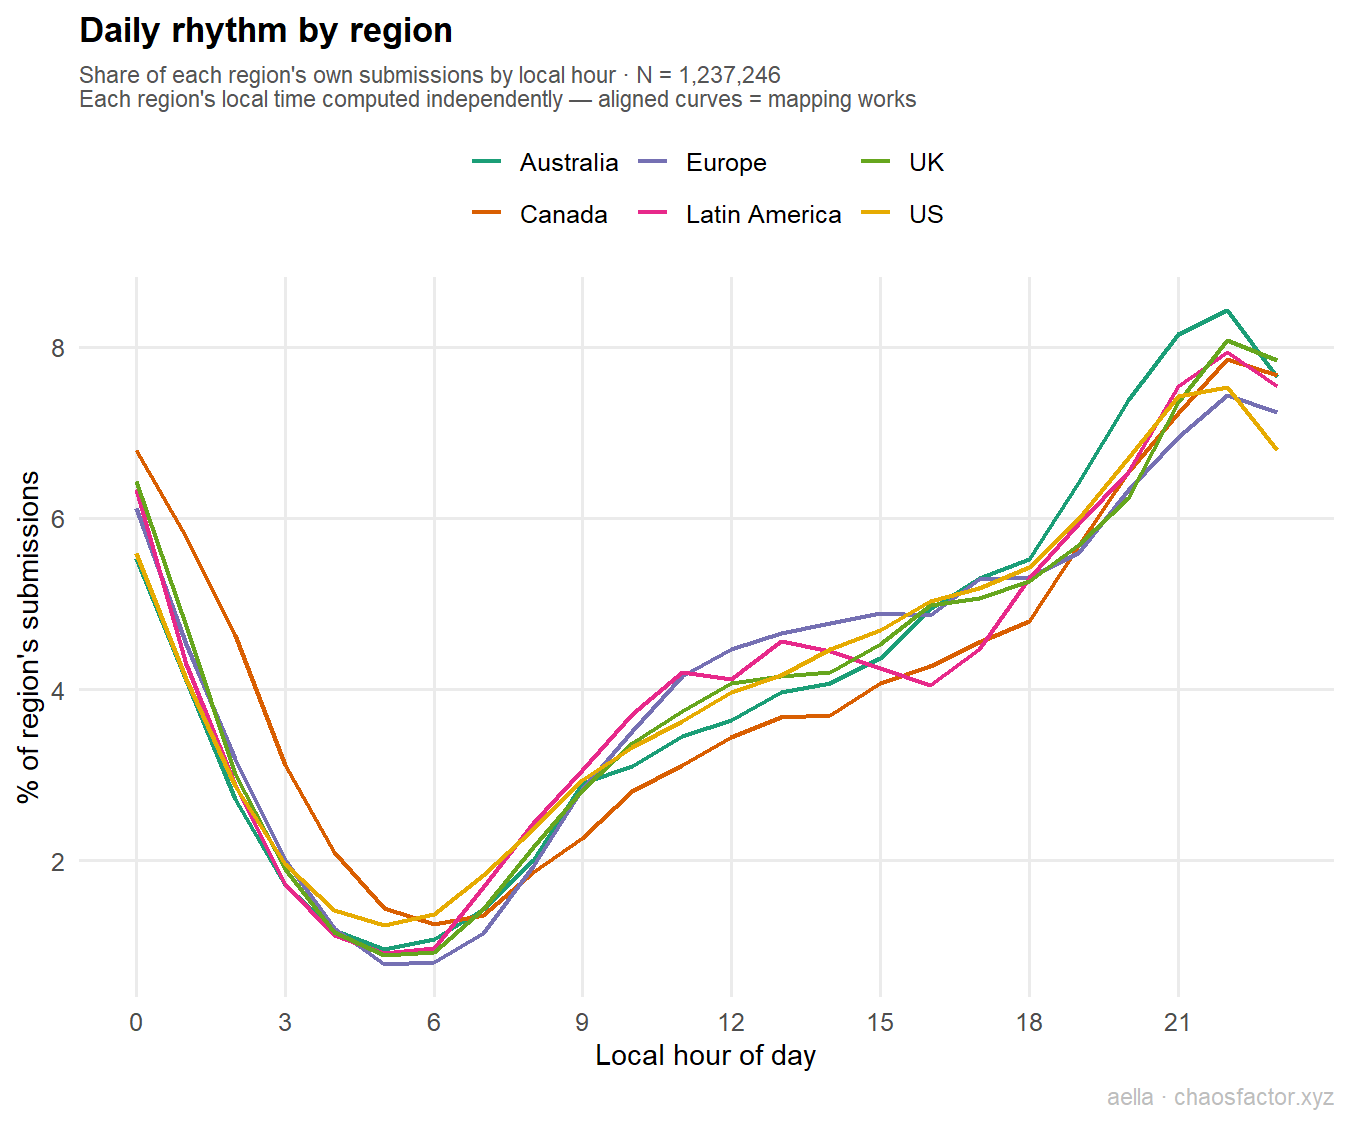
This chart is secretly a sanity check. Each region is mapped to local time completely independently — the US at UTC−5 to −8, the UK at 0, Europe at +1, Latin America at −3 to −6, and Australia all the way out at UTC+10 with its daylight-saving flipped to the opposite half of the year — and all six produce nearly identical daily curves, with the trough landing at 5–6am in each. If the timezone mapping were broken, these curves would be shifted copies of each other instead of aligned.
02Who's awake when
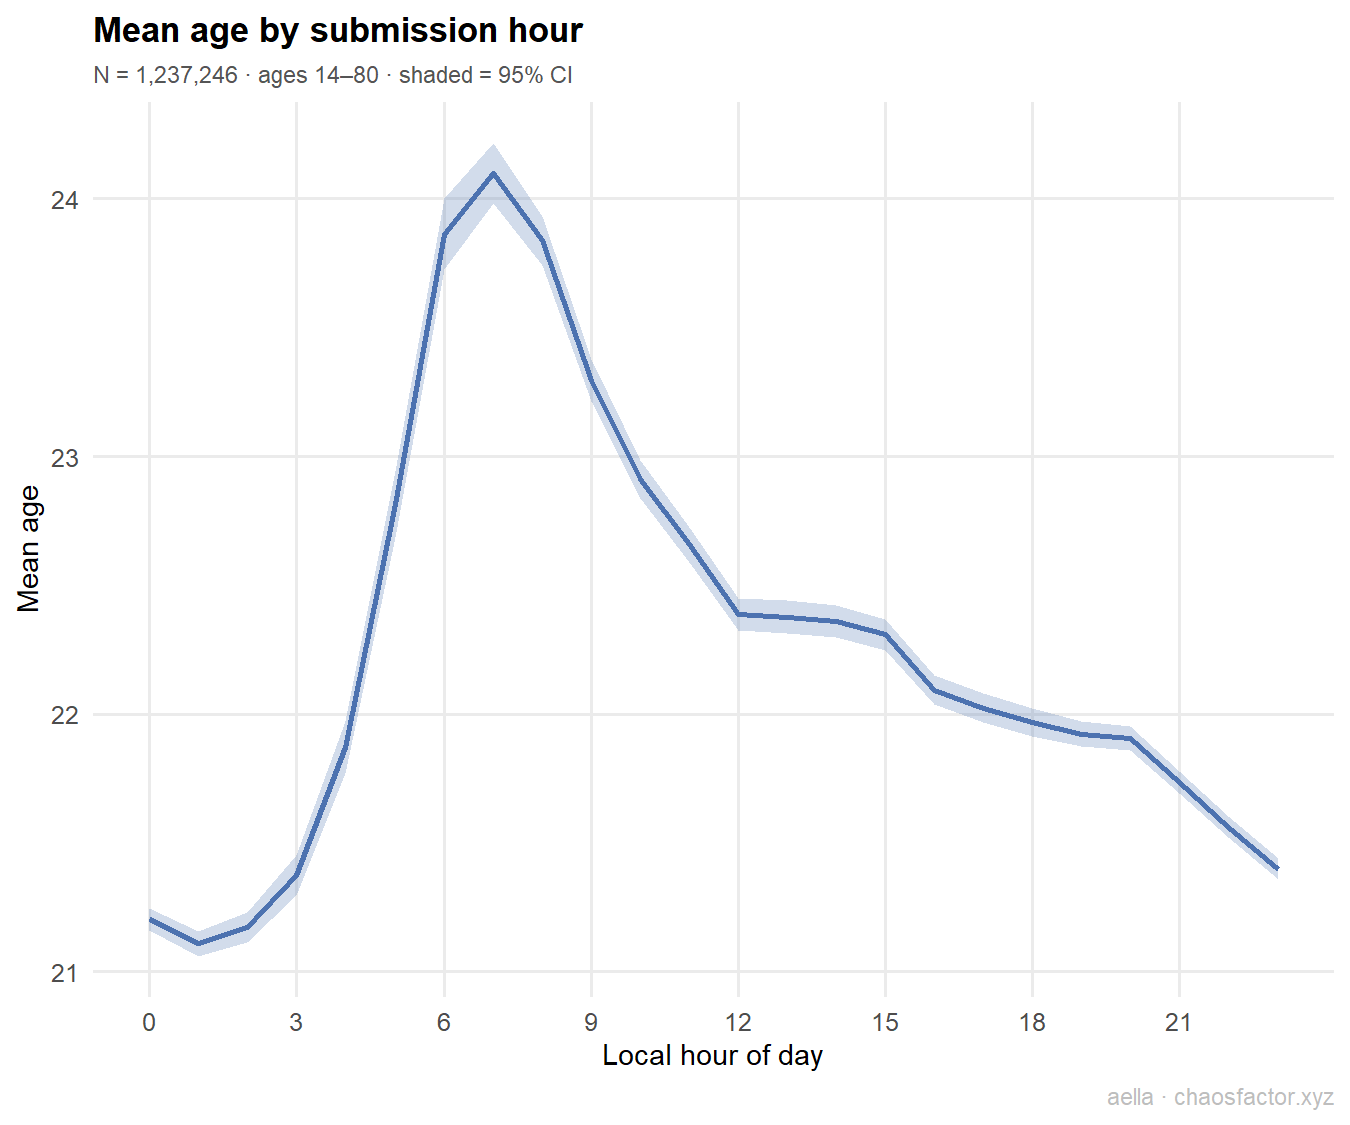
Age has the sharpest time signature of anything in this report. The 1am crowd averages 21.1 years old; the 7am crowd averages 24.1. The morning bump is presumably employed adults catching the survey before work, while the after-midnight hours belong to the young. Remember this chart — it's the confounder behind several "effects" later.
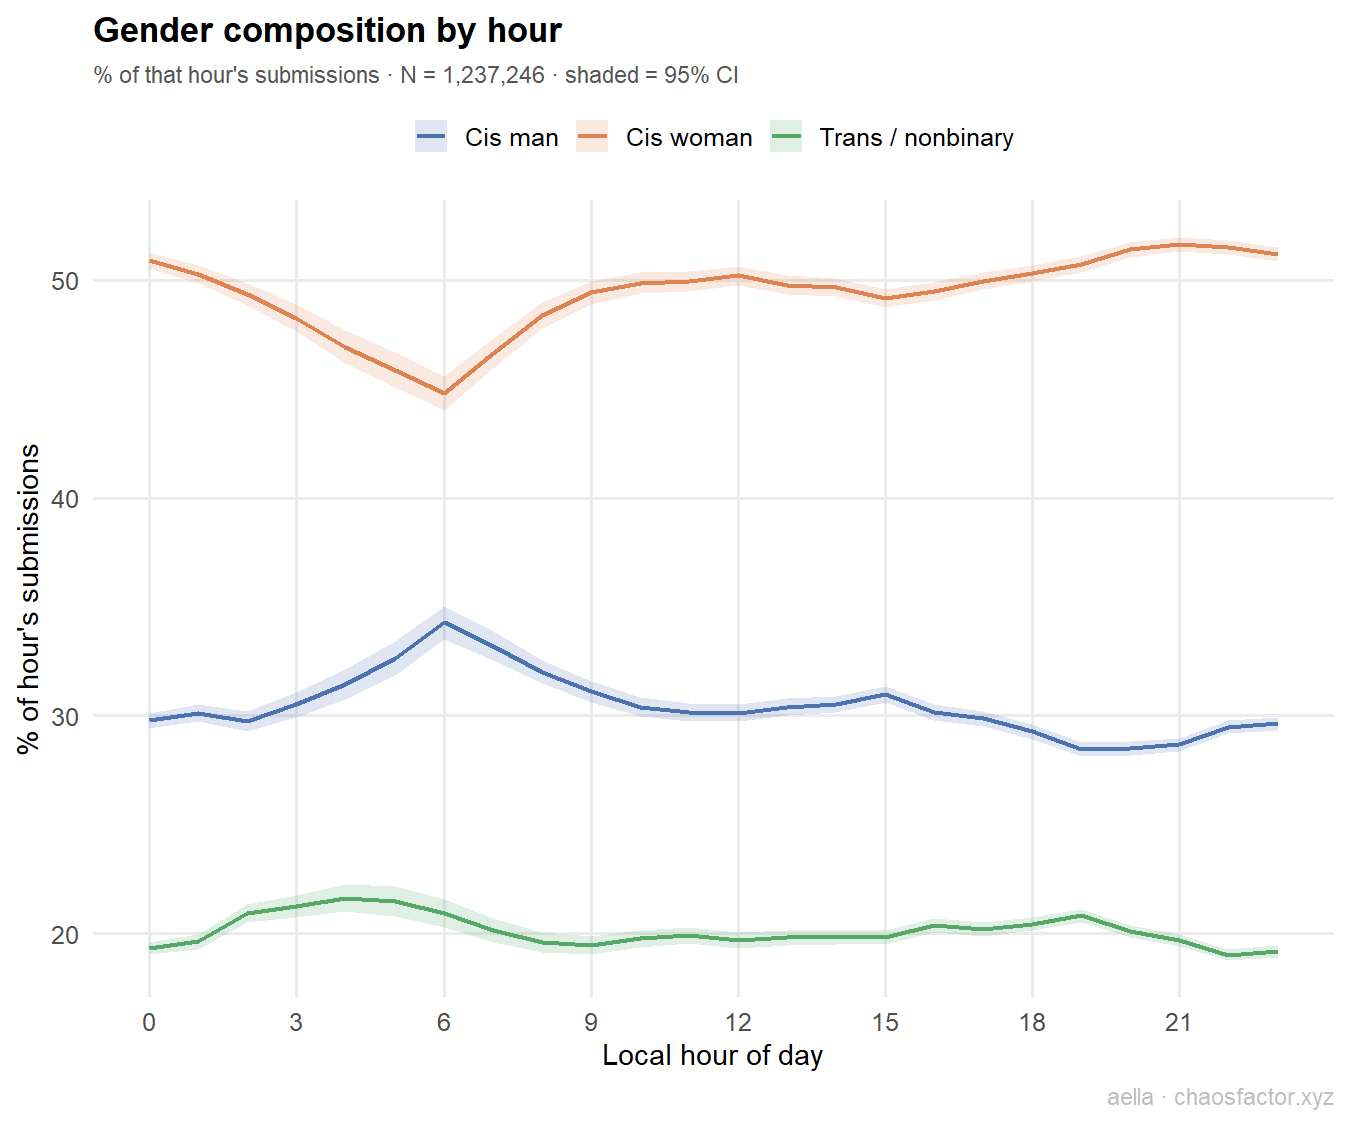
Cis women are most overrepresented in the evening and thin out in the pre-dawn hours. Trans and nonbinary respondents run the other way: 19.0% of the 10pm crowd, 21.6% of the 4am crowd. Cis men fill in the difference with a modest night bump.
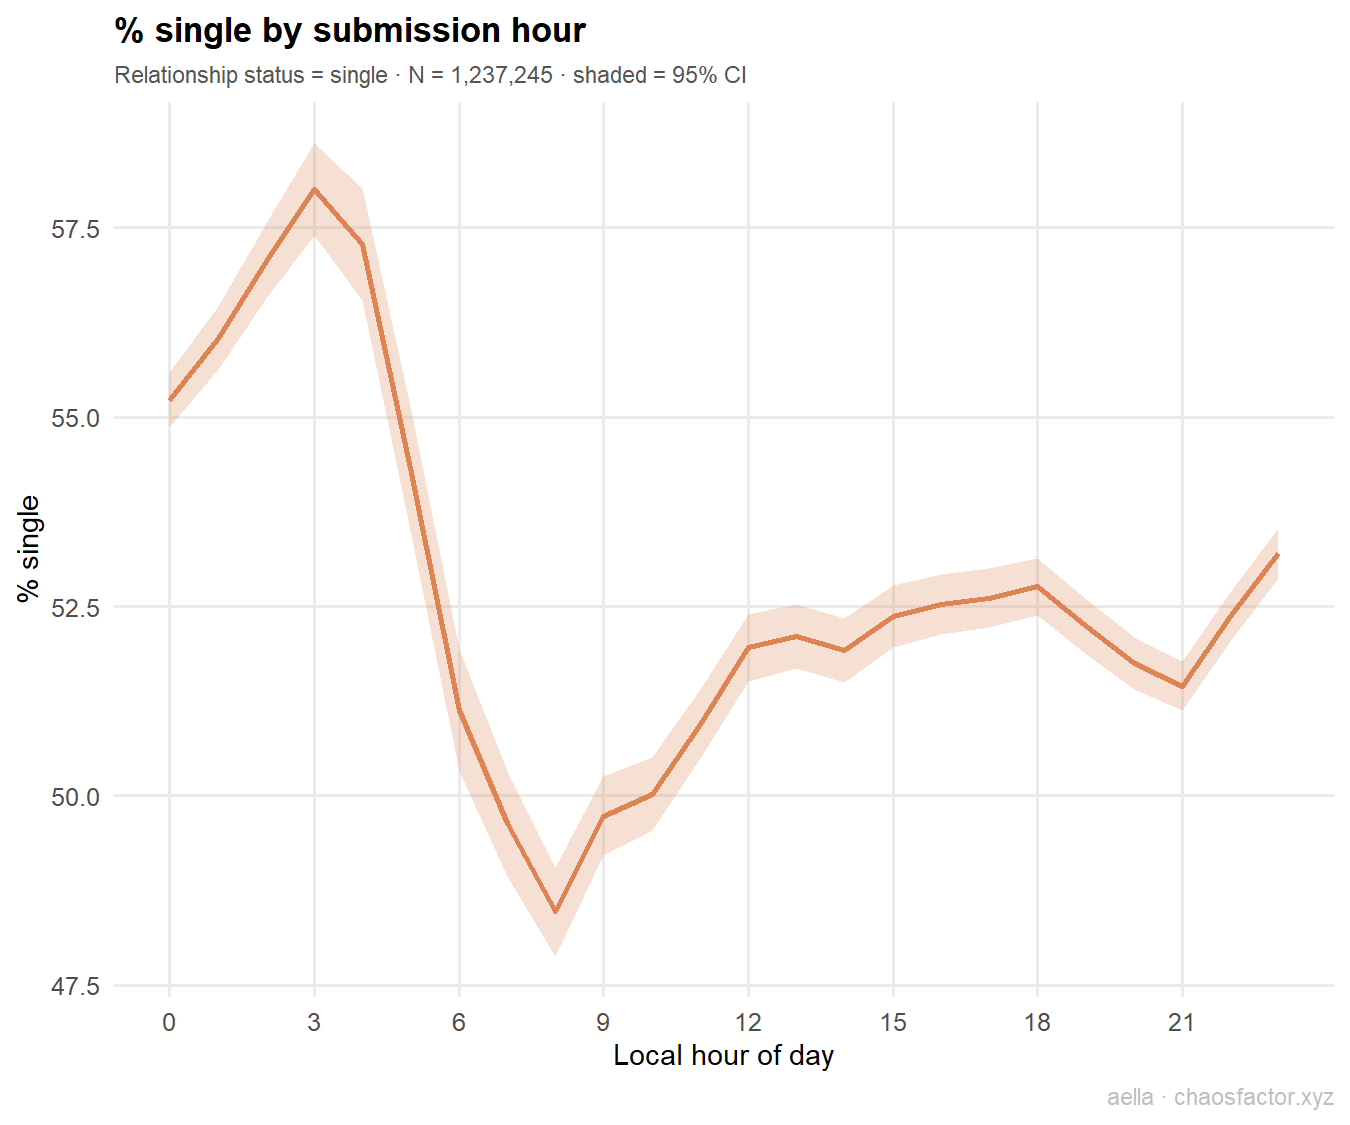
One of the cleanest curves in the dataset: 48% of 8am submitters are single versus 58% at 3am. Some of that is age — but not most of it: adjusted for age, gender, region, year, and weekend, the 2–6am window still carries 1.17× odds of being single. Partnered people, it seems, have somewhere to be at 3am.
03Mental health: the 4am signature
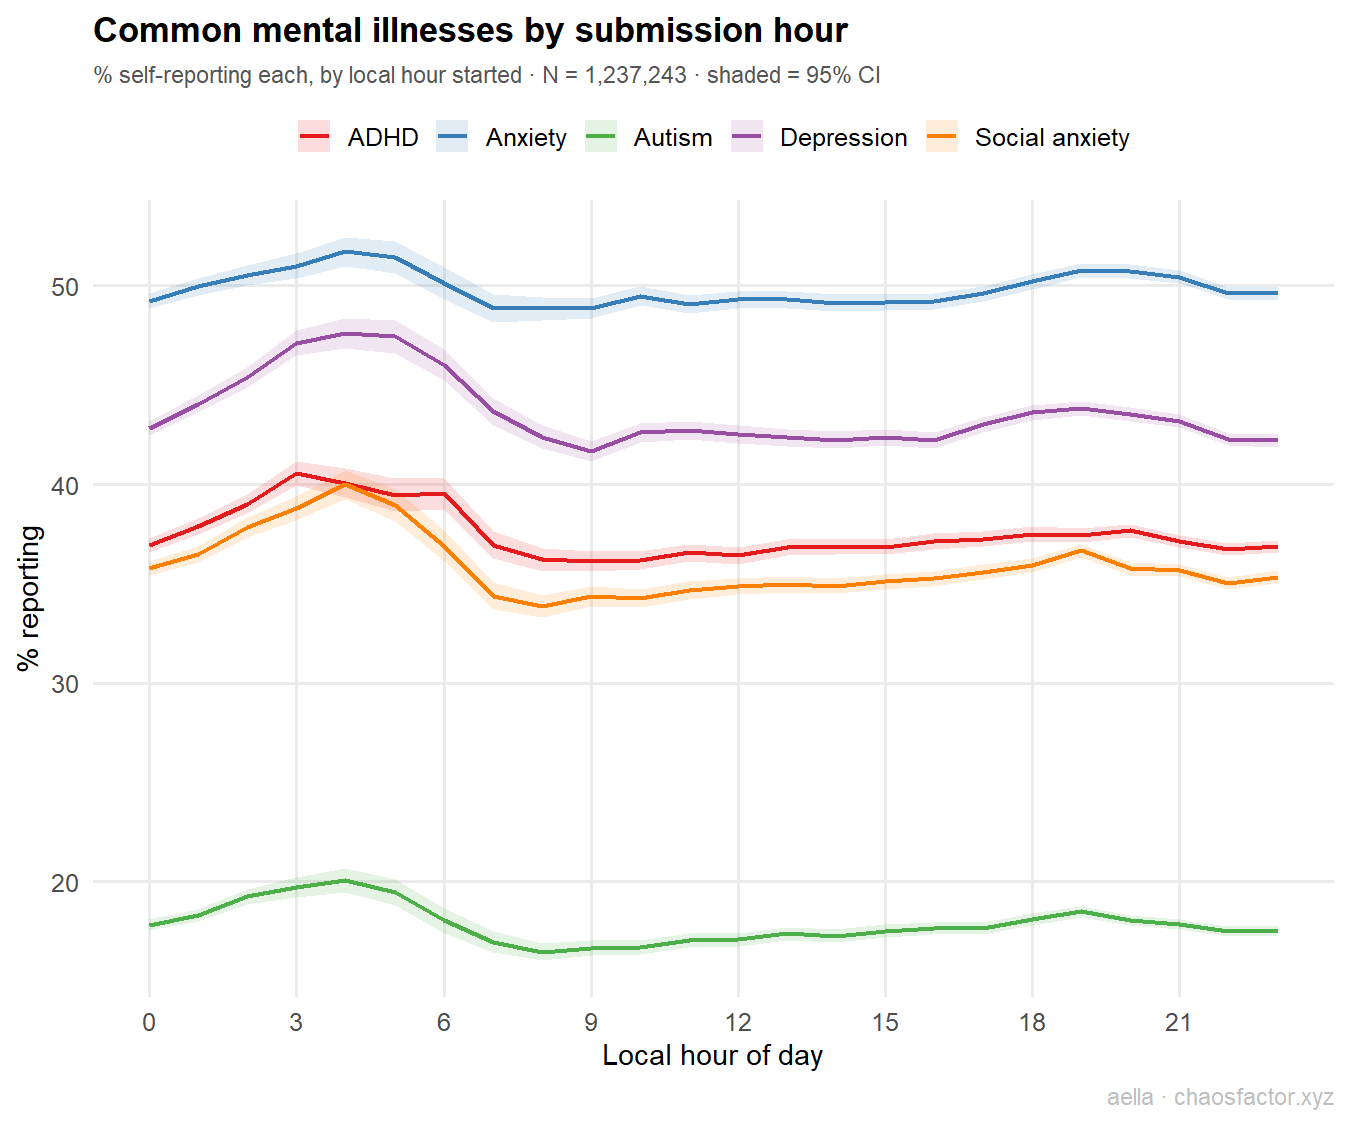
The survey asks respondents to check any mental illnesses they have (self-report, not diagnosis-verified). The four most common conditions all rise through the small hours and crest at 3–5am: depression runs 41.7% at 9am → 47.6% at 4am, ADHD 36.1% → 40.6%, autism 16.5% → 20.1%, and social anxiety 33.9% → 40.0%. Generalized anxiety moves least (48.9% → 51.7%) — anxiety is so common in this sample it has little room to vary.
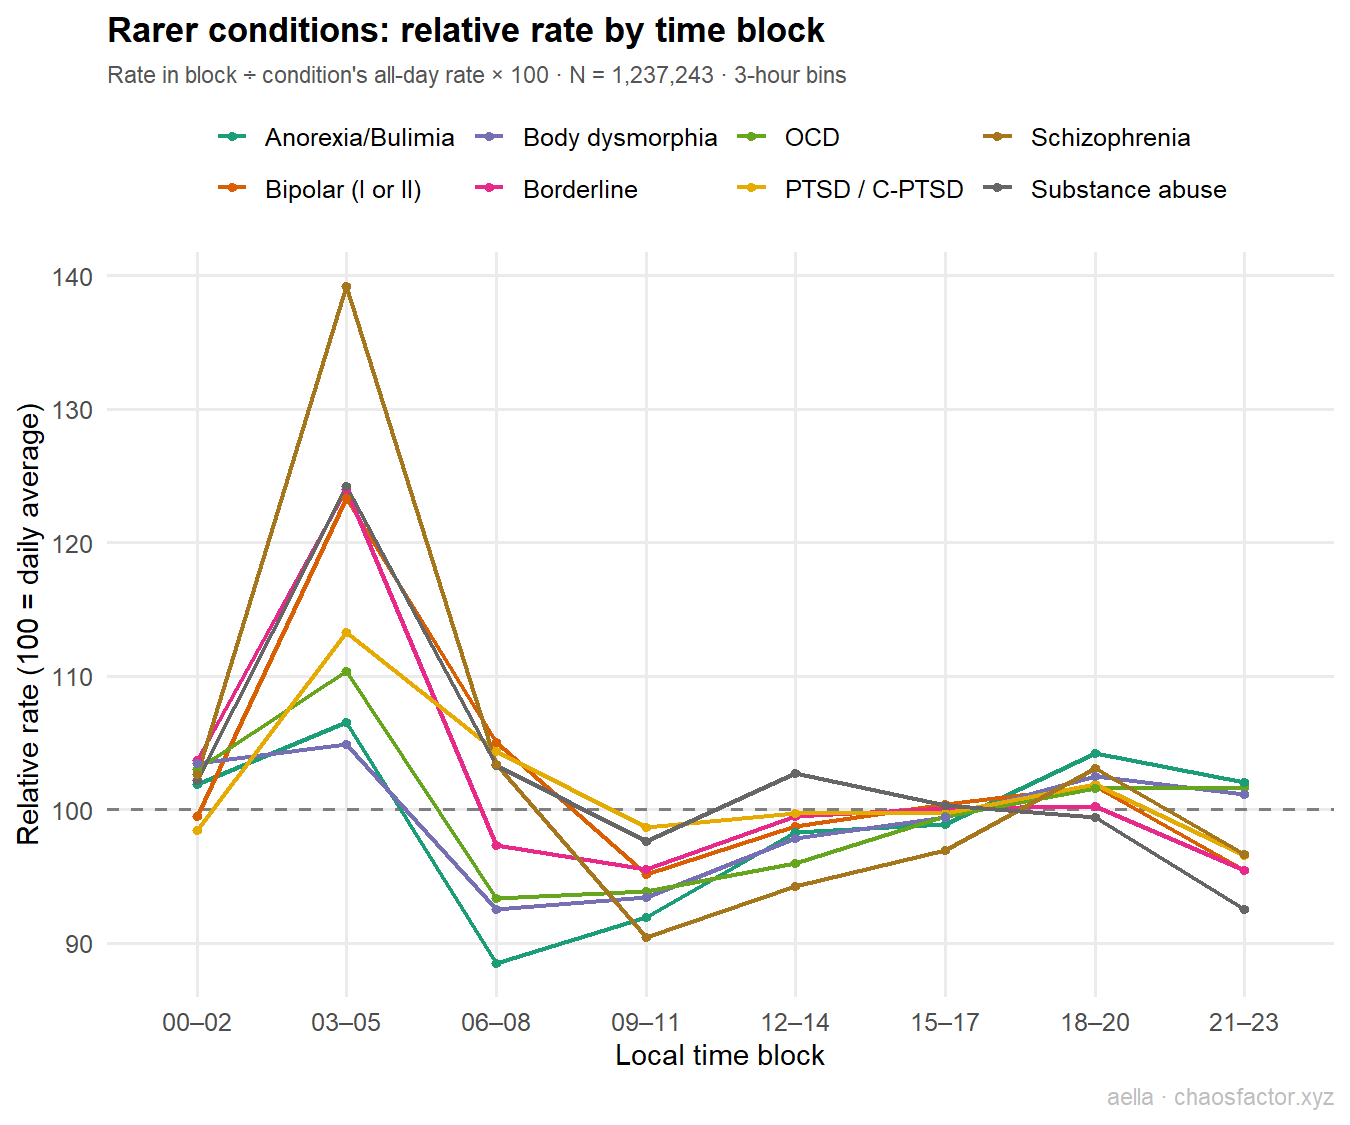
The rarer conditions are where it gets dramatic. Because base rates differ wildly (schizophrenia 1.4%, body dysmorphia 19.6%), each line here shows a condition's rate in a 3-hour block relative to its own all-day average. At 3–5am, schizophrenia runs 39% above its daily average; substance abuse disorder, borderline, and bipolar all run ~23–24% above. The heavier the condition, the harder it spikes in the pre-dawn window. Body dysmorphia and anorexia/bulimia barely budge.
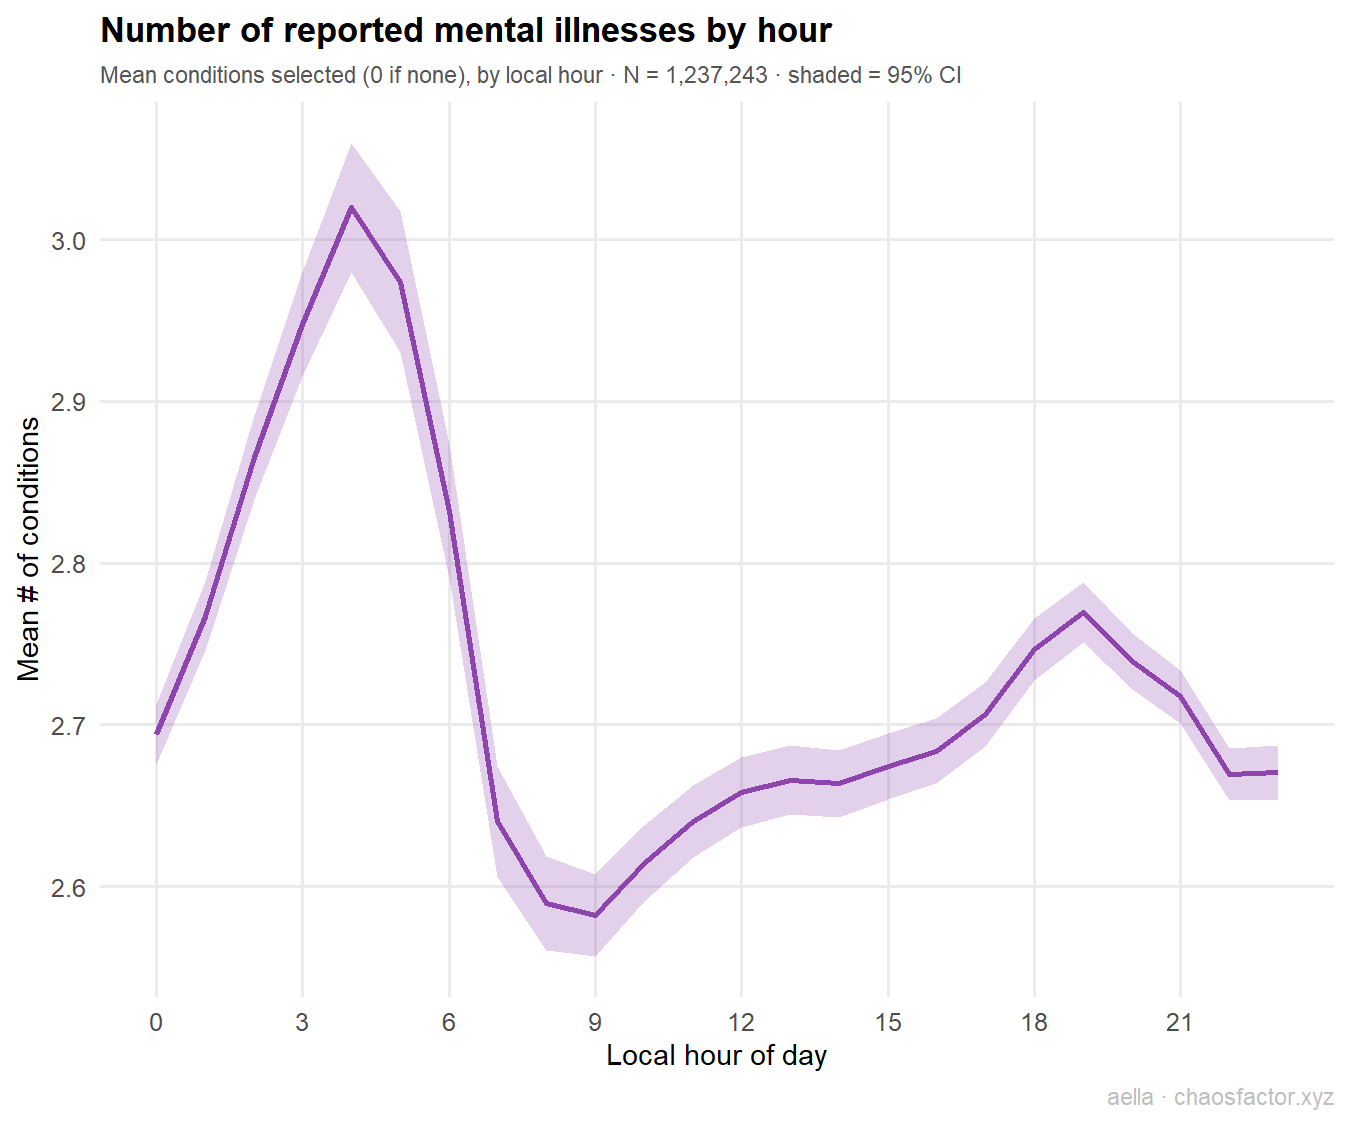
Total burden follows the same curve: the average 4am submitter checks 3.02 conditions, the average 9am submitter 2.58.
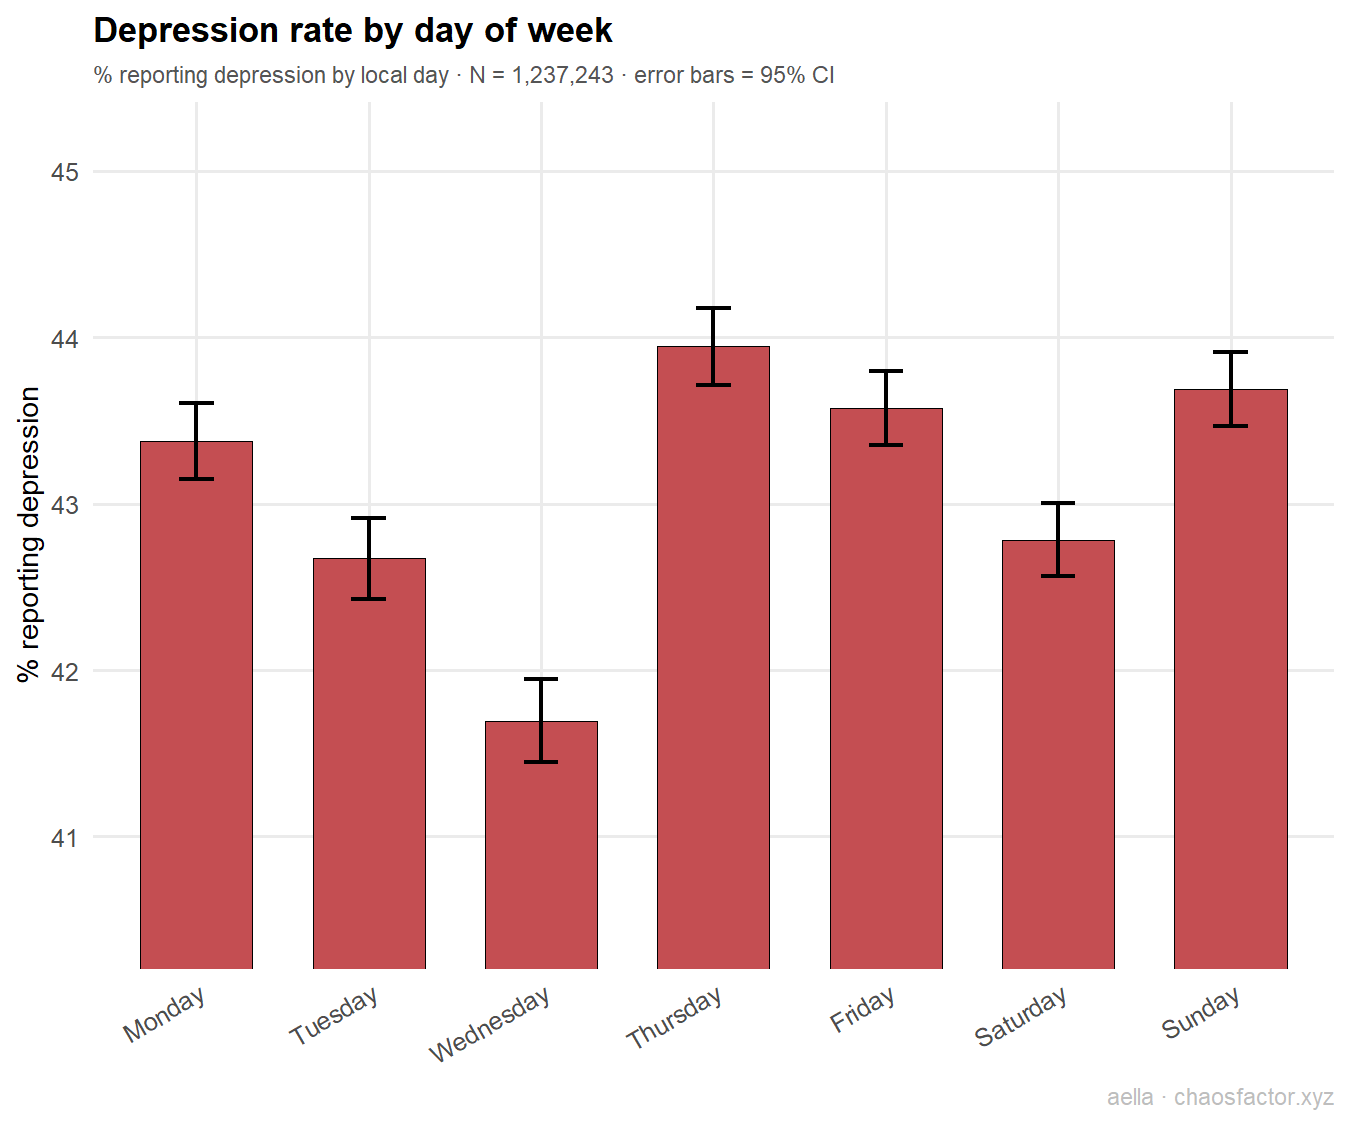
Day-of-week, by contrast, is nearly flat: Wednesday is the least depressed day to submit (41.7%) and Thursday and Sunday the most (~43.9%). Real given these sample sizes, but a two-point spread against the hour-of-day's six. Insomnia beats the Sunday scaries.
04The confounder gauntlet
The 4am crowd is younger, more male, less partnered, and reached by different recruitment waves in different years. So for every trait, we compare the raw 2–6am effect against the same effect after controlling for age, gender, region, survey year, and weekend. Effects that are just composition-shifts in disguise should collapse toward the null line; real night-owl selection should survive.
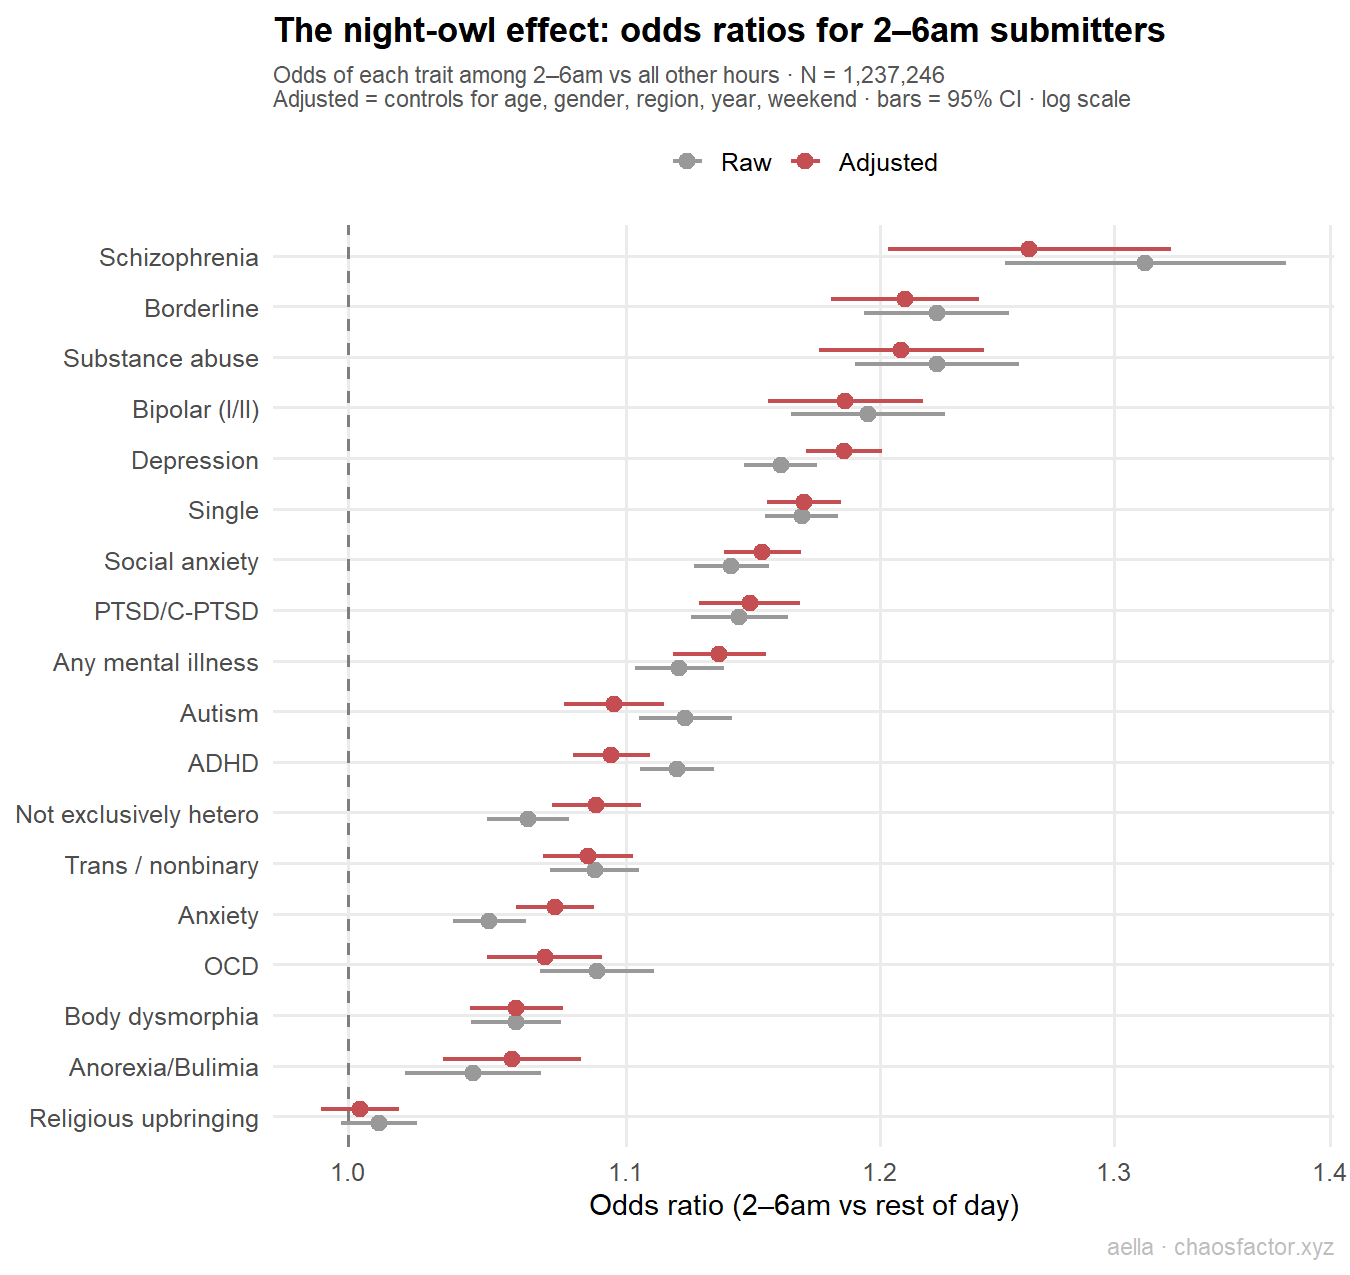
Almost everything survives. The mental-health gradient barely moves under adjustment — depression's odds ratio actually rises from 1.16 to 1.19, because the night crowd's youth and maleness were partially masking the effect rather than creating it. The ranking is striking: the conditions most associated with disrupted sleep and instability (schizophrenia 1.26, borderline 1.21, substance abuse 1.21, bipolar 1.19) top the list, while the "common" conditions cluster lower.
And the null result matters just as much: religious upbringing sits at OR 1.004 — a dead-perfect null. The night window doesn't select on everything; it selects on a coherent cluster.
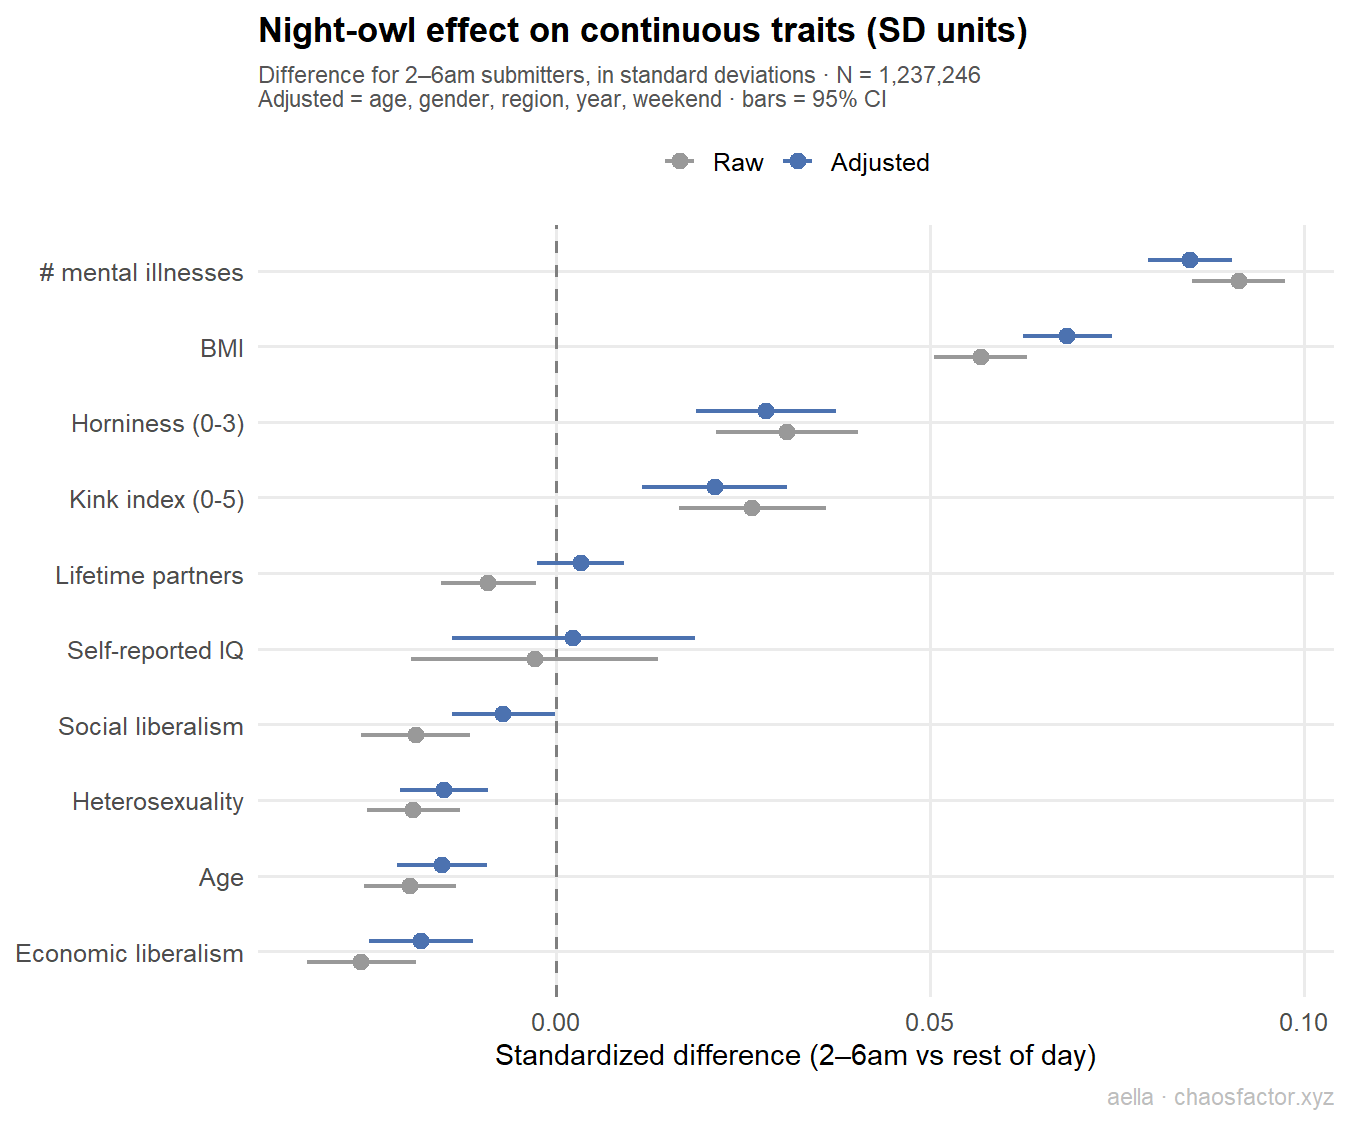
The continuous traits tell the same story in standard-deviation units. Number of mental illnesses (+0.085 SD) and BMI (+0.07 SD) lead; horniness (+0.03 SD) and kink (+0.02 SD) survive; self-reported IQ and social liberalism are nulls. And lifetime partners — which showed that dramatic raw morning peak — goes from a significant −0.009 to a null +0.003 once age enters the model:
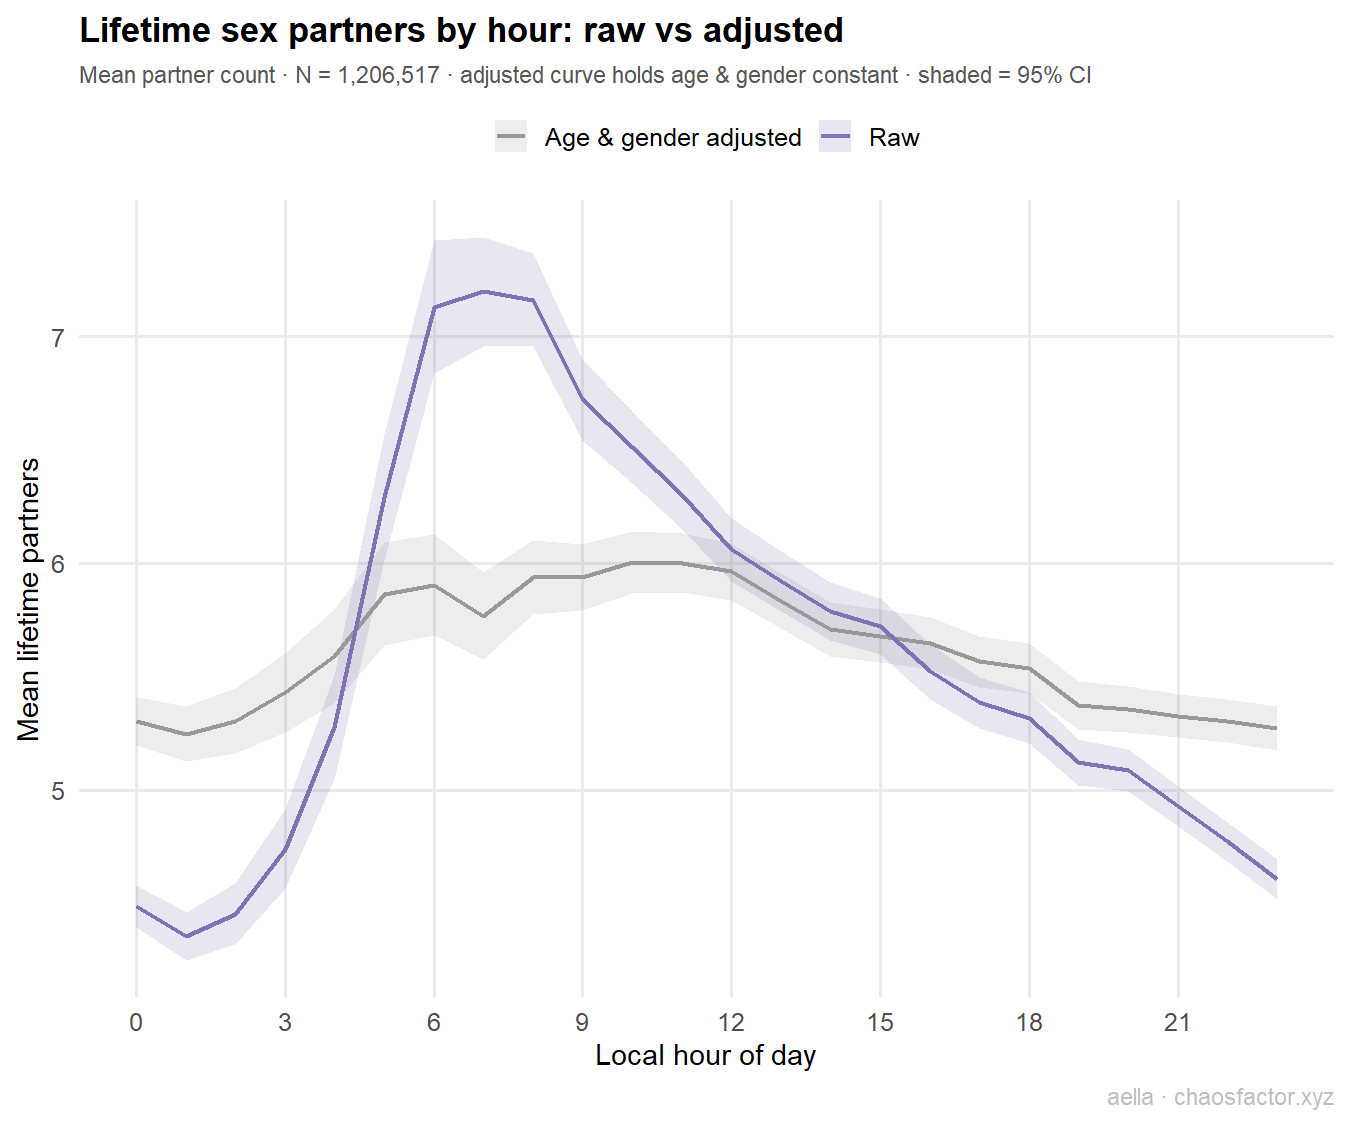
This is the report's cautionary tale. The raw curve looks like a genuine phenomenon — morning people have over 60% more partners than the after-midnight crowd! — but the adjusted curve is nearly flat. The entire "effect" was the age chart from section 02 wearing a different y-axis. Any analysis of "what time of day people do X" that doesn't check age first is at serious risk of publishing this artifact.
05Horniness, kink, and orientation
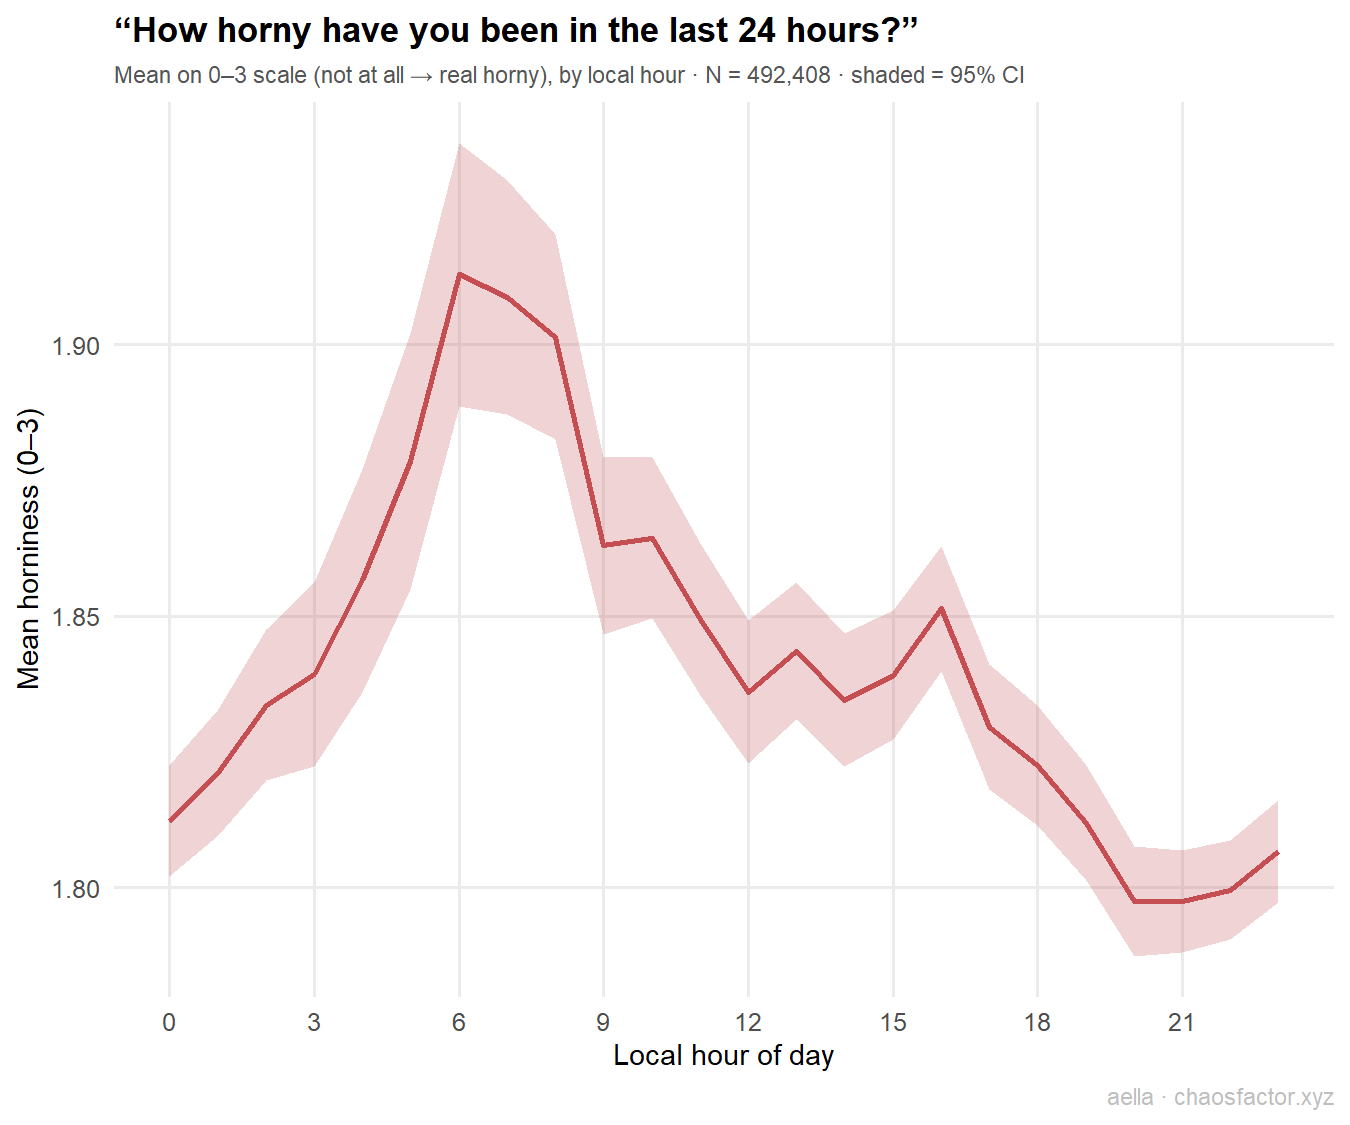
"How horny have you been in the last 24 hours?" peaks not late at night but at 6–8am — consistent with the well-documented early-morning testosterone/arousal peak — and bottoms out at 8pm. The absolute swing is small (1.80 to 1.91 on a 0–3 scale) but survives controls (+0.03 SD). The people answering a sex survey at dawn are, apparently, answering it for a reason.
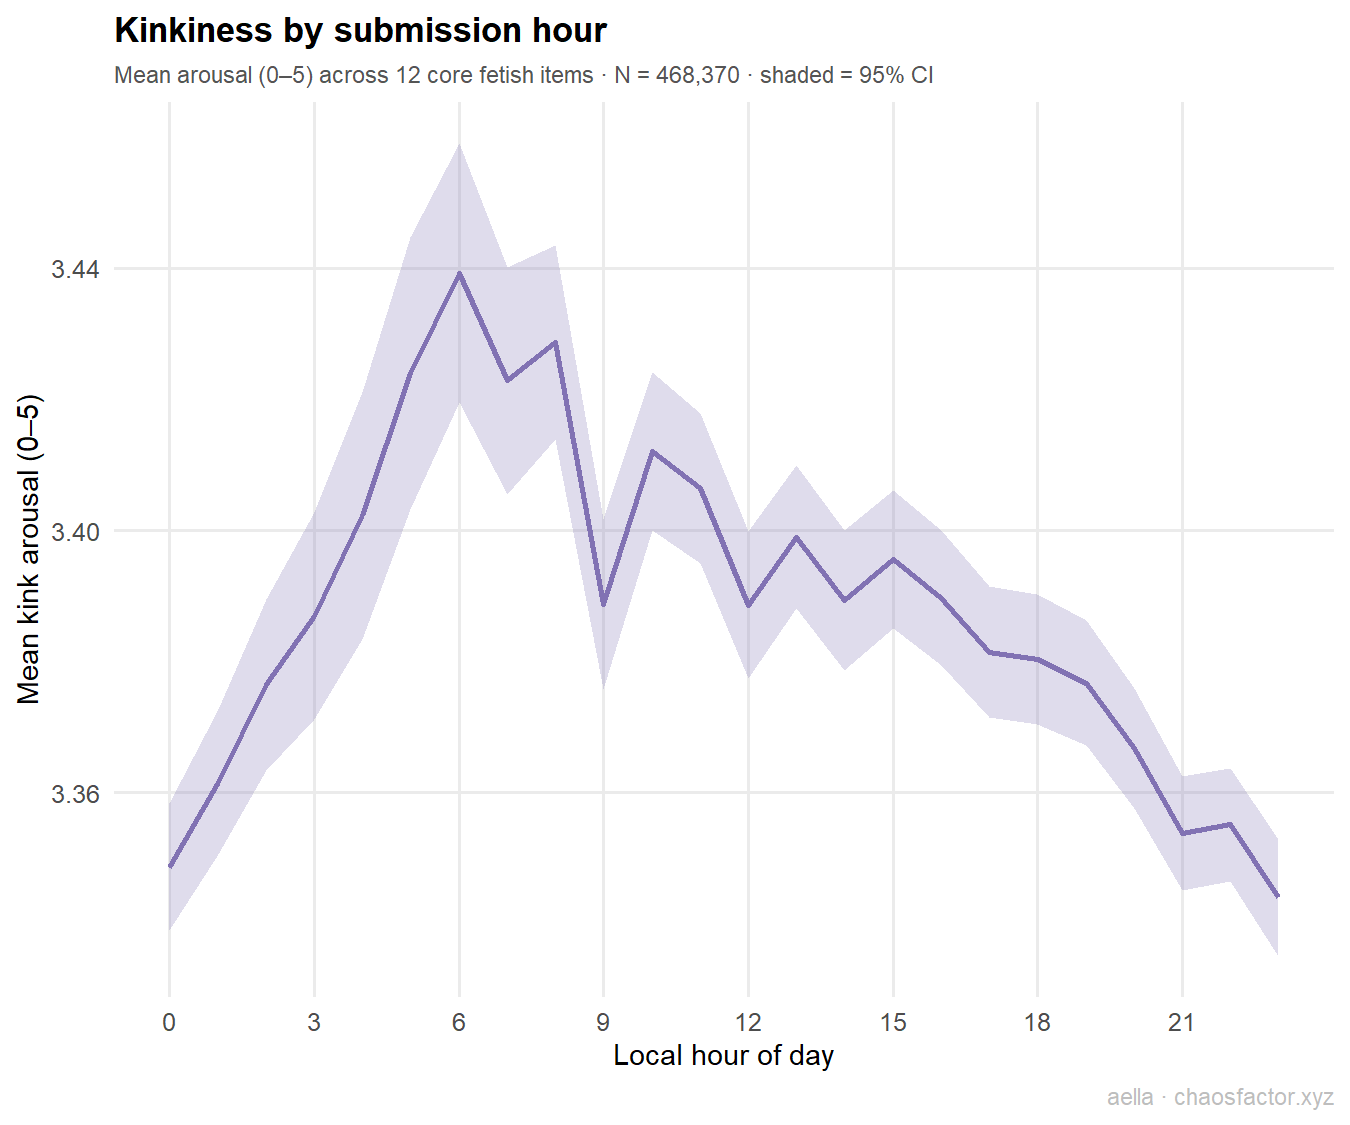
A kink index (mean arousal, 0–5, across 12 core fetish items: bondage, sadomasochism, nonconsent, humiliation, powerdynamics, exhibitionism, voyeurism, incest, bestiality, vore, anal, and more) shows the night-and-dawn crowd is modestly kinkier — +0.02 SD after controls. Real but small: time of day tells you much more about someone's mental health than their fetishes.
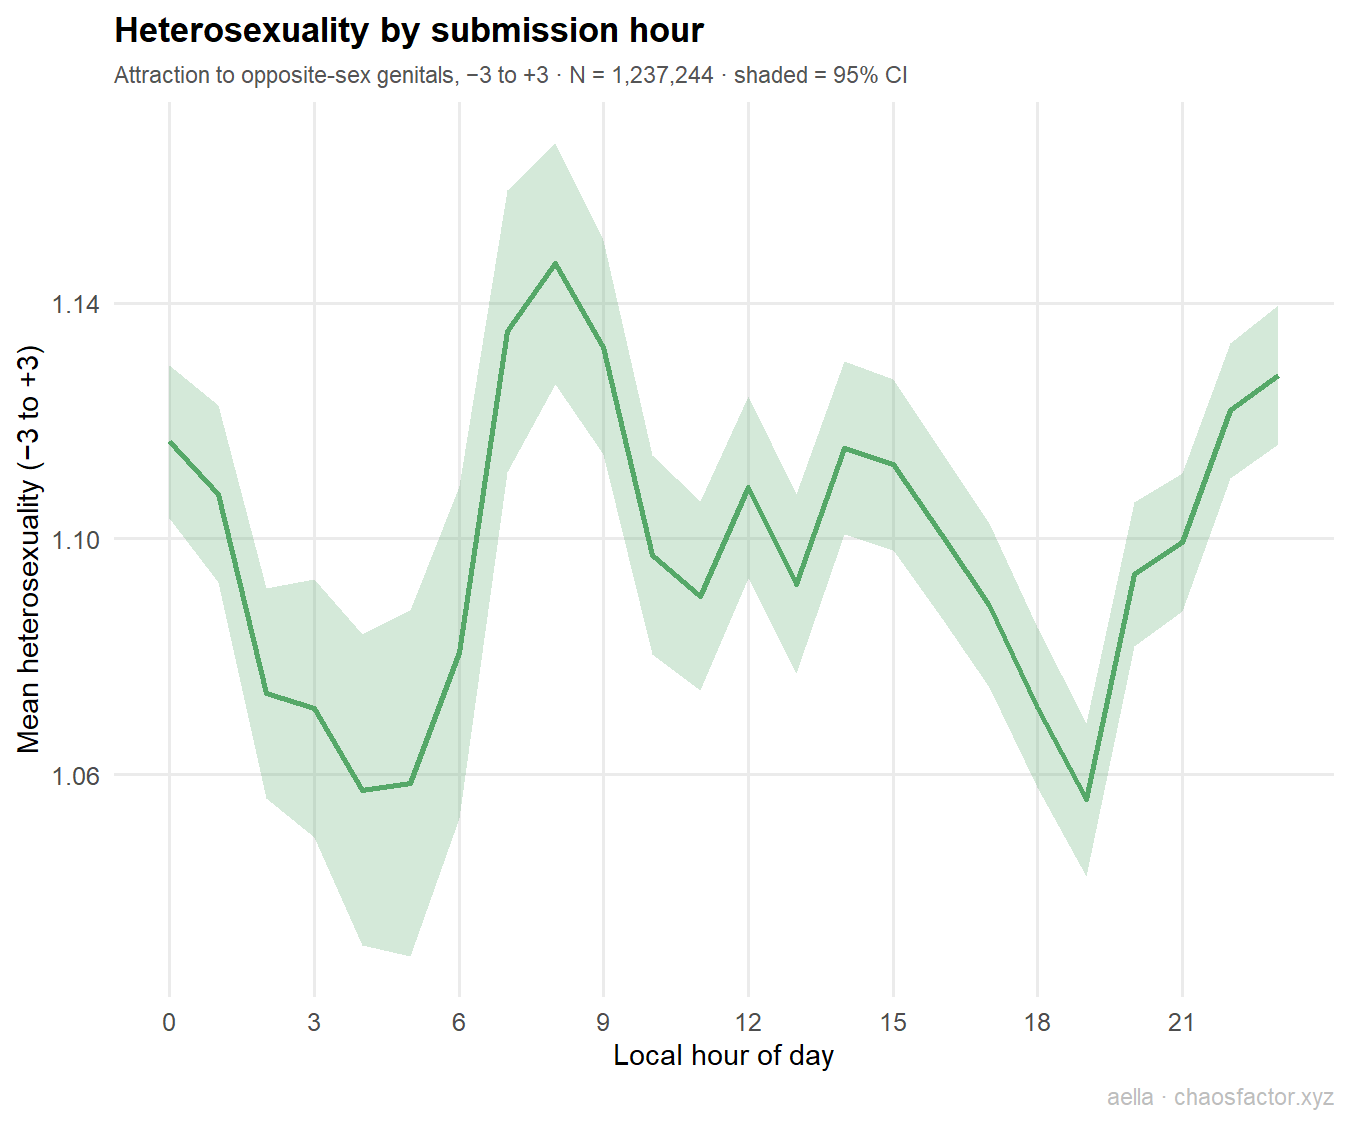
Attraction to opposite-sex genitals (−3 to +3) is a noisier curve than the mental-health ones, with dips both pre-dawn and in the evening, but the regression is clear: the 2–6am crowd is measurably less exclusively heterosexual (adjusted OR 1.09 for "not exclusively hetero", −0.015 SD on the continuous scale). Consistent with the trans/nonbinary night bump: the small hours skew queer.
06Politics, religion, IQ
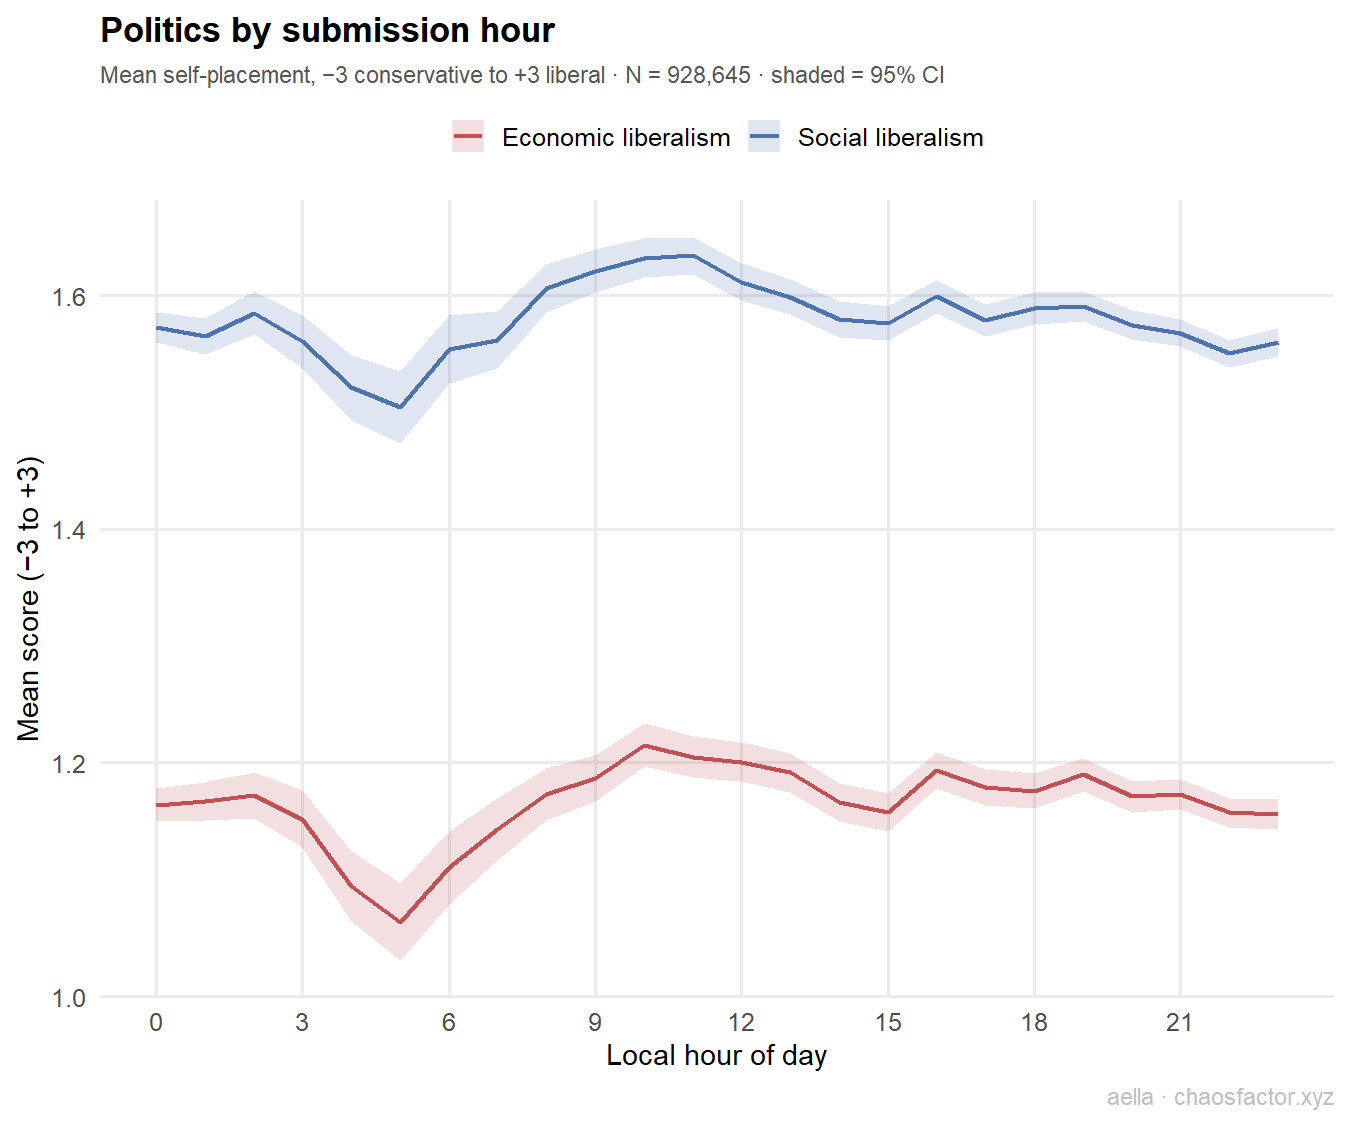
Mostly a null. Social liberalism is flat after controls; economic liberalism shows a tiny conservative lean at night (−0.018 SD adjusted) that's barely distinguishable from noise. Whatever the 4am window selects for, it isn't ideology.
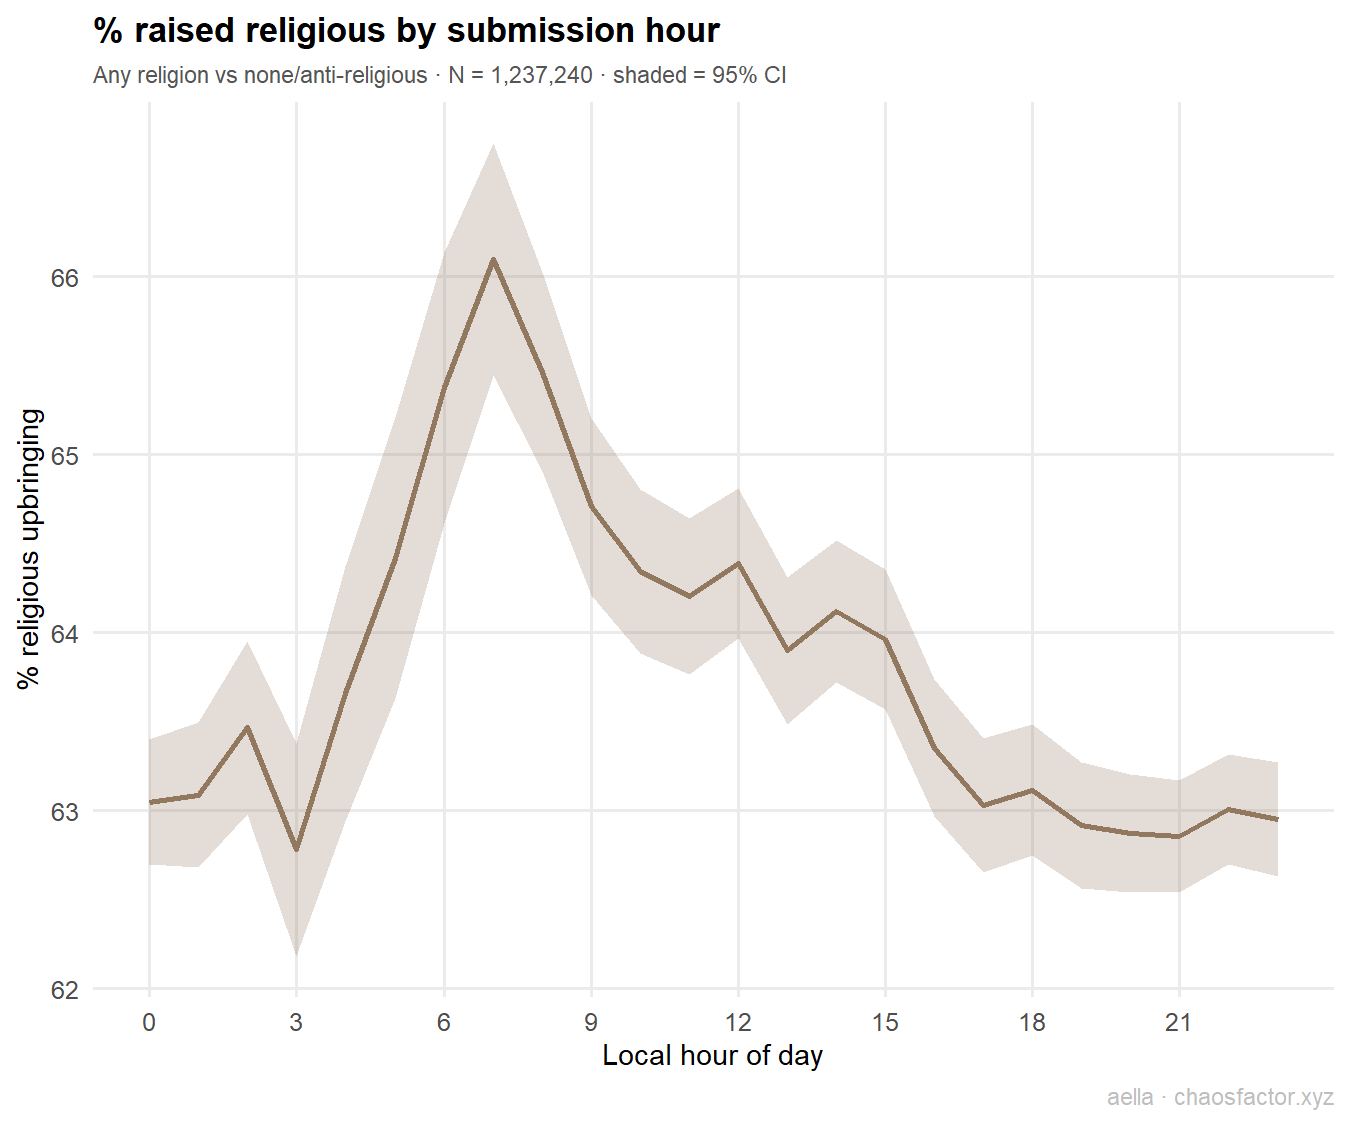
Religious upbringing is the cleanest null in the whole analysis — a ~3-point dip at 3am in the raw curve that vanishes entirely under controls (OR 1.004). This is a useful placebo test: a variable that shouldn't depend on what hour you happen to take a survey, and doesn't.
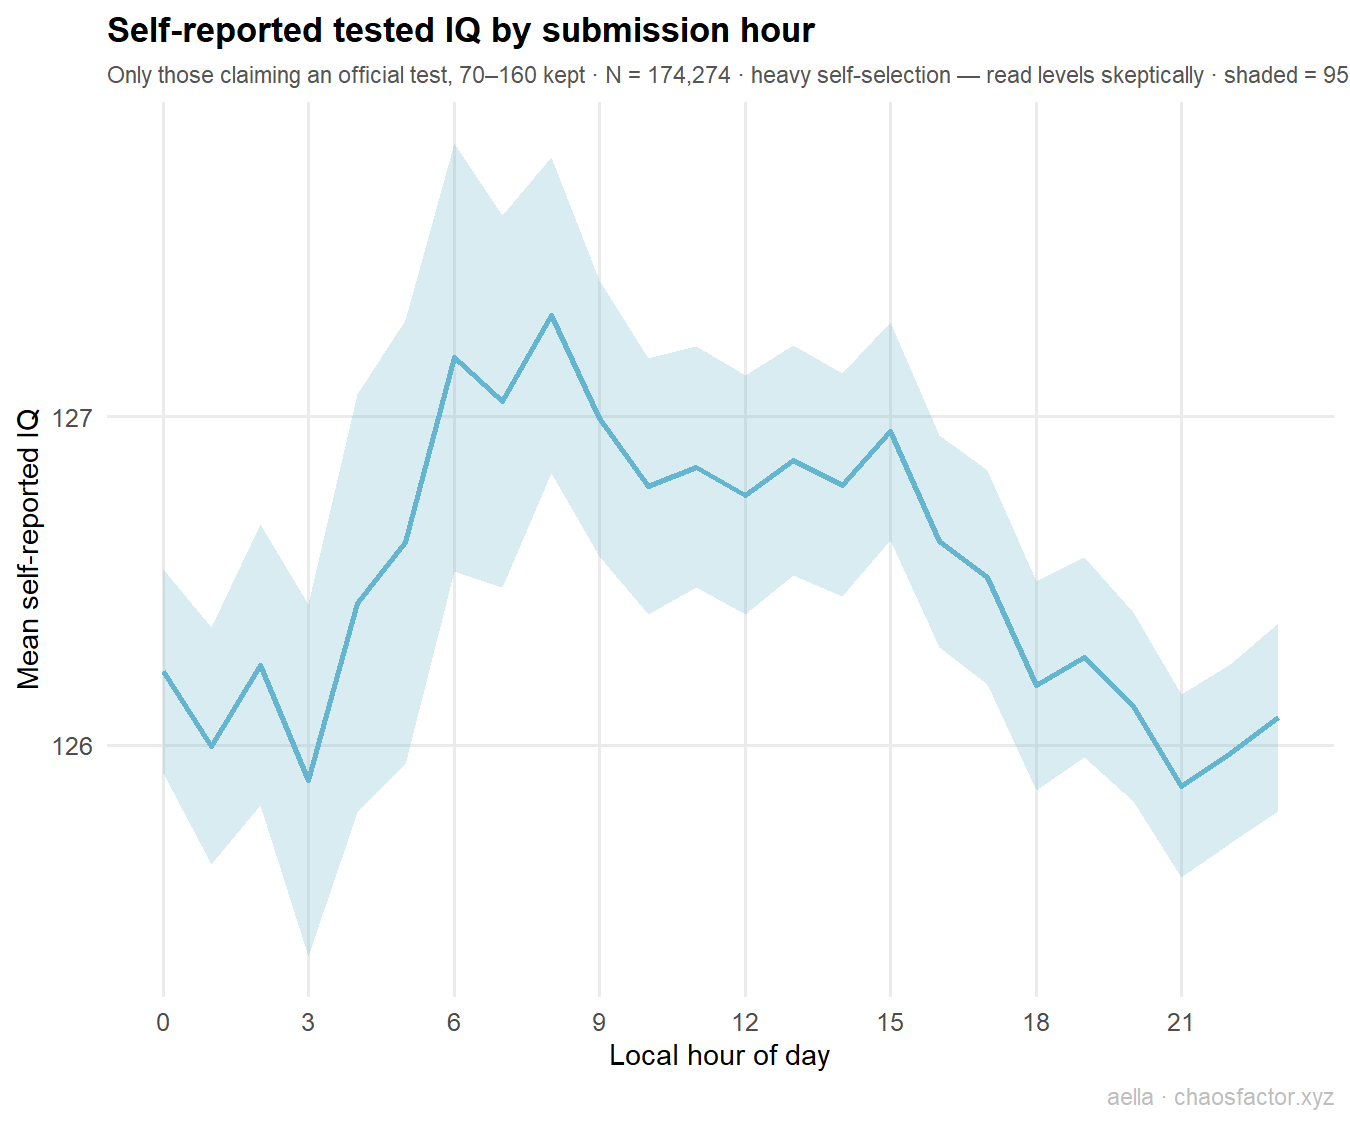
Among the ~174,000 who claim an officially tested IQ (mean 126 — yes, everyone on the internet is gifted), the night effect is a null: +0.002 SD, CI spanning zero. There's a faint ~1-point morning ripple that tracks the older morning crowd, but night owls self-report being exactly as smart as everyone else.
07Robustness
Two obvious ways the headline result could be fake: a broken timezone mapping, or recruitment waves (a viral thread in one year hitting one hour). So: does the depression-by-hour curve replicate within each region (each with independent timezone math — including Australia, ten timezones away with reversed daylight saving), and within each era of the survey's nine-year run?
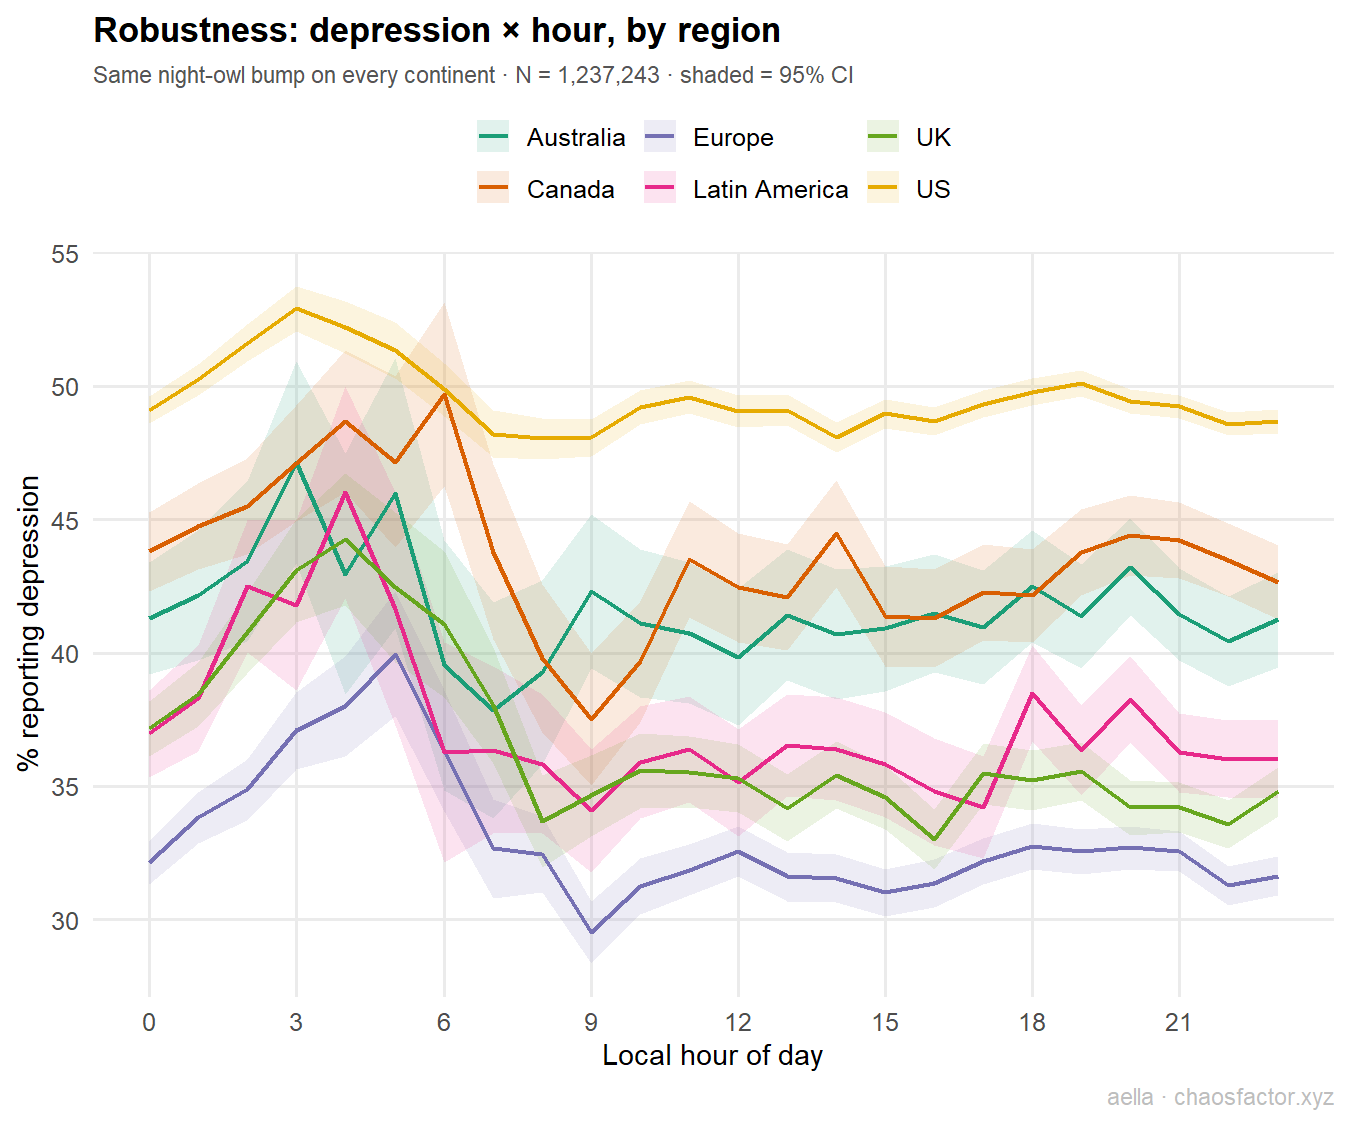
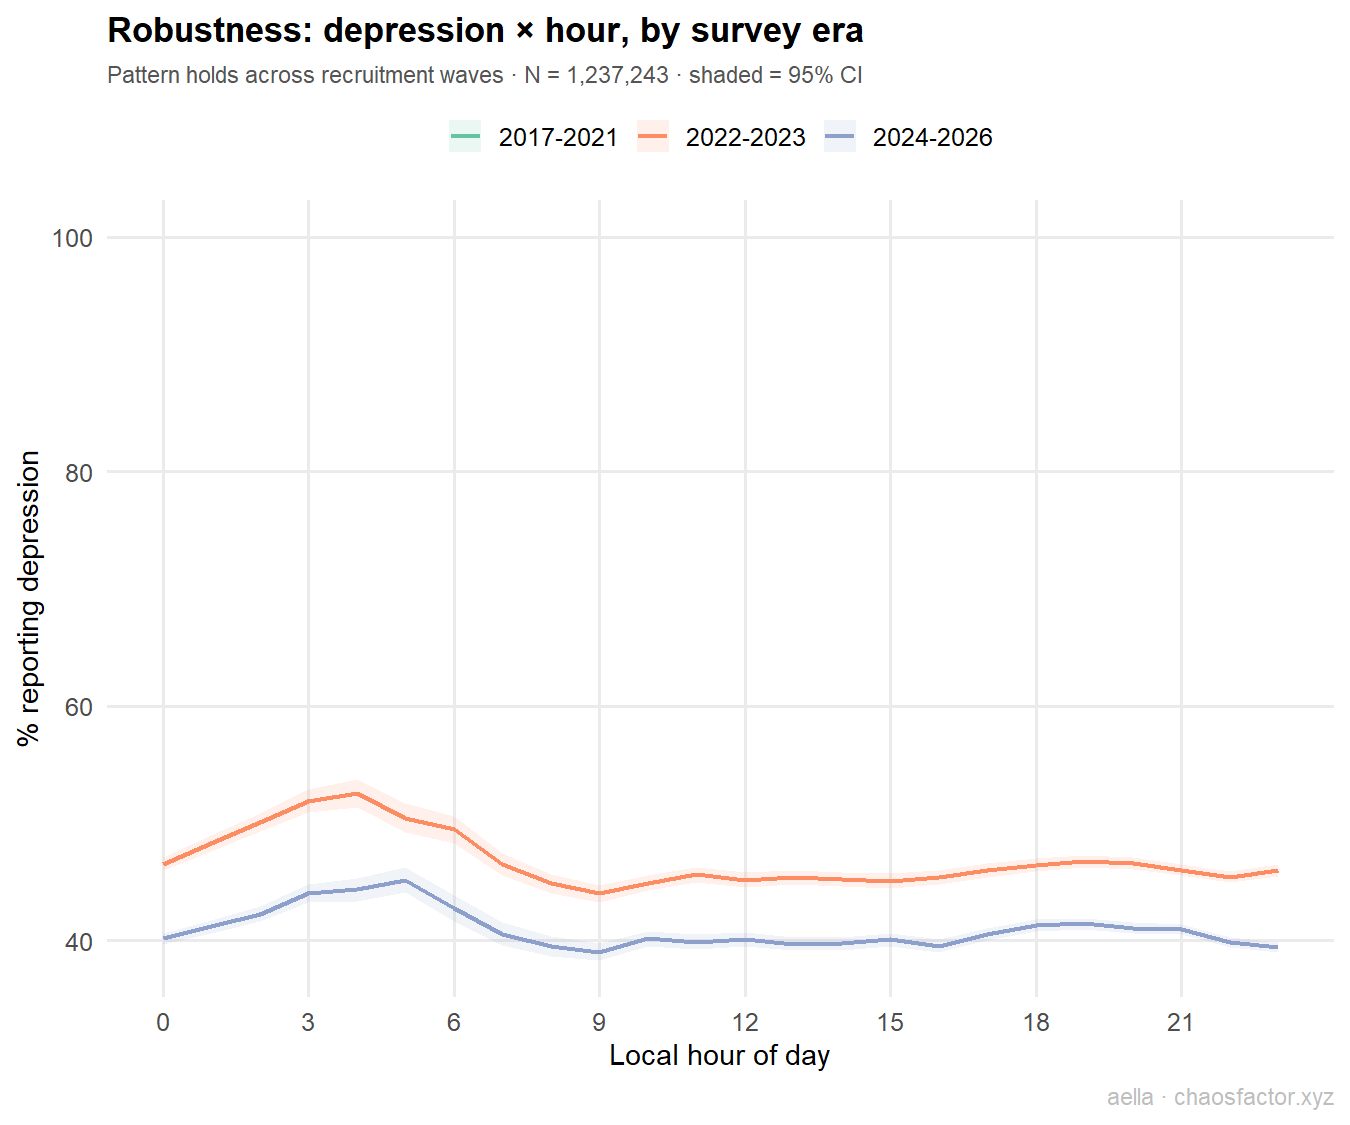
Yes on both. All six regions and every era show the same shape: flat-to-declining through the evening, rising after midnight, peaking at 3–6am. Levels shift (the US reports the most depression, Europe the least; reporting rose over the survey's lifetime) but the night-owl bump is stable everywhere. Combined with the year fixed-effects already inside every adjusted model, wave artifacts can't explain the pattern.
08Methods & caveats
Data. 1,366,900 cleaned submissions to the Big Kink Survey (2017–2026) from the full cleaned dataset (speeders, low-honesty, and impossible-value responses already removed). 1,237,246 remained after dropping respondents whose region can't be assigned a timezone offset ("Other", "Other Europe (other)", "Asia (other)", "Africa", and "United States (other)" — together ~10% of the sample) and ages outside 14–80. An earlier version of this report used the 586k-row weighted subset (the only file at hand with timestamps); rerunning on the full sample reproduced every finding with nearly identical effect sizes.
Local time. Submission timestamps are UTC. Respondents report country of residence, with the US split into four regions. Offsets: US east & Canada −5, US south & middle/north & Mexico −6, US west −8, UK 0, Western/Central Europe & Poland +1, Eastern Europe +2, Russia +3, India & South Asia +5.5, East Asia +8, Australia +10, Brazil −3, other South America −4. Northern-hemisphere DST regions get +1 April–October; Australia gets +1 November–March; Brazil, Russia, India, Mexico, and Asia get none. This is deliberately coarse — each region spans more than one timezone (Canada and Australia especially), and DST boundaries aren't exact — so true local hour is blurred by roughly ±1 hour. That blur smears curves toward flatness; the real amplitudes are, if anything, slightly larger than shown. The region-by-region replication (section 07) bounds how wrong this can be.
Outcomes. Mental illness is a self-report checklist ("which of the following do you have?"), not verified diagnosis. "Hour" is when the survey was started. All analyses are unweighted (the question here is about who shows up, not about population estimates).
Models. "Night" = local 2–6am start. Adjusted models: logistic (binary) or linear (standardized continuous) regressions with age, gender (cis man / cis woman / trans-or-nonbinary), region (US / UK / Canada / Europe / Australia / Latin America / Asia / Russia), survey-year fixed effects, and a weekend flag. The trans/nonbinary outcome omits the gender control. 95% CIs are Wald. With N this large, focus on effect sizes, not p-values — nearly everything is "significant."
The big caveat. This is selection, not causation. The data can't distinguish "being depressed keeps you up at 4am" from "being up at 4am is bad for you" from "a third thing (chaotic sleep, unemployment, chronotype) causes both." What it does establish is that when someone takes your survey carries real information about who they are — and that survey samples collected at different hours are demographically different samples.