TL;DRThe extremes are doing fine. The middle is not.
People at both ends of the monogamy–polyamory spectrum report the healthiest relationships. Almost every measure of relationship quality — flourishing, friendship, openness, low toxicity — bottoms out for people who describe themselves as "slightly monogamous," and recovers as you move toward either pole. The very polyamorous report the least jealousy, the least fighting, and the most transparency; the very monogamous report the most sexual satisfaction (especially women), the most interdependence, and by far the least cheating. The clearest signal in the whole dataset isn't "mono good" or "poly good" — it's that people whose relationship structure matches their desires do well, and people stuck in between do badly (see the identity × desire heatmap).
01The data
The survey asks people currently in a romantic relationship ~60 questions about that relationship (people with multiple partners answer about their primary/longest one). The monogamy question is a 6-point identity scale — from "very monogamous" to "very polyamorous" — where poly is defined for respondents as "not-monogamous… If you and your partner are allowed to sleep with other people, this counts as non-monogamous even if you don't act on it."
From 139,880 raw submissions, the cleaned sample keeps 49,957: completed surveys only, first submissions only, self-reported honest answers, plausible ages (18–80), relationship lengths consistent with both partners' ages, completion times over 3 minutes, and — because it inflated scores dramatically — nobody whose partner watched them fill it in. Full attrition table in the methodology.
| Very mono | Mostly mono | Slightly mono | Slightly poly | Mostly poly | Very poly | |
|---|---|---|---|---|---|---|
| Share of sample | 59.2% | 21.8% | 3.6% | 7.6% | 4.3% | 3.4% |
| n (men) | 18,682 | 7,051 | 1,199 | 2,389 | 1,329 | 989 |
| n (women) | 10,916 | 3,849 | 598 | 1,413 | 815 | 727 |
| Median age | 28 | 29 | 29 | 30 | 31 | 32 |
| Median relationship length | 4.0 yr | 3.5 yr | 3.5 yr | 4.0 yr | 4.0 yr | 4.0 yr |
| % married | 34% | 27% | 26% | 31% | 28% | 29% |
| % with multiple current partners | 0.5% | 3.5% | 10.5% | 17.5% | 40% | 58.5% |
Conveniently for analysis, the groups are demographically similar: age, relationship length, marriage and kid rates barely differ across the spectrum (poly respondents are ~2–4 years older on average). The composition shifts that do exist — poly respondents are less religious, more socially liberal, and more often in same-sex relationships — are handled in the adjusted models, which barely move any line.
02The U-shape: flourishing bottoms out in the middle
The survey's best single "is this relationship good?" measure is a six-item flourishing composite ("this relationship is good for me," "I think this relationship will last for a very long time," etc.). Both sexes show the same curve: high at very mono, sagging through the middle, and highest of all at very poly.
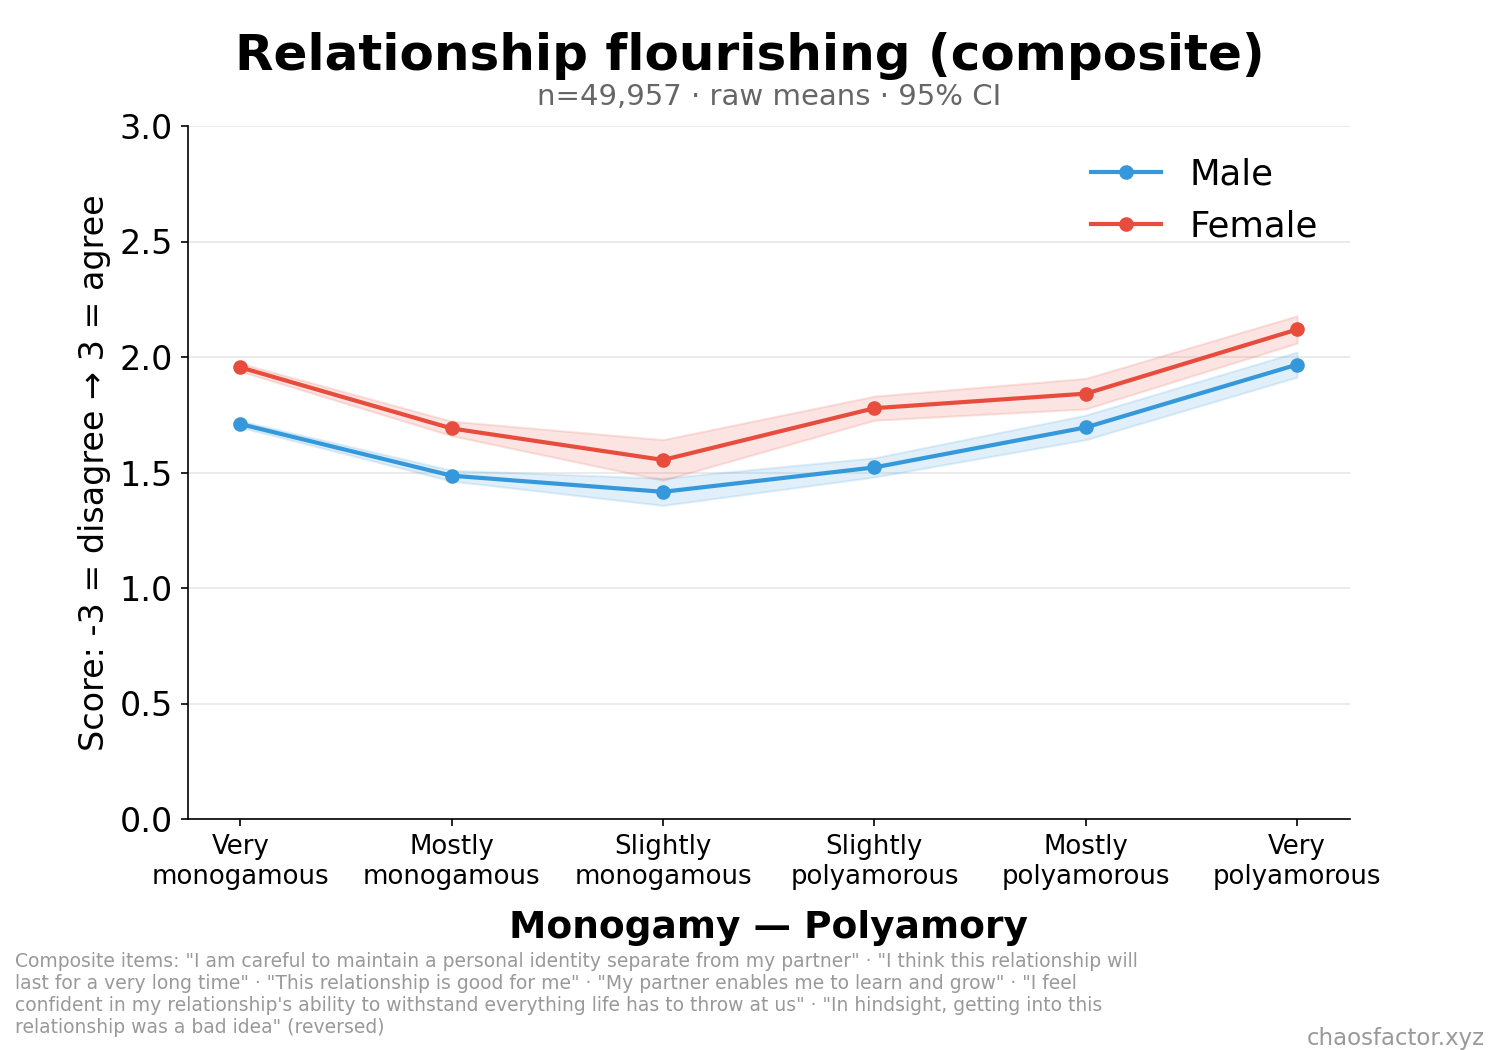
Women report more flourishing than men at every point on the spectrum. The gap between "very poly" women (2.12) and "slightly monogamous" men (1.42) is about 0.7 points on a −3→3 scale — large for this kind of data. Friendship/similarity and openness composites trace the same U (see the full grid).
03Jealousy and toxicity: lowest at the poly end
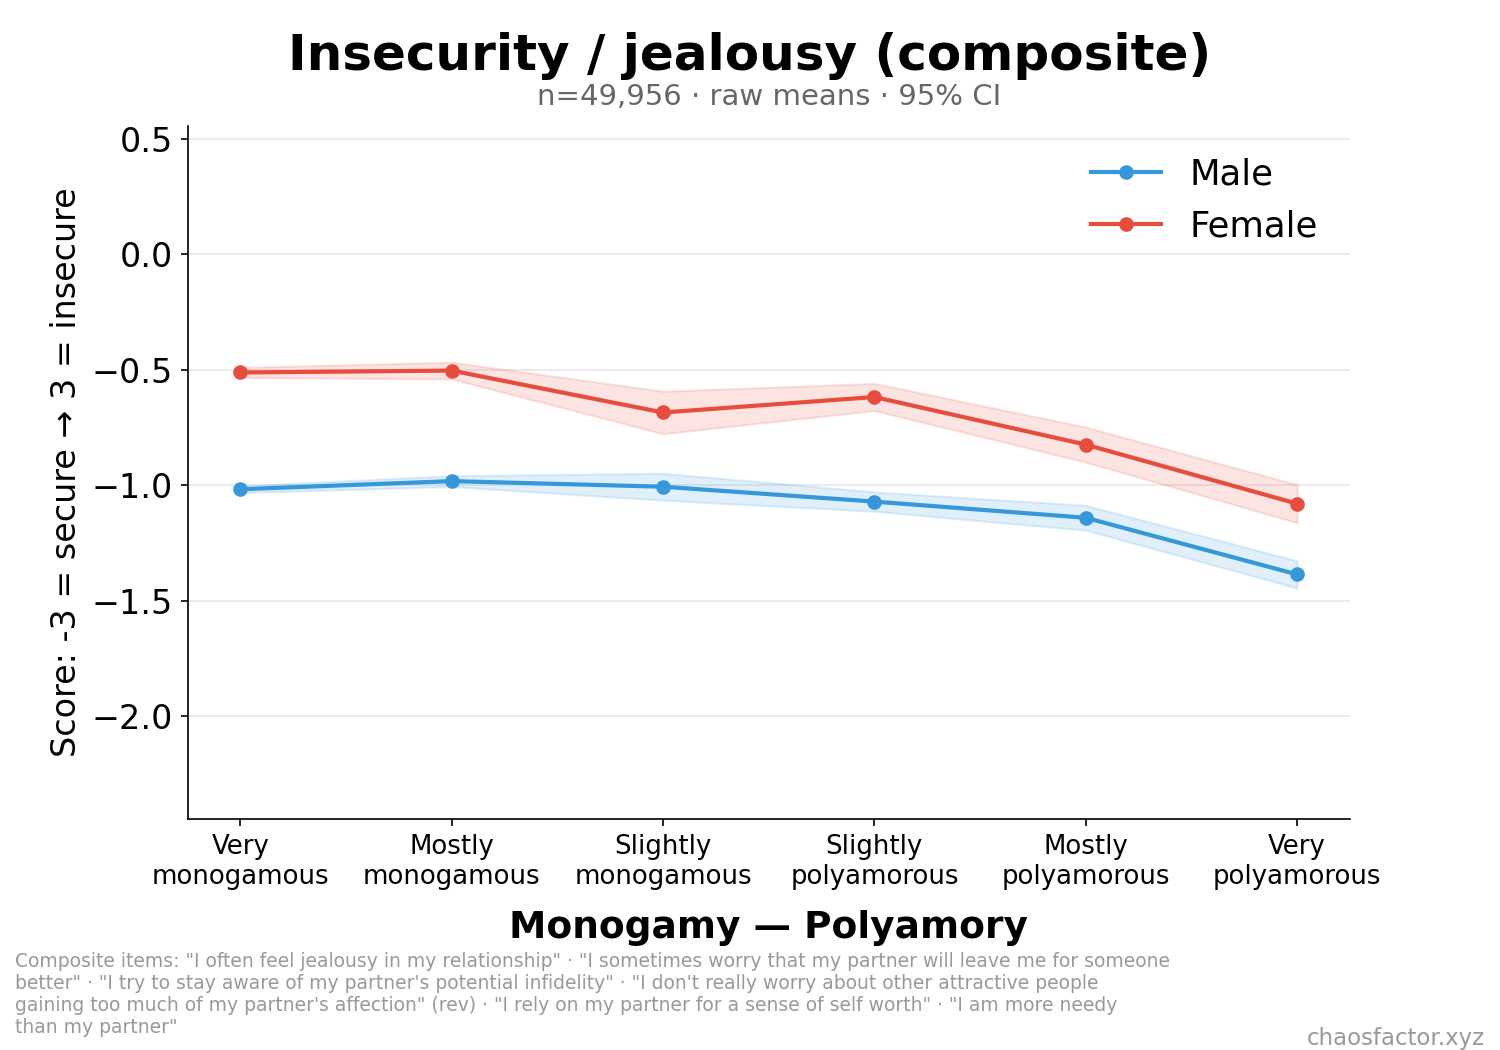
Insecurity (jealousy items, fear of being left, monitoring for infidelity) declines as you move poly-ward, for both sexes — with men reporting substantially less insecurity than women everywhere on the spectrum.
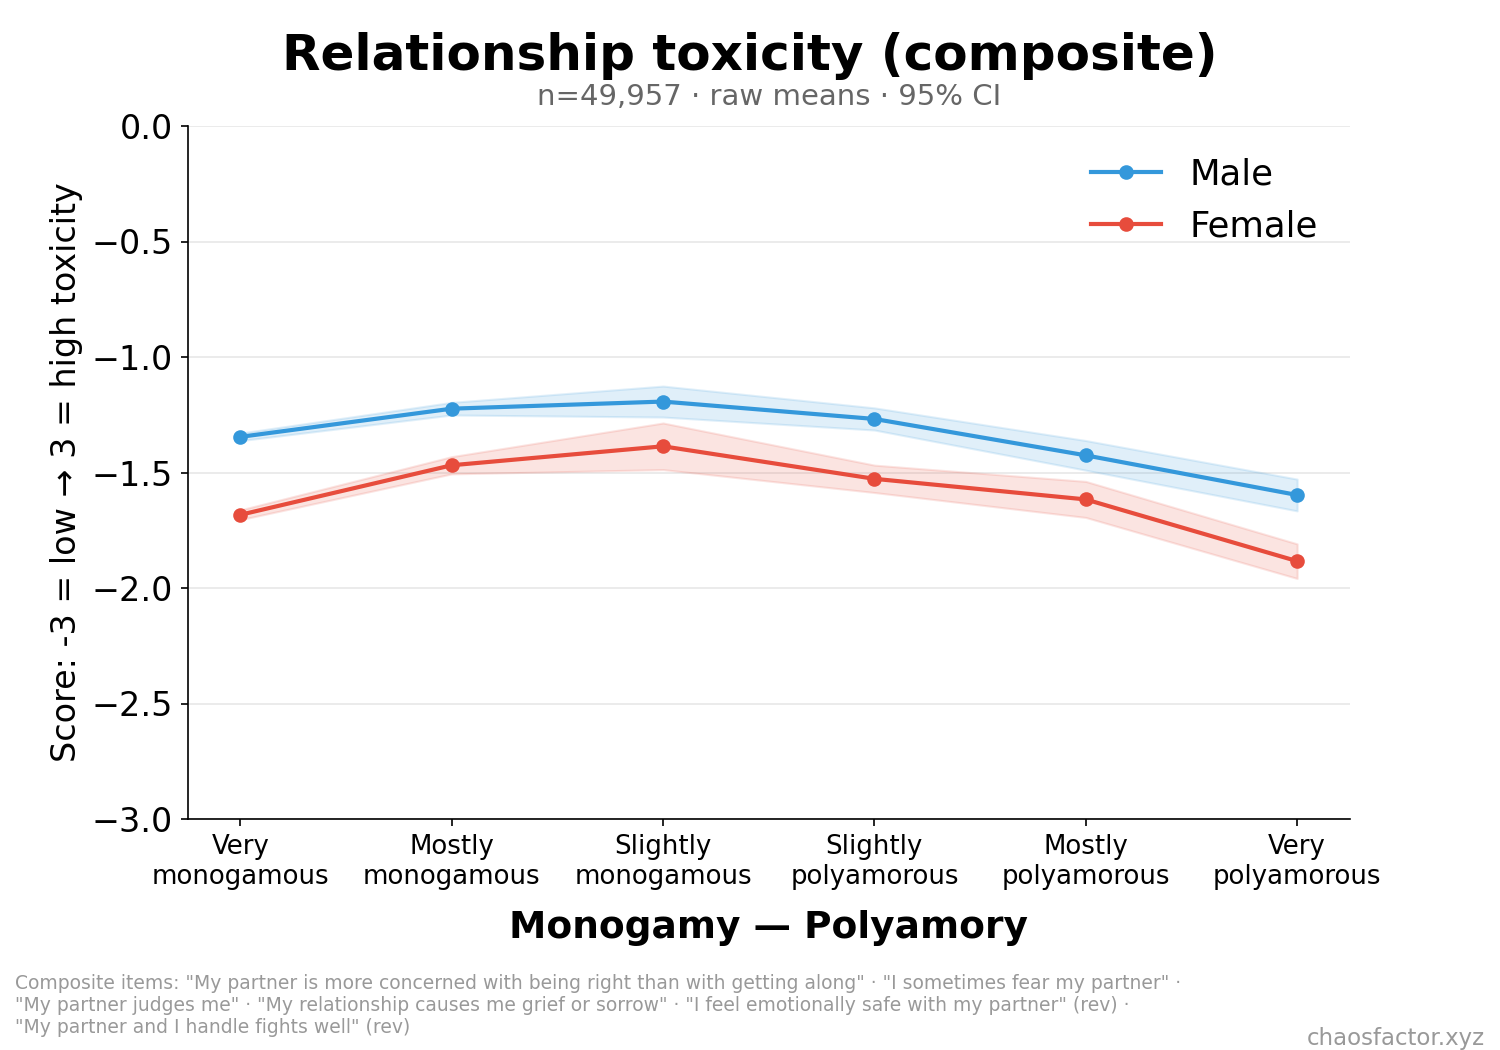
Relationship toxicity (fear of partner, judgment, grief, fights handled badly) shows a gentler inverted-U: worst around "slightly monogamous," best at "very polyamorous."
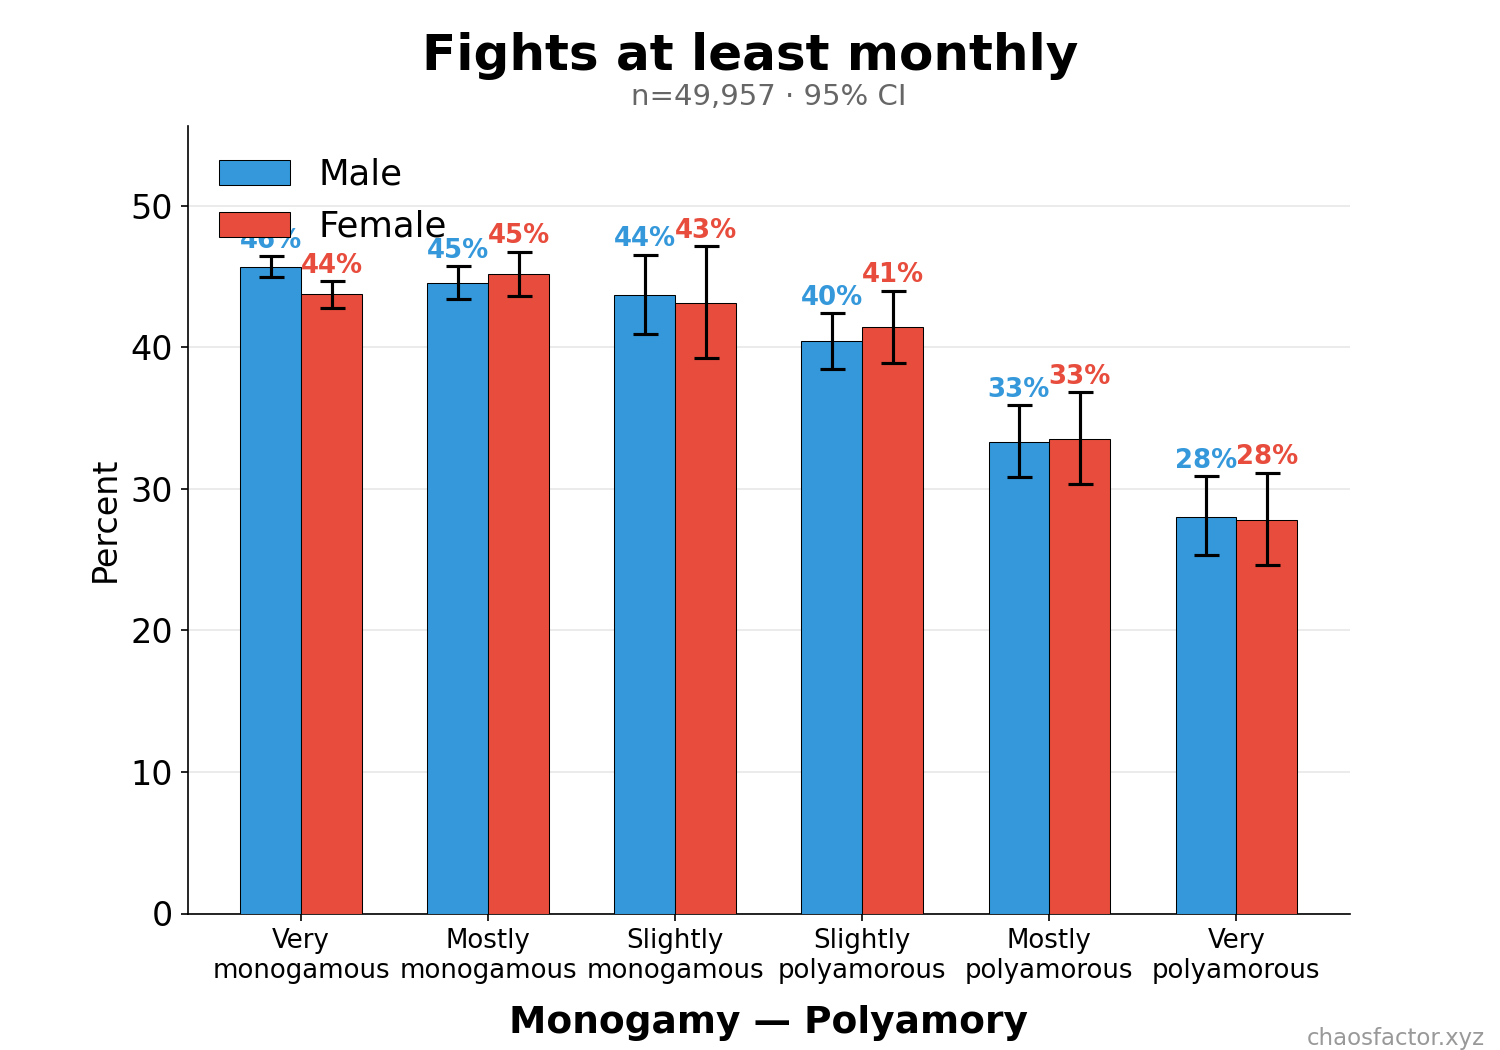
The plain-English version: the share of couples fighting at least monthly falls from ~44–46% among the very monogamous to ~28% among the very polyamorous, nearly identically for men and women.
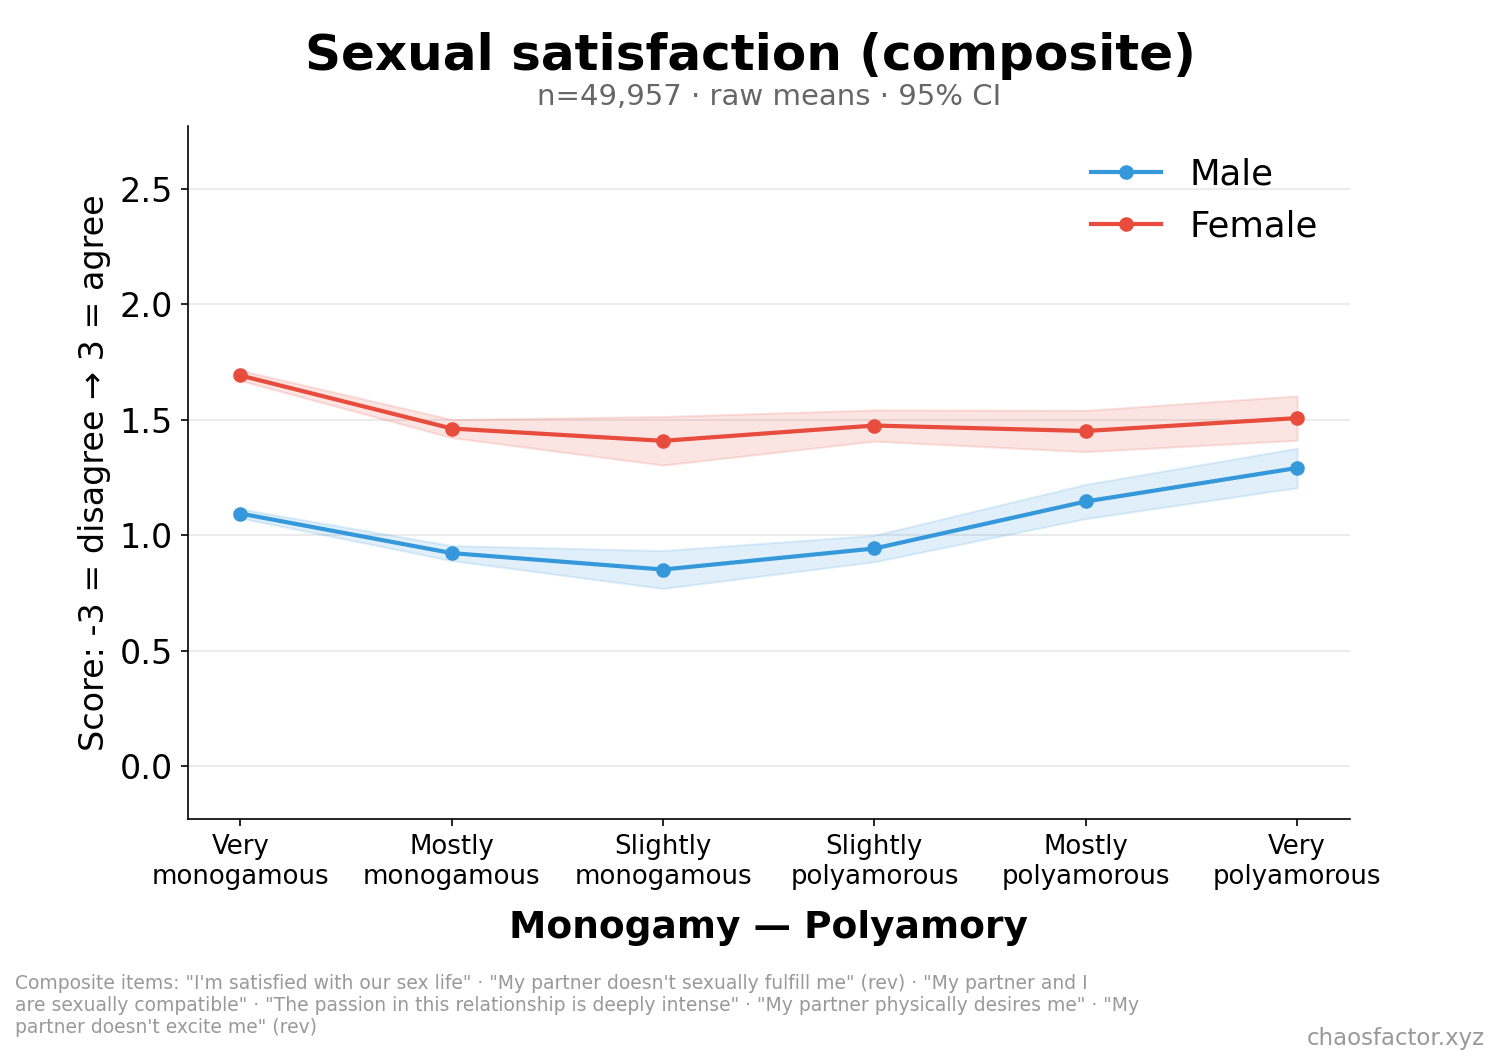
04Sex: satisfaction and frequency move differently
Sexual satisfaction is the one quality measure where "very monogamous" wins for women — their satisfaction is highest at the mono pole (1.69) and never recovers to that level anywhere else. Men instead show the familiar U: very mono (1.09) and very poly (1.29) both beat the middle (0.85).
Frequency of sex with this specific partner peaks in the middle of the spectrum and drops toward the poly end — most visibly for women, who go from a peak of ~1.8×/week at "slightly mono" to ~1.3×/week at "very poly."
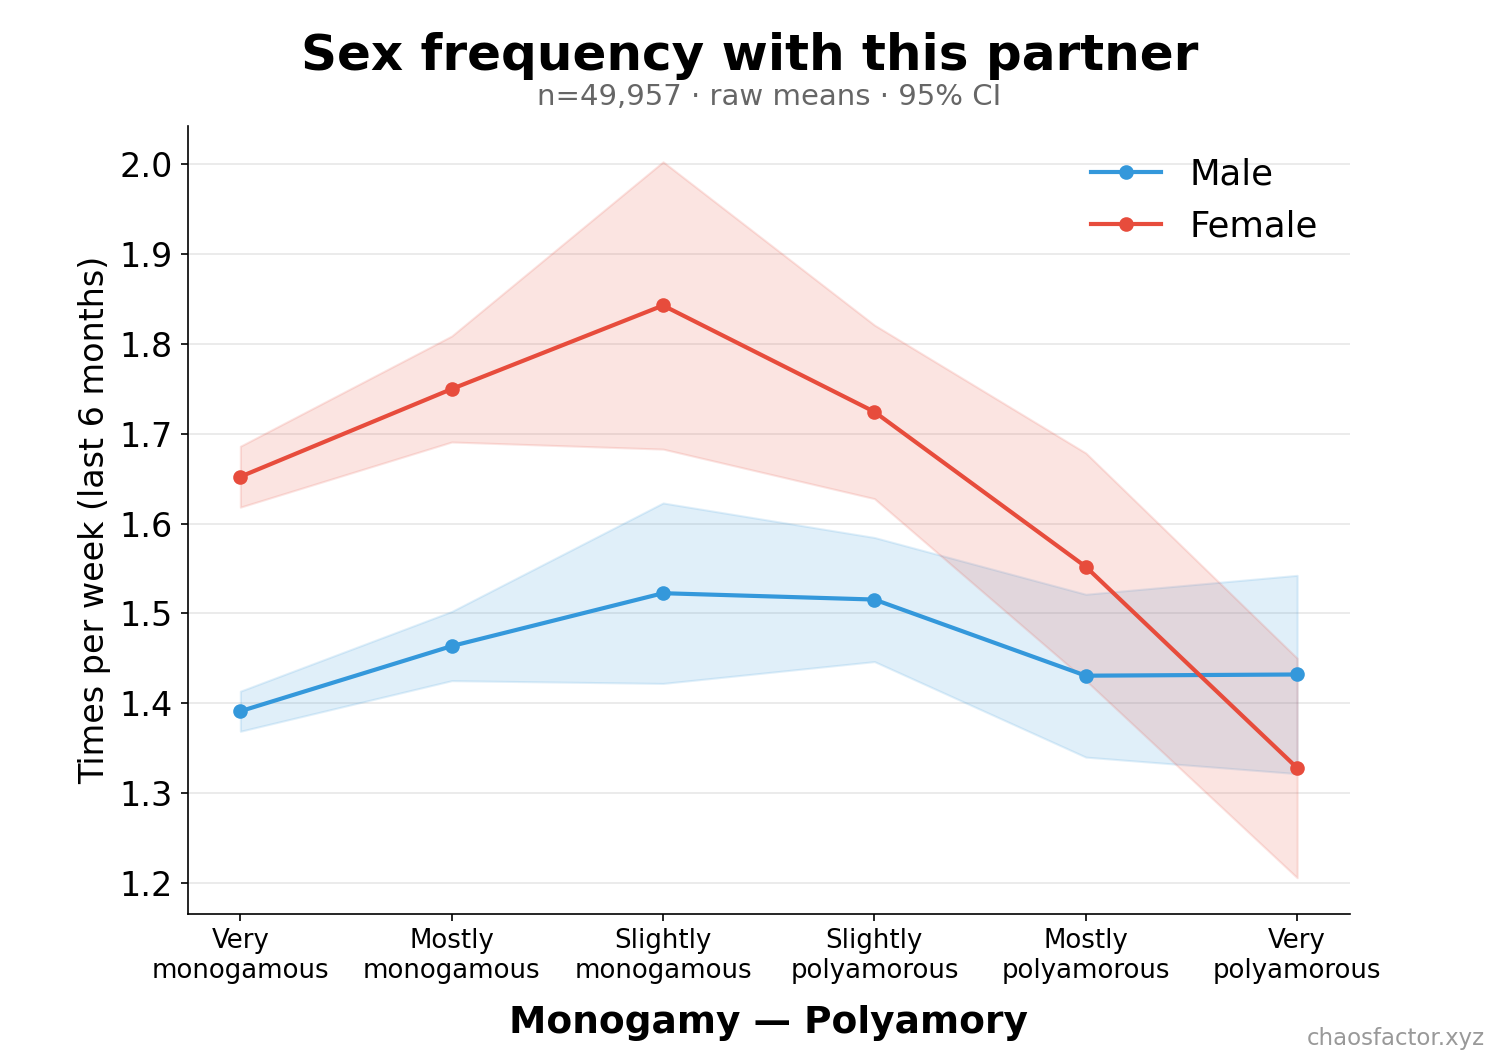
An interesting side-note: women report more frequent sex with their partner than men do at every point on the spectrum. Since these are mostly mixed-sex couples, the populations differ (the women answering are younger, in younger relationships) — relationship length, not sex, is doing most of that work.
05Cheating: an inverted U, peaking in the middle
"Have you or your partner ever cheated on each other?" produces the sharpest non-linear pattern in the survey. Among the very monogamous, ~10–12% of relationships have any cheating. In the middle of the spectrum it's 21–36%. At the very poly end it falls back to 13–19%.
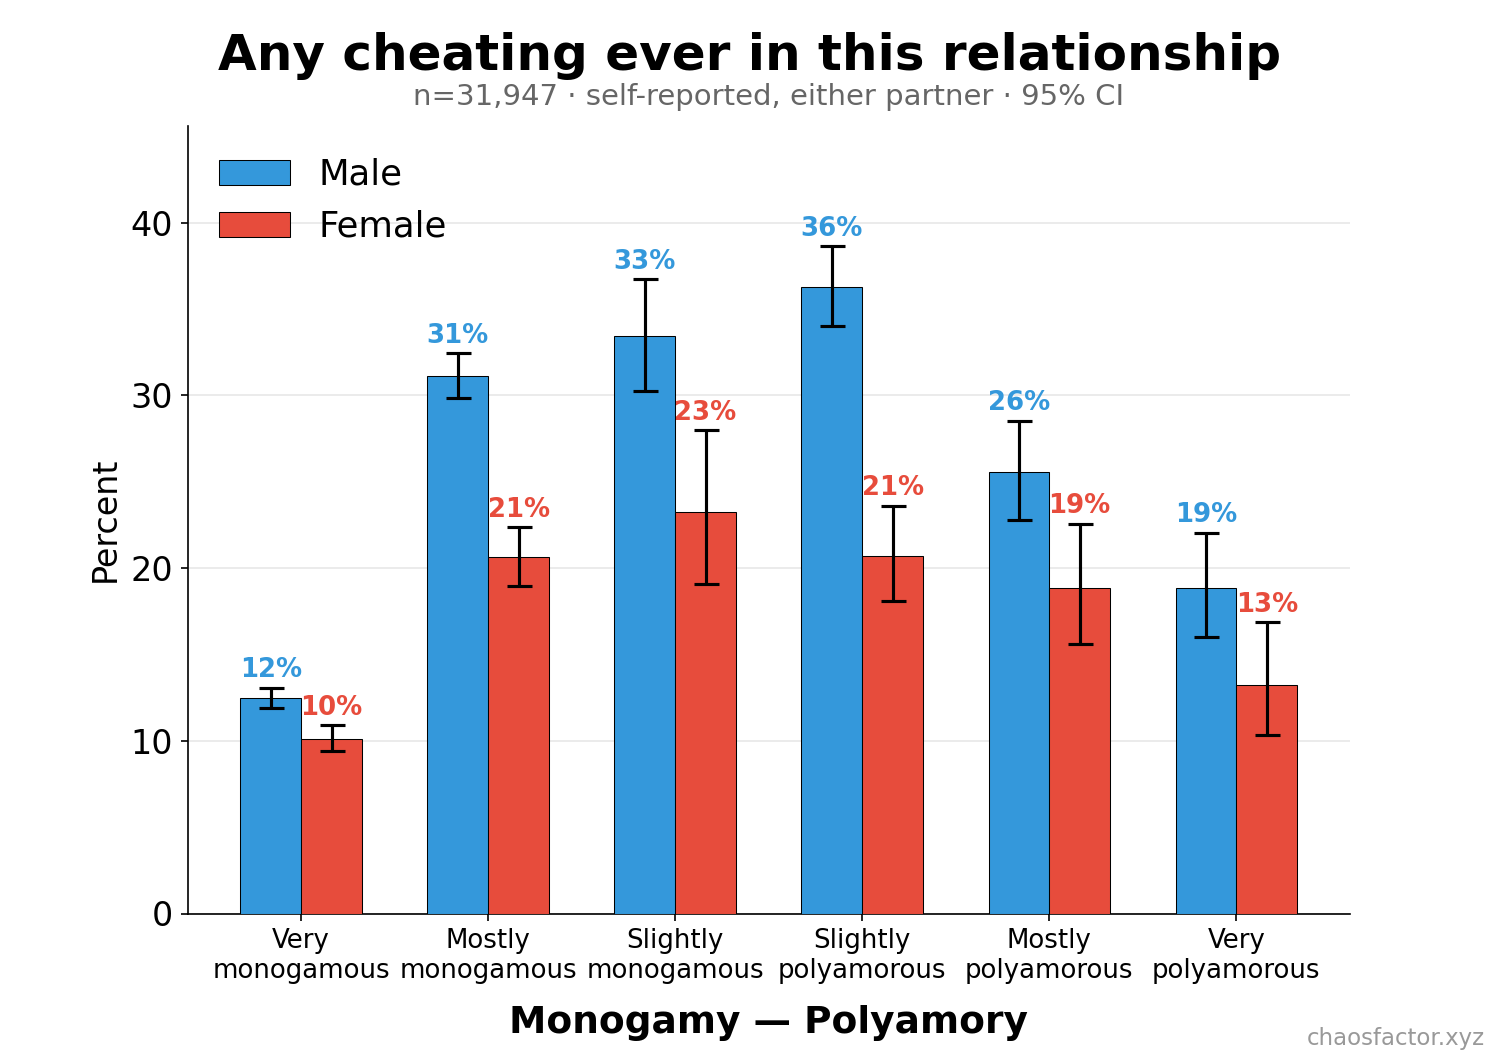
Men report substantially more cheating than women everywhere, and the gap is mostly self-cheating: at "slightly poly," 31% of men say they themselves cheated vs. 16% of women. (Some of this may be reporting honesty rather than behavior.)
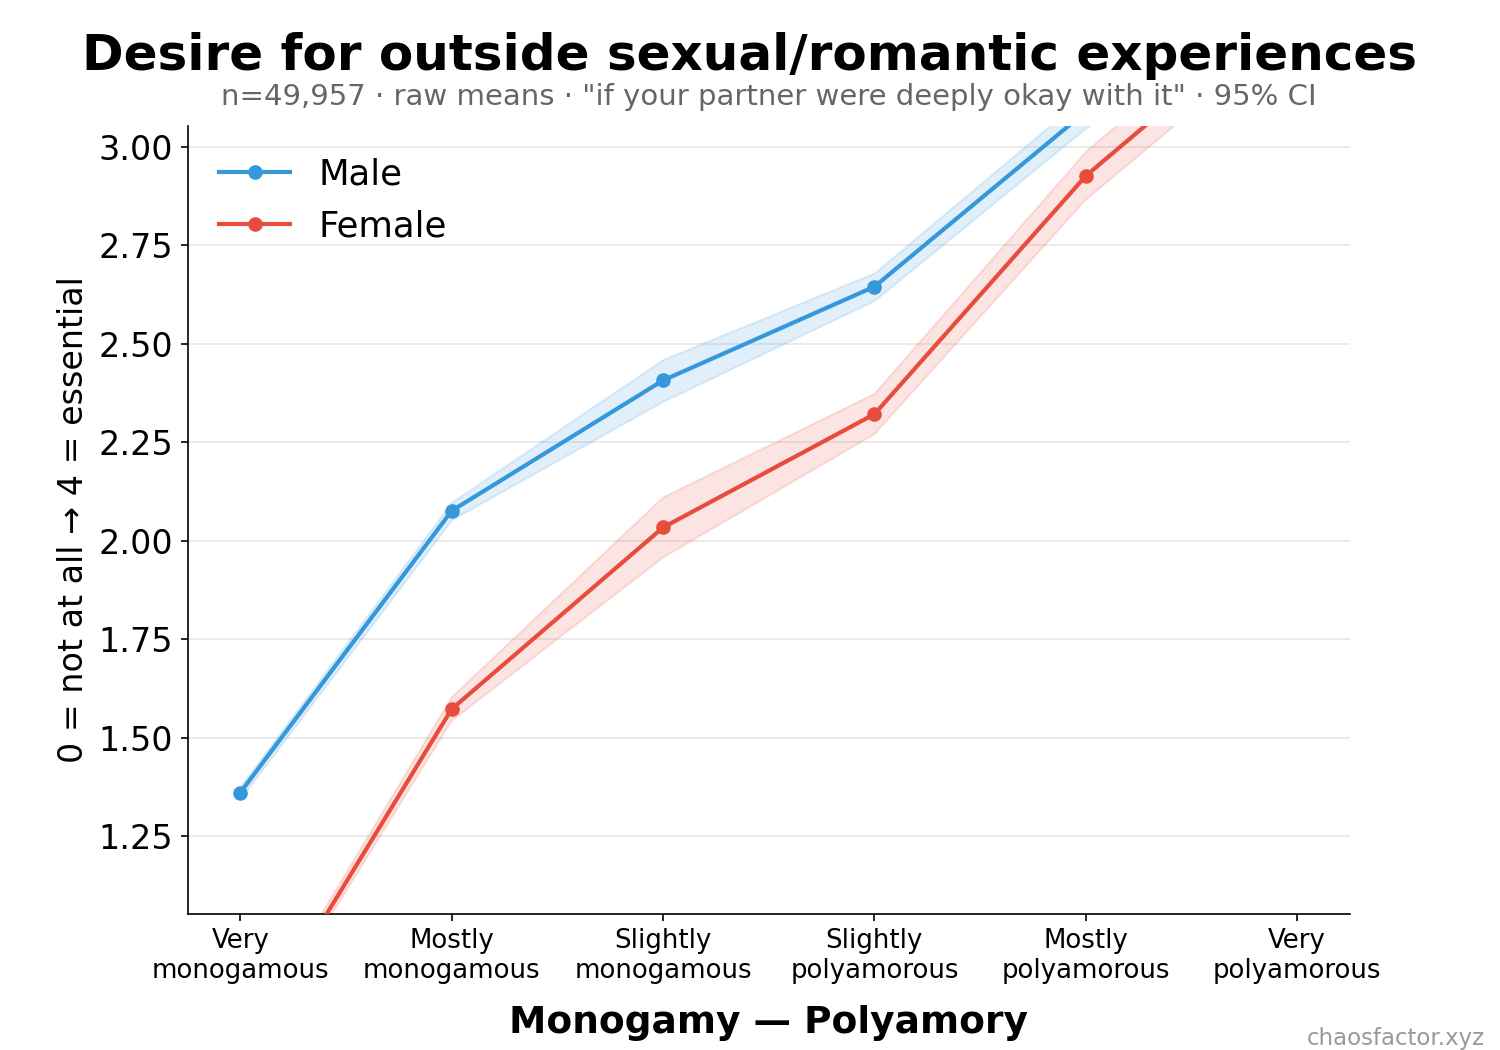
06Desire vs identity: the mismatch is the misery
The survey asks: "In a world where your partner was fully aware and deeply okay with it, how much would you be interested in having sexual/romantic experiences with people besides your partner?" Answers climb smoothly with poly identity — no surprise. The surprise is the sex gap at the mono end: "very monogamous" men average 1.36 on the 0–4 scale, double the women's 0.69. By the poly end, the sexes converge almost exactly.
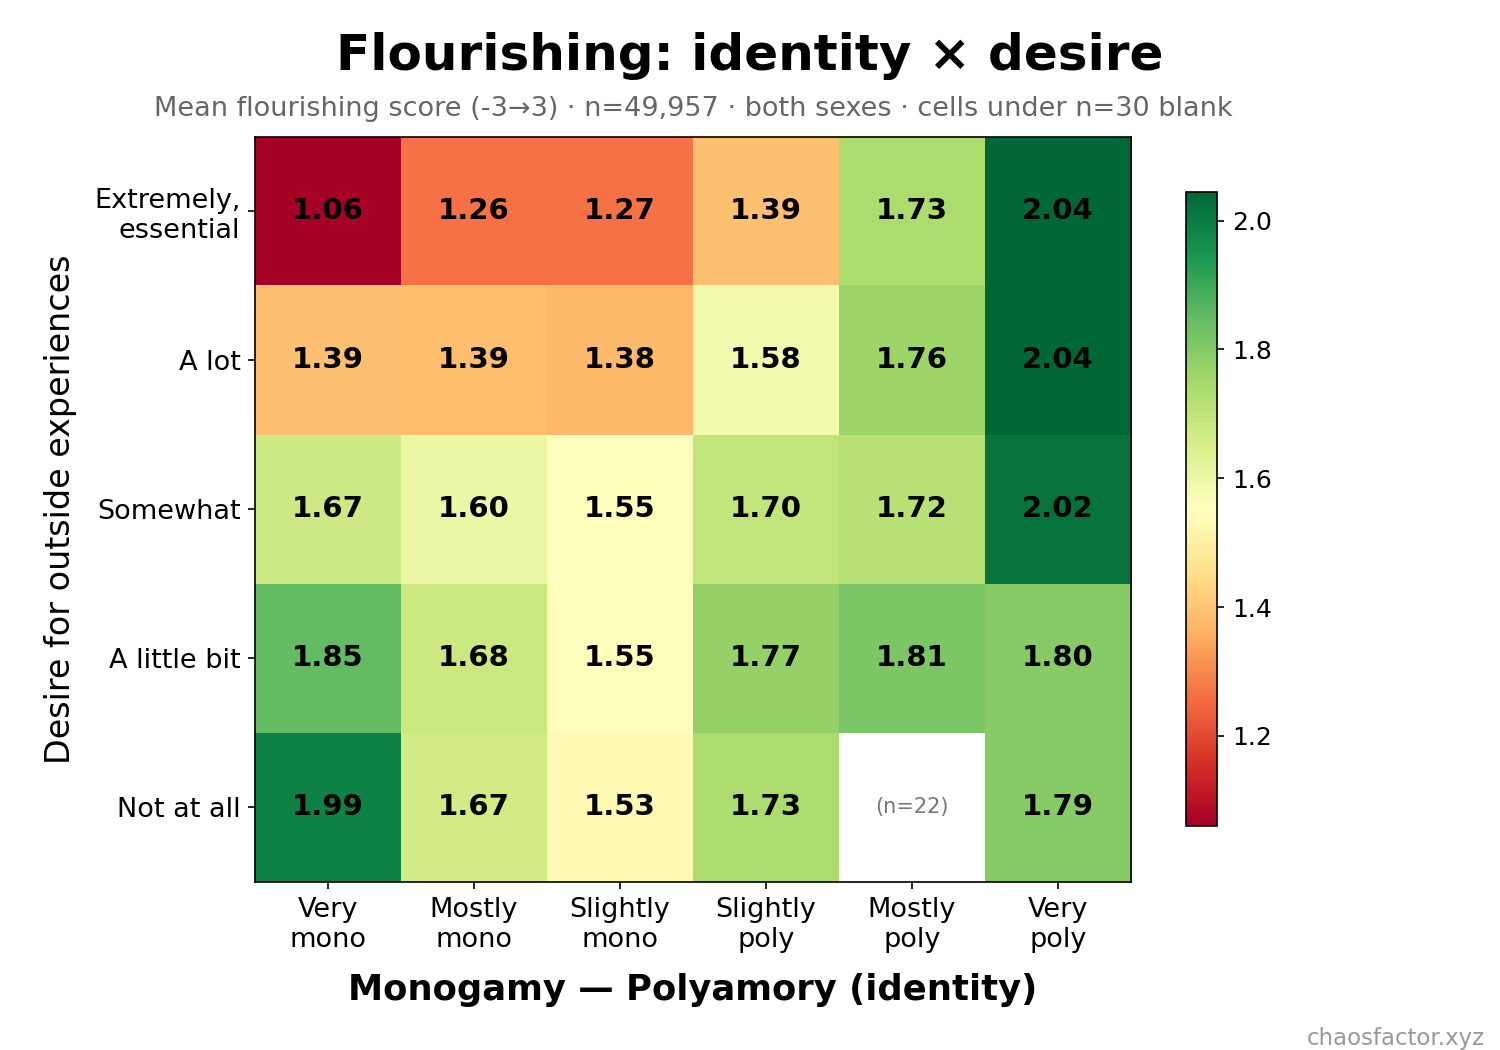
Crossing identity with desire is the most informative chart in this report. Read it diagonally: the happiest cells are matched cells — mono people with no outside desire (1.99), poly people whose desire is high (2.04). The most miserable cell in the whole table is very-monogamous people who call outside experiences "extremely essential" (1.06). Wanting what you have beats both monogamy and polyamory per se.
07Robustness: the patterns survive the obvious objections
Things checked, none of which meaningfully change any chart above:
- Demographic controls. Adjusting every composite for age, age², relationship length, kids, marriage, religiosity, and partner's sex (OLS predictive margins, per sex) reproduces the raw lines almost exactly — see the full grid below. The poly end's advantage is not an artifact of poly people being older, less religious, or more same-sex-partnered.
- Trolls and liars. Restricting to people who said they answered "fully honestly" (vs. including "mostly") changes means by ≤0.07 everywhere.
- Same-sex relationships. Restricting to man–woman couples only: same curves.
- Multiple partners. Restricting poly respondents to those with exactly one current partner (so everyone describes their whole romantic life): the U flattens slightly at the very-poly end (1.90 vs 1.97 for men) but the shape survives.
- Audience effects. Respondents whose partner watched them take the survey scored +0.4 to +0.9 higher on flourishing/sex/openness — so they were removed from the sample entirely (~3,200 people).
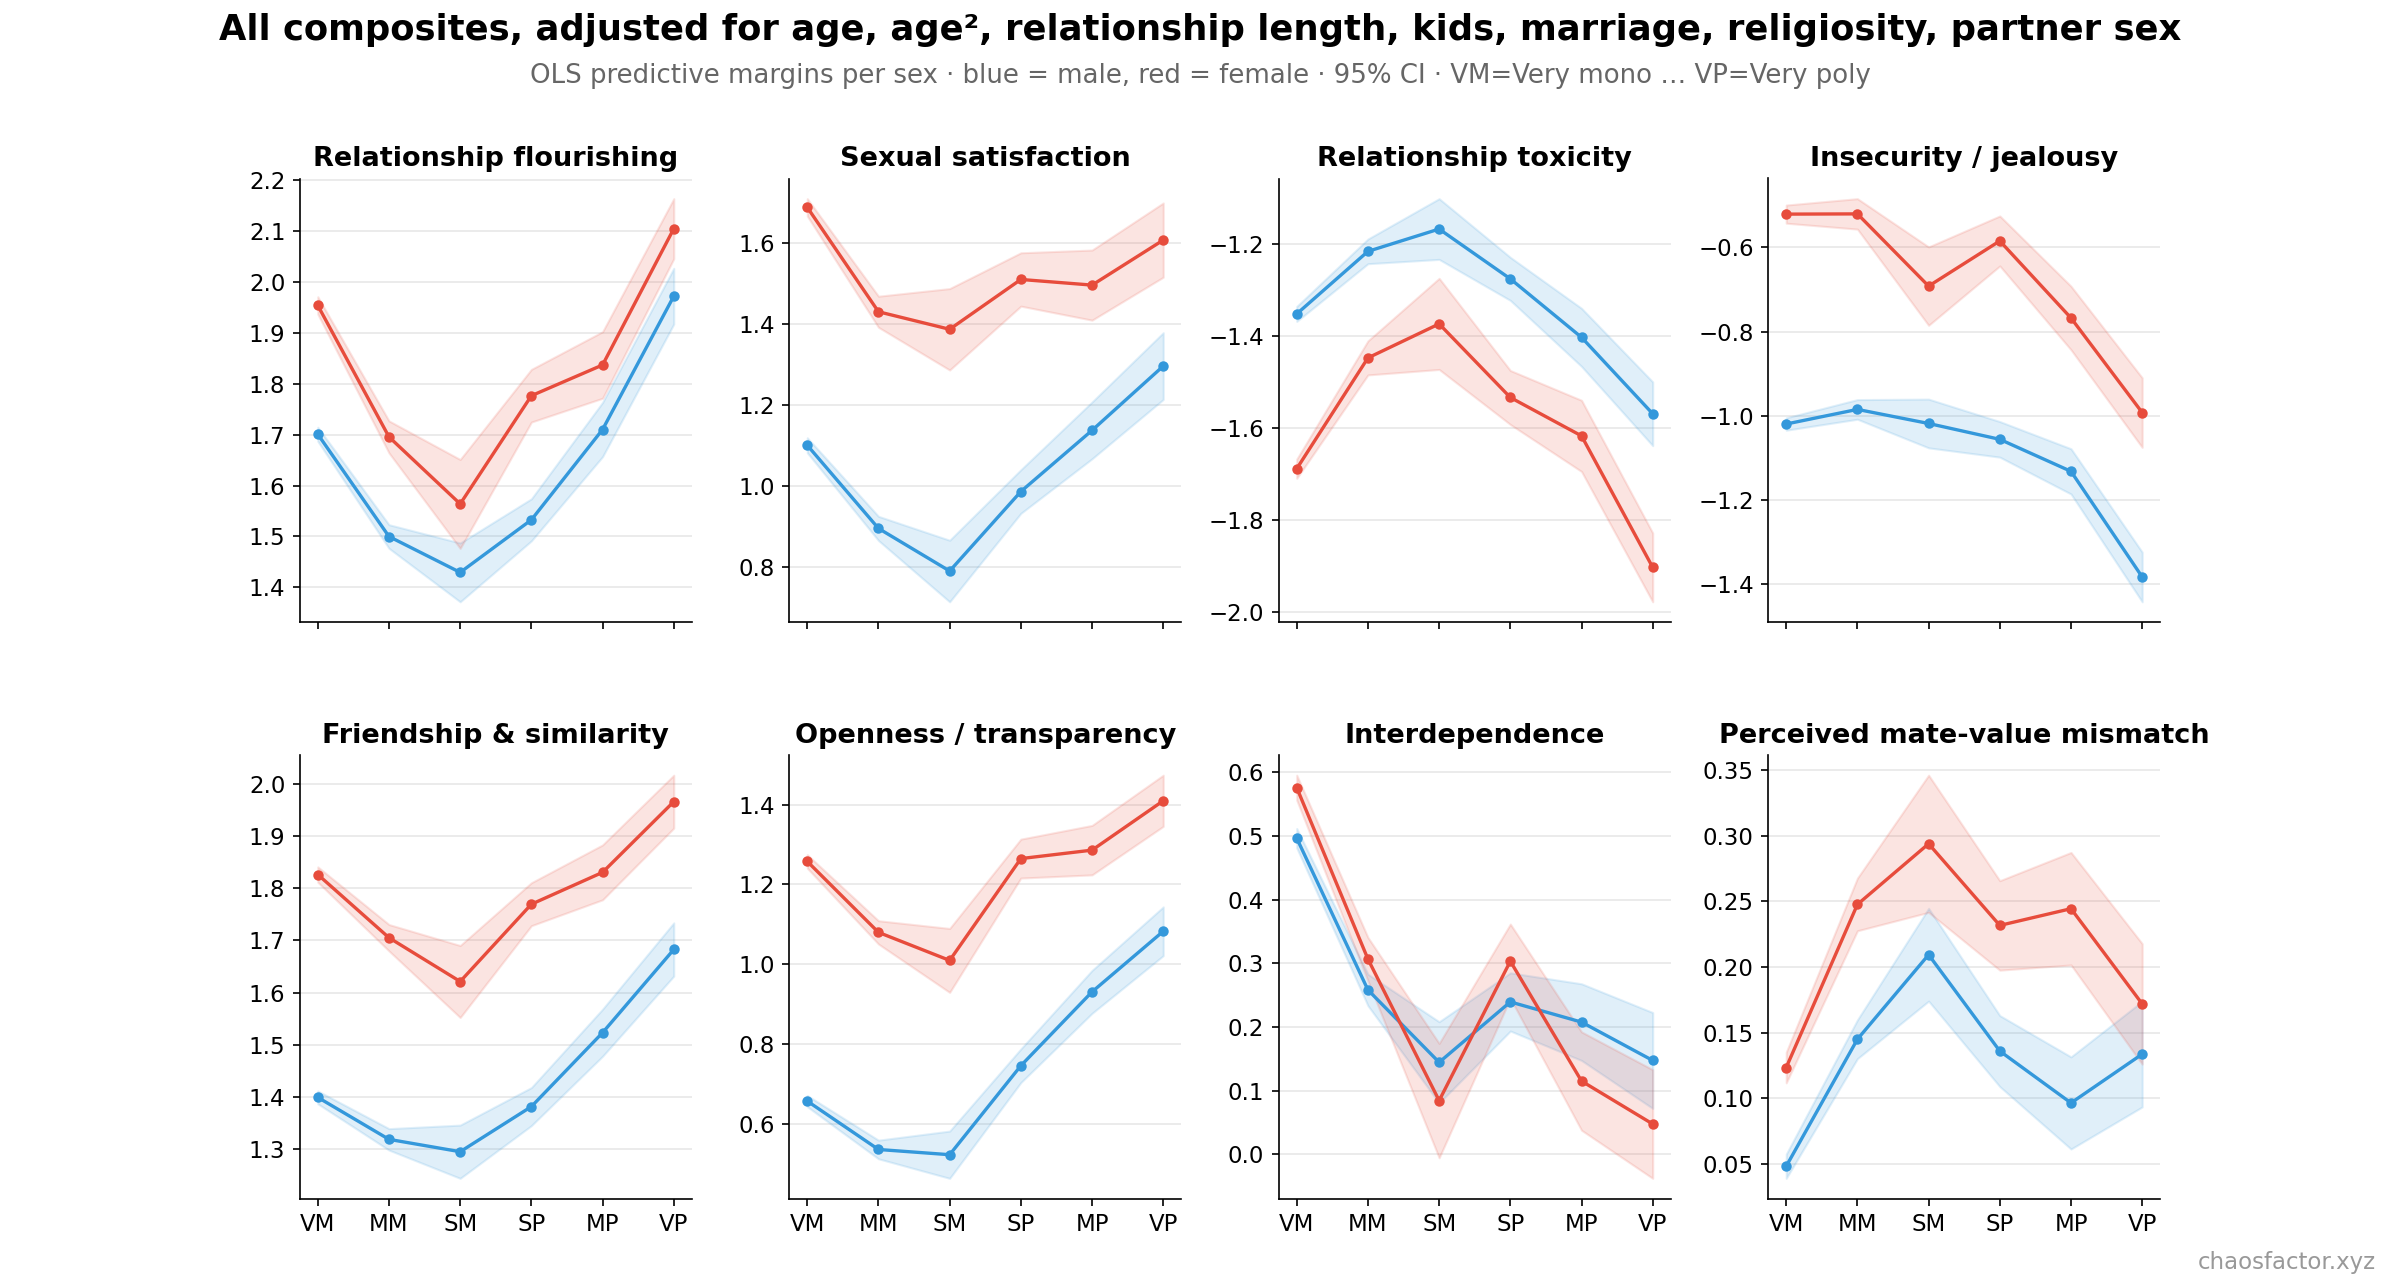
Two of the eight composites don't fit the U-template, and both make sense: interdependence (entwined logistics, partner-dependent identity) is highest among the very monogamous and falls poly-ward — by design, poly distributes dependence. Perceived mate-value mismatch ("I could date someone better than they could") is lowest among the very monogamous and peaks in the middle — the middle again looking like the home of people who half-want out.
08Methodology & limitations
Source
Aella's Your Relationship Survey (GuidedTrack), distributed via her Twitter/blog/website, collected December 2022 – June 2026. Respondents must self-identify as currently in a romantic relationship. Multi-partner respondents answer about their primary/longest partner and may resubmit for additional partners (resubmissions are excluded here).
Cleaning (139,880 → 49,957)
| Filter | Rows kept | Dropped |
|---|---|---|
| All raw rows | 139,880 | — |
| Completed the survey (composite scores present) | 63,209 | 76,671 |
| Said they answered "mostly" or "fully" honestly | 60,975 | 2,234 |
| Reports ≥1 current partner | 60,103 | 872 |
| First submission (drops resubmits for extra partners) | 59,397 | 706 |
| Not a repeat taker from an earlier wave | 57,210 | 2,187 |
| Respondent age 18–80 | 53,569 | 3,641 |
| Partner age 16–90 | 53,519 | 50 |
| Relationship length consistent with both ages | 53,409 | 110 |
| Took at least 3 minutes | 53,205 | 204 |
| Partner wasn't watching them answer | 49,957 | 3,248 |
Measures
Composites are means of six 7-point agree/disagree items each (−3 to +3), defined in the survey program itself; the exact item wordings appear under each chart. Error bands/bars are 95% confidence intervals (t-based for means, Wilson for percentages). Adjusted models are OLS with HC1 robust errors, fit separately by sex, with predictive margins evaluated at that sex's covariate means.
Limitations
- Not a representative sample. This is Aella's internet audience: young, online, disproportionately male (63%), poly-friendly, US/Western-skewed. The levels here shouldn't be quoted as population facts; the comparisons across the spectrum are the point, and even those generalize only to similar populations.
- Cross-sectional, observational. Nothing here distinguishes "polyamory causes X" from "people with X choose polyamory." Identity itself may also respond to relationship quality (someone miserable in a mono relationship may start identifying as "slightly mono").
- Survivorship. Only current relationships are sampled. Structures that fail faster look better among survivors.
- Self-report, including the honesty filter itself.
- Primary-partner framing. Poly respondents' secondary relationships are invisible here except through resubmissions, which were excluded to keep one row per person.
- The "slightly monogamous" cell is small (n=1,797) and may be a weird group — people for whom neither label fits.
Analysis pipeline: DuckDB + pandas + statsmodels; cleaning log, scripts, and full results tables available on request.