TL;DRPassion is a clock. Almost nothing else is.
The story of a long relationship in this data: heat trades for security. Passion and sex frequency fall relentlessly and never recover — and the decline tracks the age of the relationship, not the age of the person. Meanwhile jealousy fades, lives intertwine, fear of "I could do better" shrinks toward zero, and overall flourishing stays remarkably level the whole way. Some quieter erosions hide under that flat line: transparency, friendship, and conflict-handling all slowly worsen, and the share of couples who've experienced cheating climbs steadily with exposure. And long relationships mostly do not drift polyamorous: poly identity is flat at every length for men (with a modest late-relationship uptick among women), though the quiet desire for outside experiences creeps upward for everyone.
01The data
Same cleaned sample as the Mono vs Poly report (full cleaning table there): 139,880 raw submissions → 49,957 after removing incompletes, repeat submissions, self-flagged dishonesty, impossible ages/lengths, speeders, and people whose partner watched them answer. For this report, relationship length is binned so every bin stays big, and the 33+ year tail (n=214) is cut as too noisy. Respondents with multiple partners answer about their primary/longest relationship.
| Length | ≤6mo | 7–12mo | 1–2yr | 2–3.5yr | 3.5–5yr | 5–8yr | 8–12yr | 12–16yr | 16–22yr | 22–33yr |
|---|---|---|---|---|---|---|---|---|---|---|
| n | 5,893 | 5,388 | 6,382 | 6,615 | 6,123 | 6,170 | 5,309 | 3,497 | 2,786 | 1,580 |
| n (women) | 3,049 | 2,515 | 2,873 | 2,655 | 2,243 | 2,033 | 1,372 | 762 | 557 | 232 |
Women thin out in the longest bins (the audience skews young and male), so female lines get wide error bands past ~12 years — read the wiggles there with appropriate suspicion.
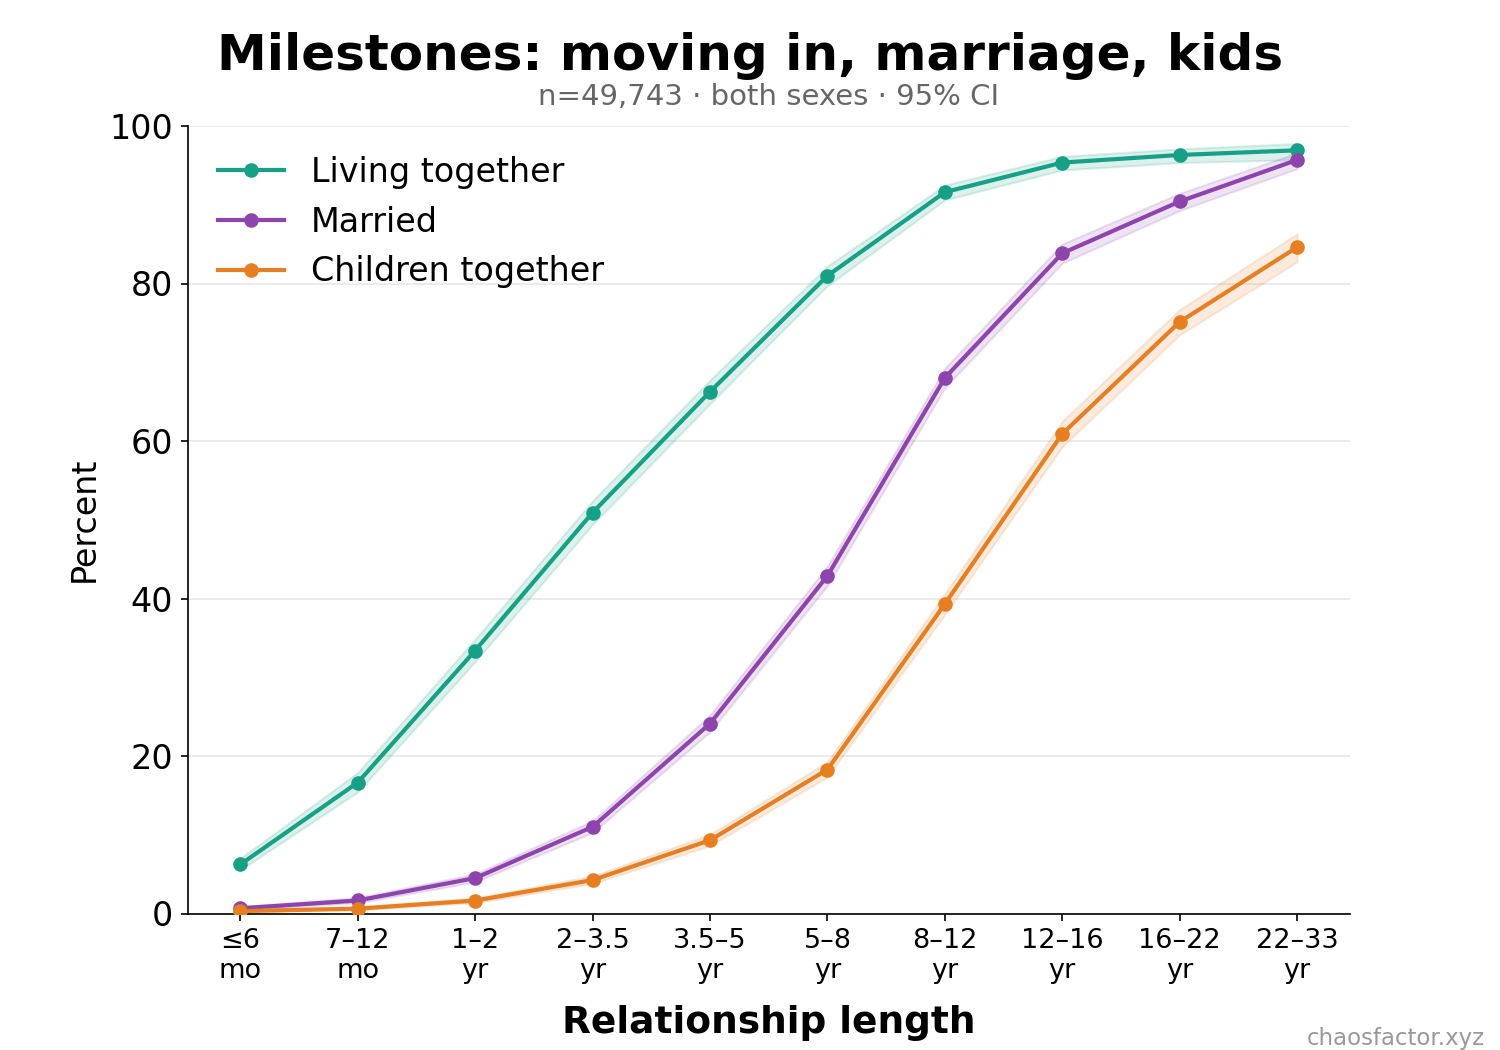
For orientation, the structural milestones look exactly like you'd expect — cohabitation first, then marriage, then kids, with marriage near-universal by 20 years (among survivors; the cohabitation question was only added in later survey versions, so its n is smaller):
02Passion: a ~12-month plateau, then a 30-year slide
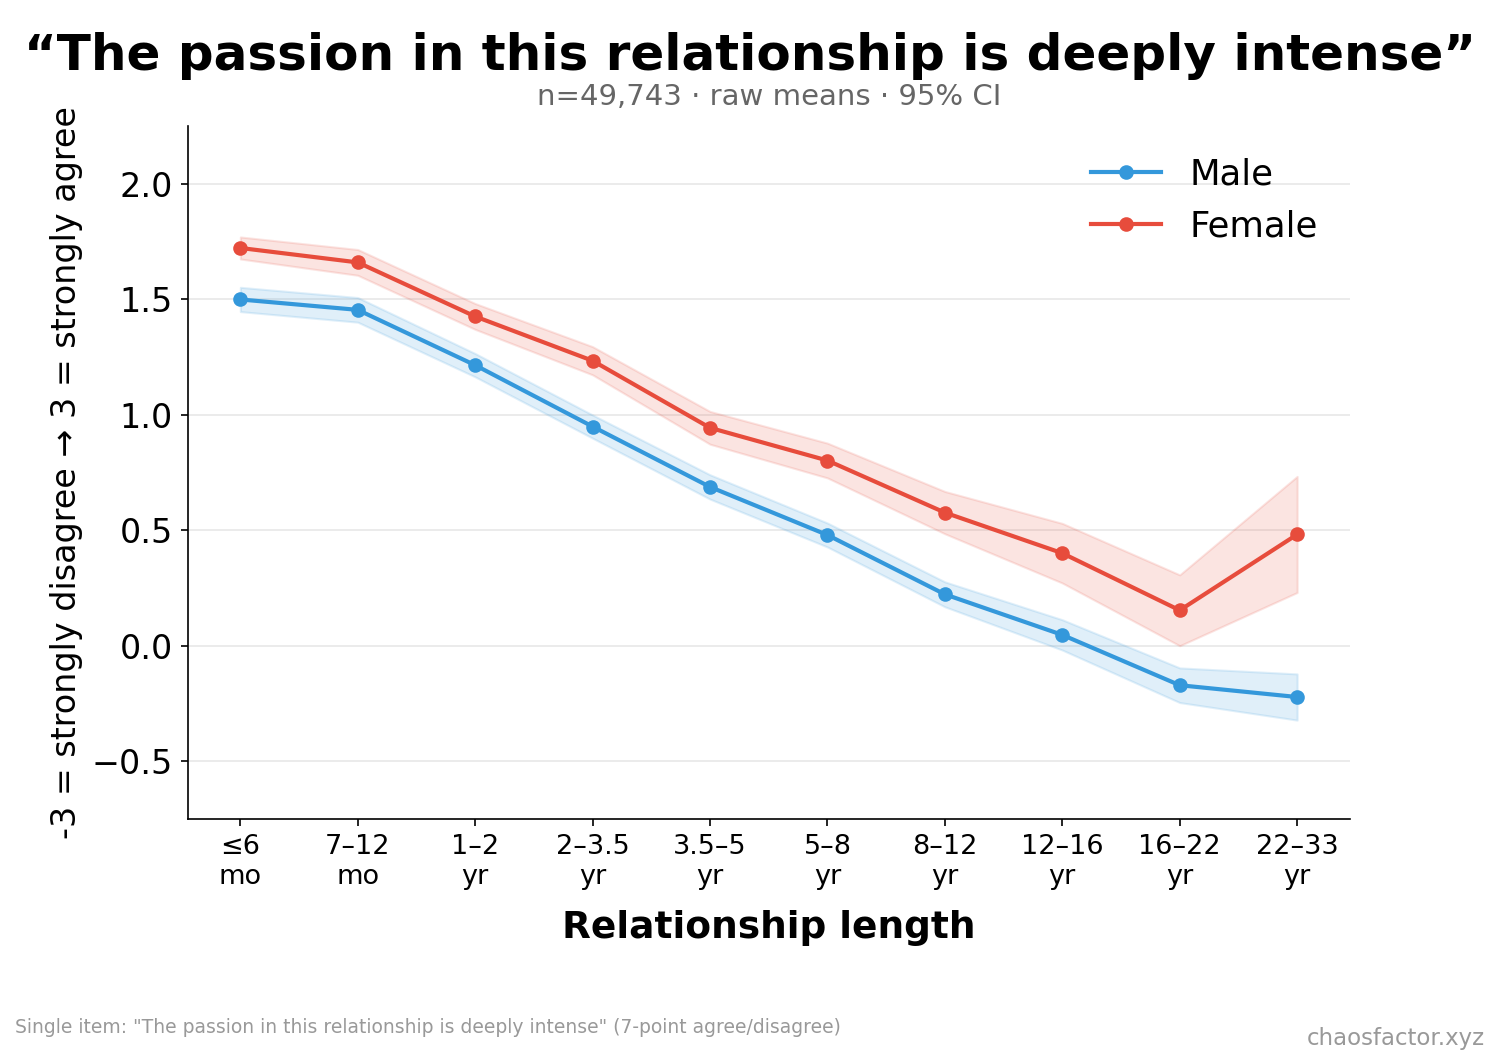
"The passion in this relationship is deeply intense" produces the cleanest time-trend in the survey. It declines essentially monotonically from +1.6 in new relationships to roughly zero — neutral — by the 16+ year bins. Men sit ~0.2–0.4 below women the entire way, and men in 16+ year relationships are the only group whose average dips below neutral.
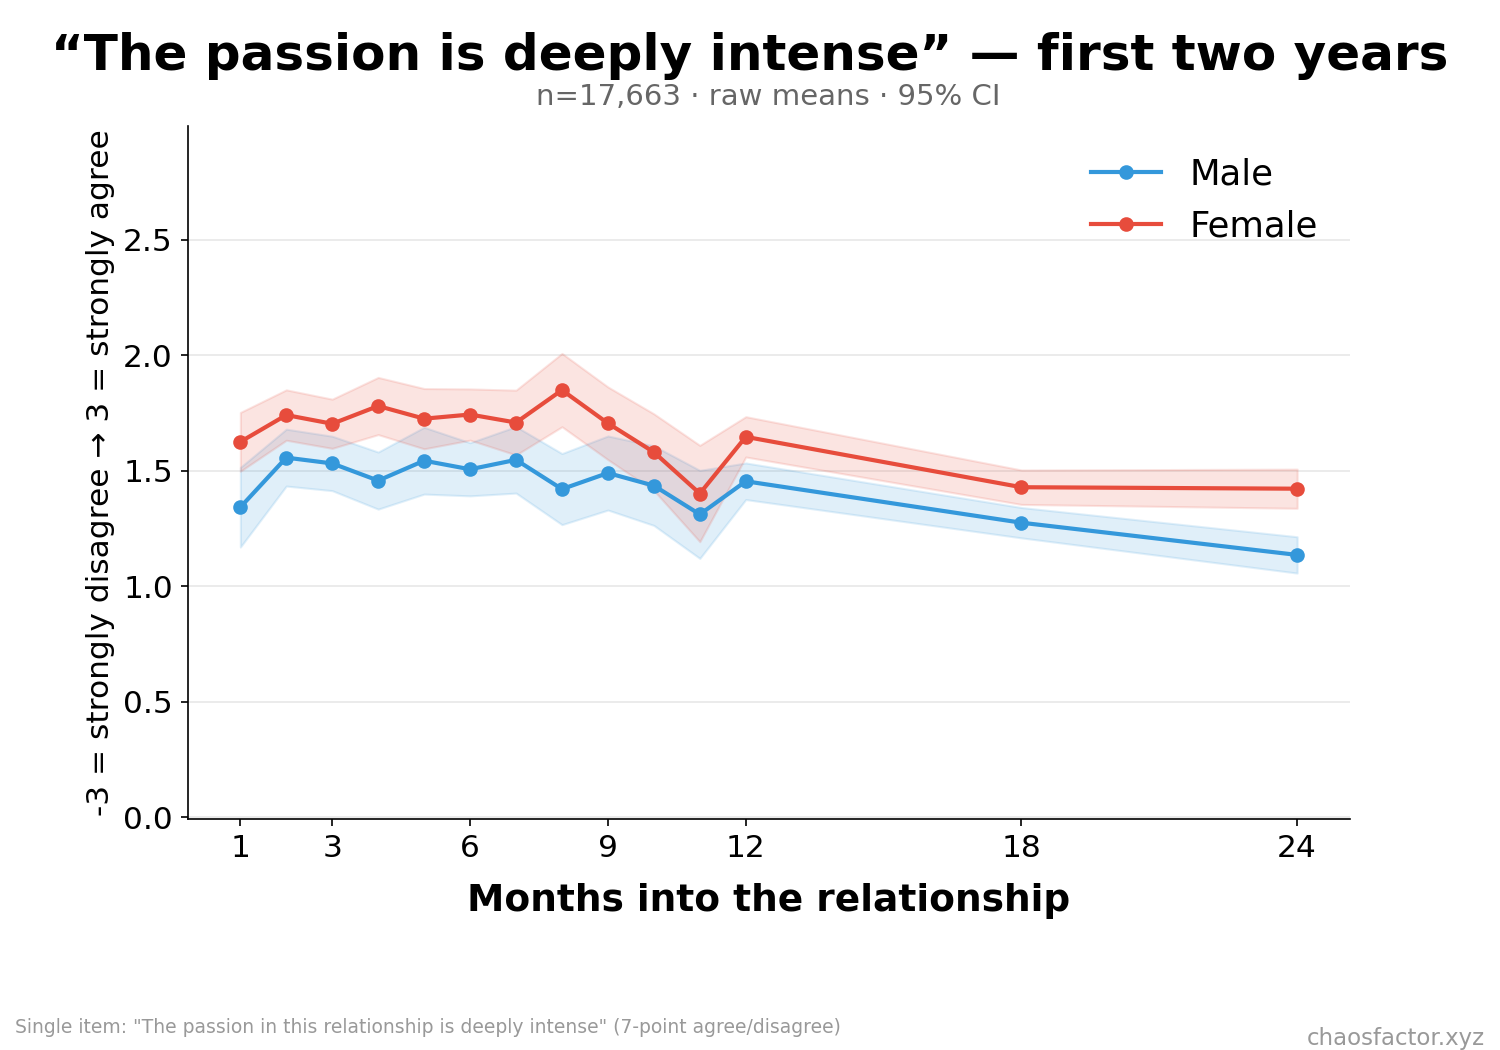
Zooming into the first two years month-by-month: passion doesn't decline at first. It holds a high plateau (~1.6) through roughly month 9–10, wobbles, and is measurably lower by 18–24 months. The honeymoon is real, and it lasts about a year.
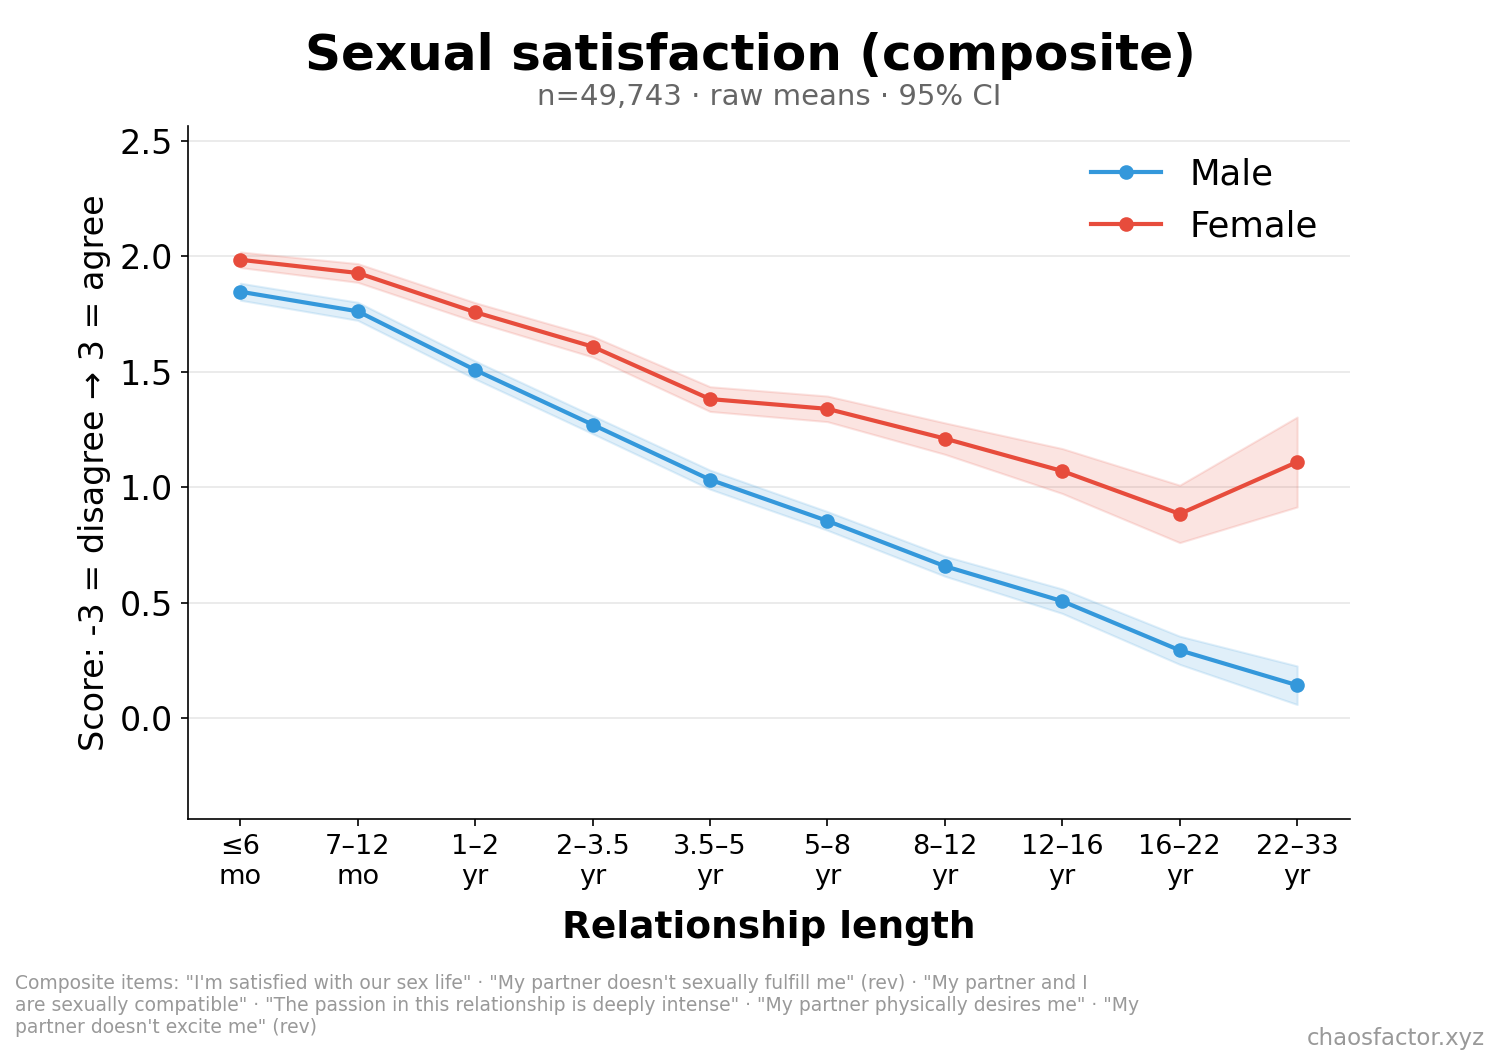
Sexual satisfaction as a whole (a six-item composite, not just passion) follows the same slope: from +1.92 in brand-new relationships to +0.28 at 22–33 years — still net-positive, but the largest decline of any composite in the survey.
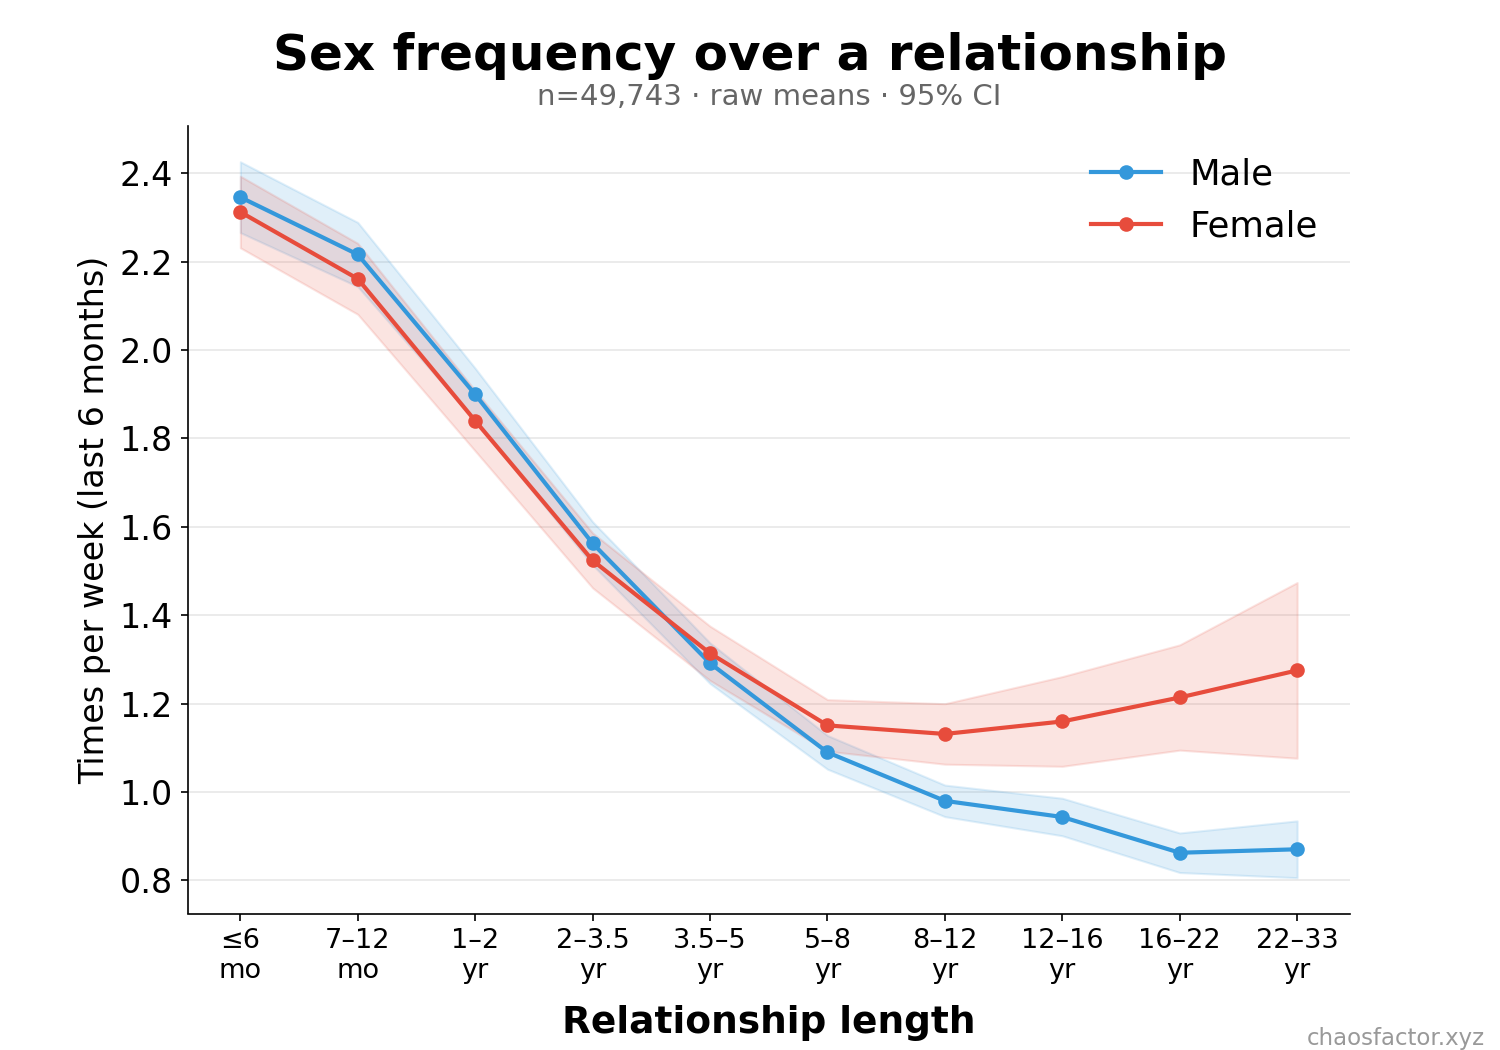
03Sex: the relationship clock beats the body clock
Sex frequency halves over the first five years — from ~2.3×/week to ~1.3×/week — and keeps sliding to just under 1×/week in 16+ year relationships. Men and women track each other closely until the long bins (where the small female samples drift upward).
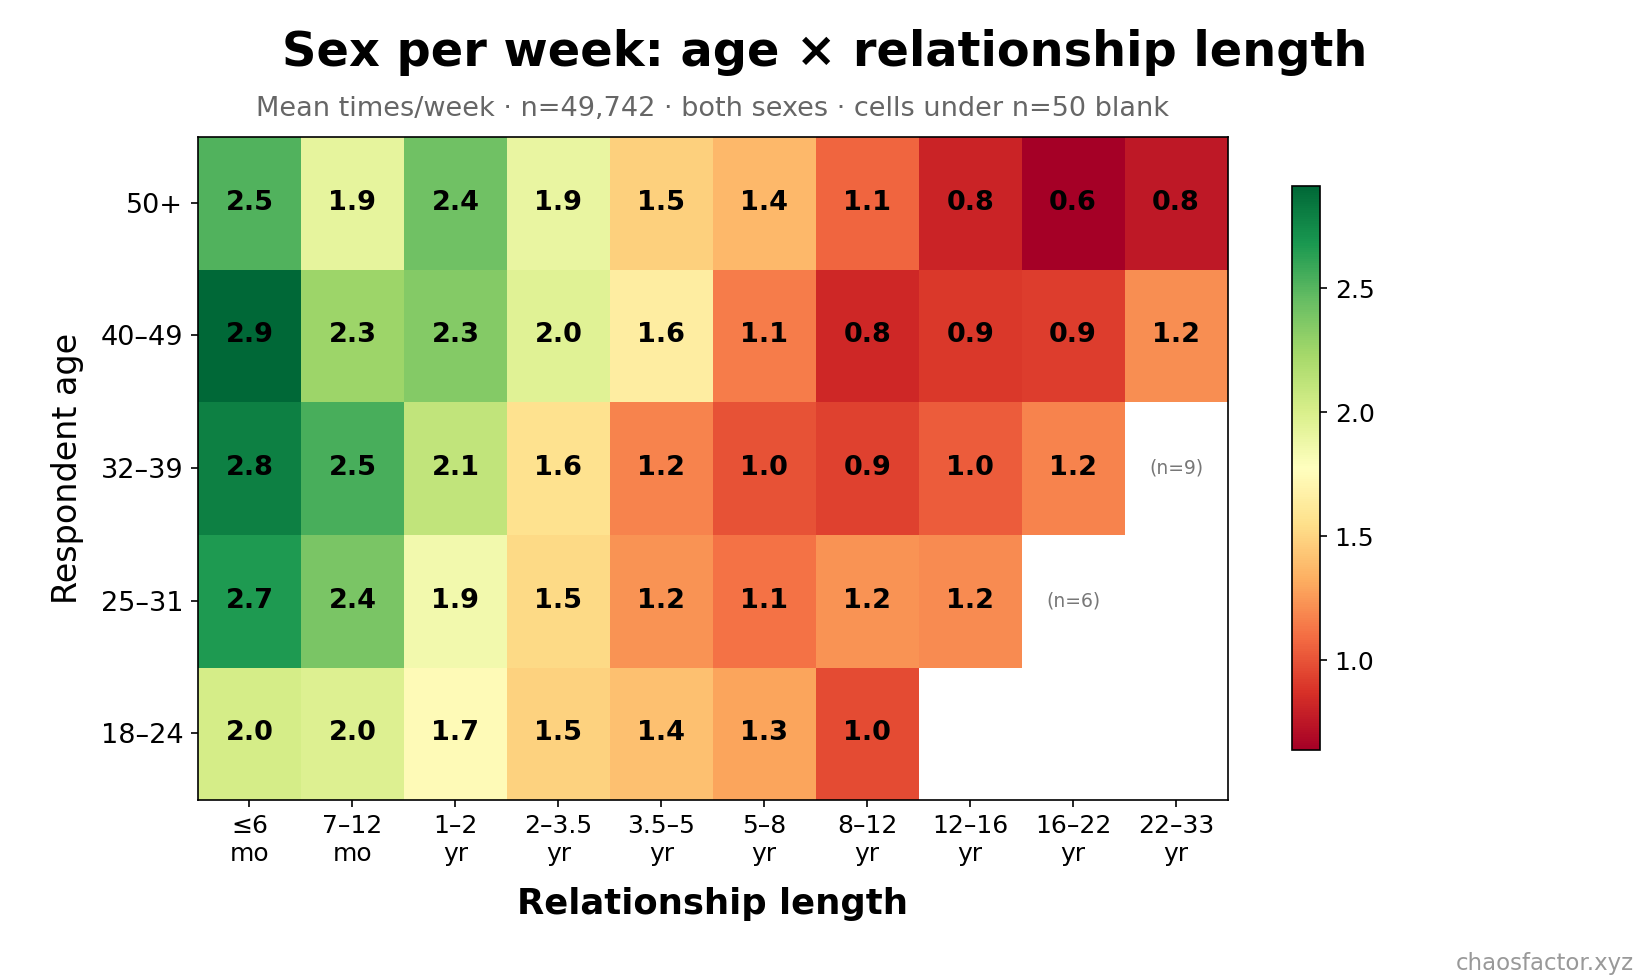
Is that decline about getting older, or about the relationship getting older? Cross the two and the answer is unambiguous: within every age band, frequency falls steeply with relationship length; within every length bin, it barely changes with age. People aged 50+ in relationships under six months report ~2.5×/week — more than 25-year-olds five years into a relationship. The relationship clock dominates.
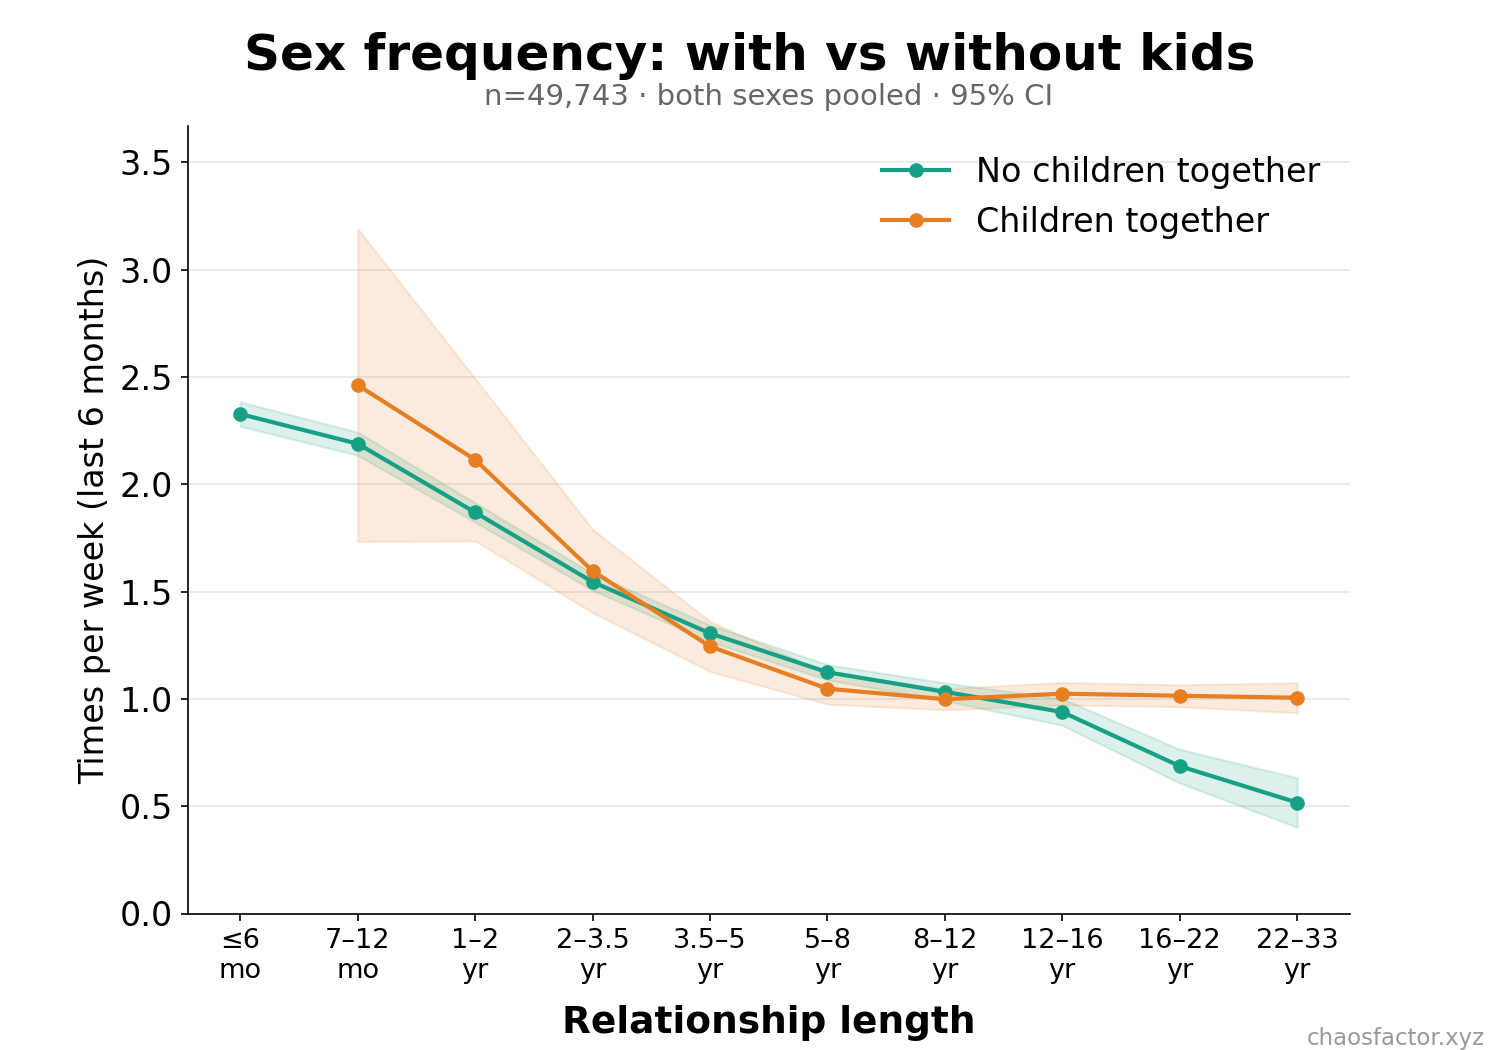
Two follow-ups worth seeing. First, kids: couples with children together show slightly more sex in the long bins than long childless couples (1.0 vs 0.5–0.7×/week at 16+ years) — at minimum, "kids destroy your sex life" doesn't show up as a long-run difference here (selection warning: who has kids, and who stays together childless for 20 years, are both unusual groups).
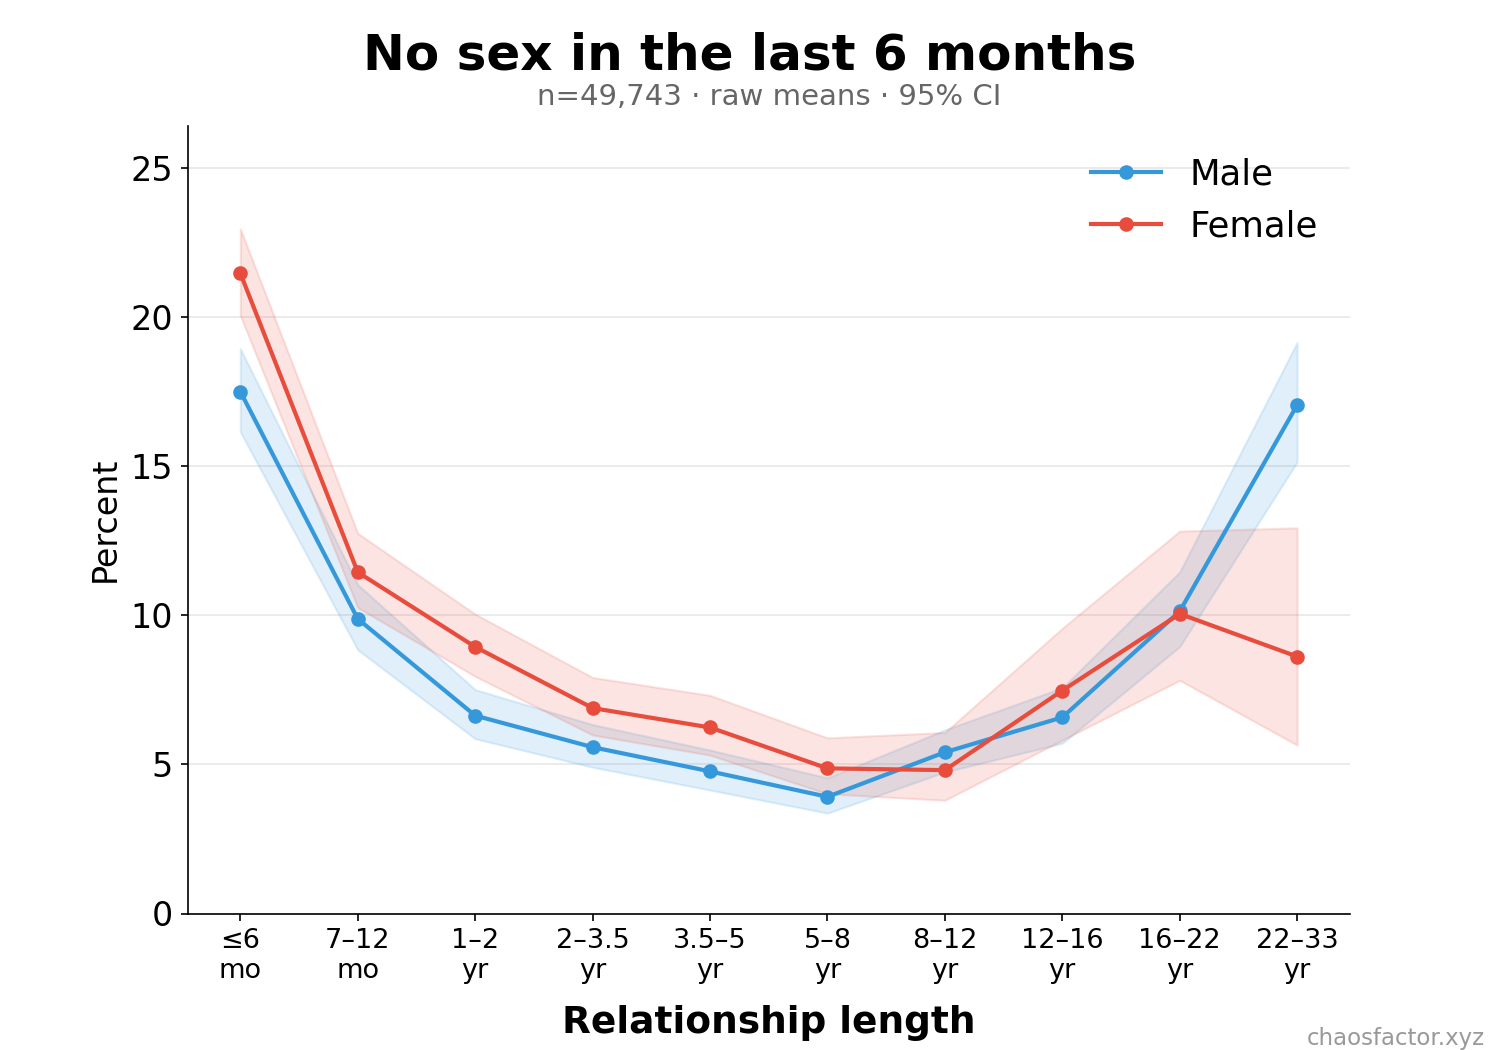
Second, sexlessness is a U-curve made of two different things. In new relationships it's couples who haven't started yet (18% of ≤6-month couples have never had sex; only 1% have stopped). In old relationships it's couples who stopped: by 22–33 years, 13% report no sex in the last six months and another 2.5% say they've never had sex at all.
04What improves: security, and the entangling of lives
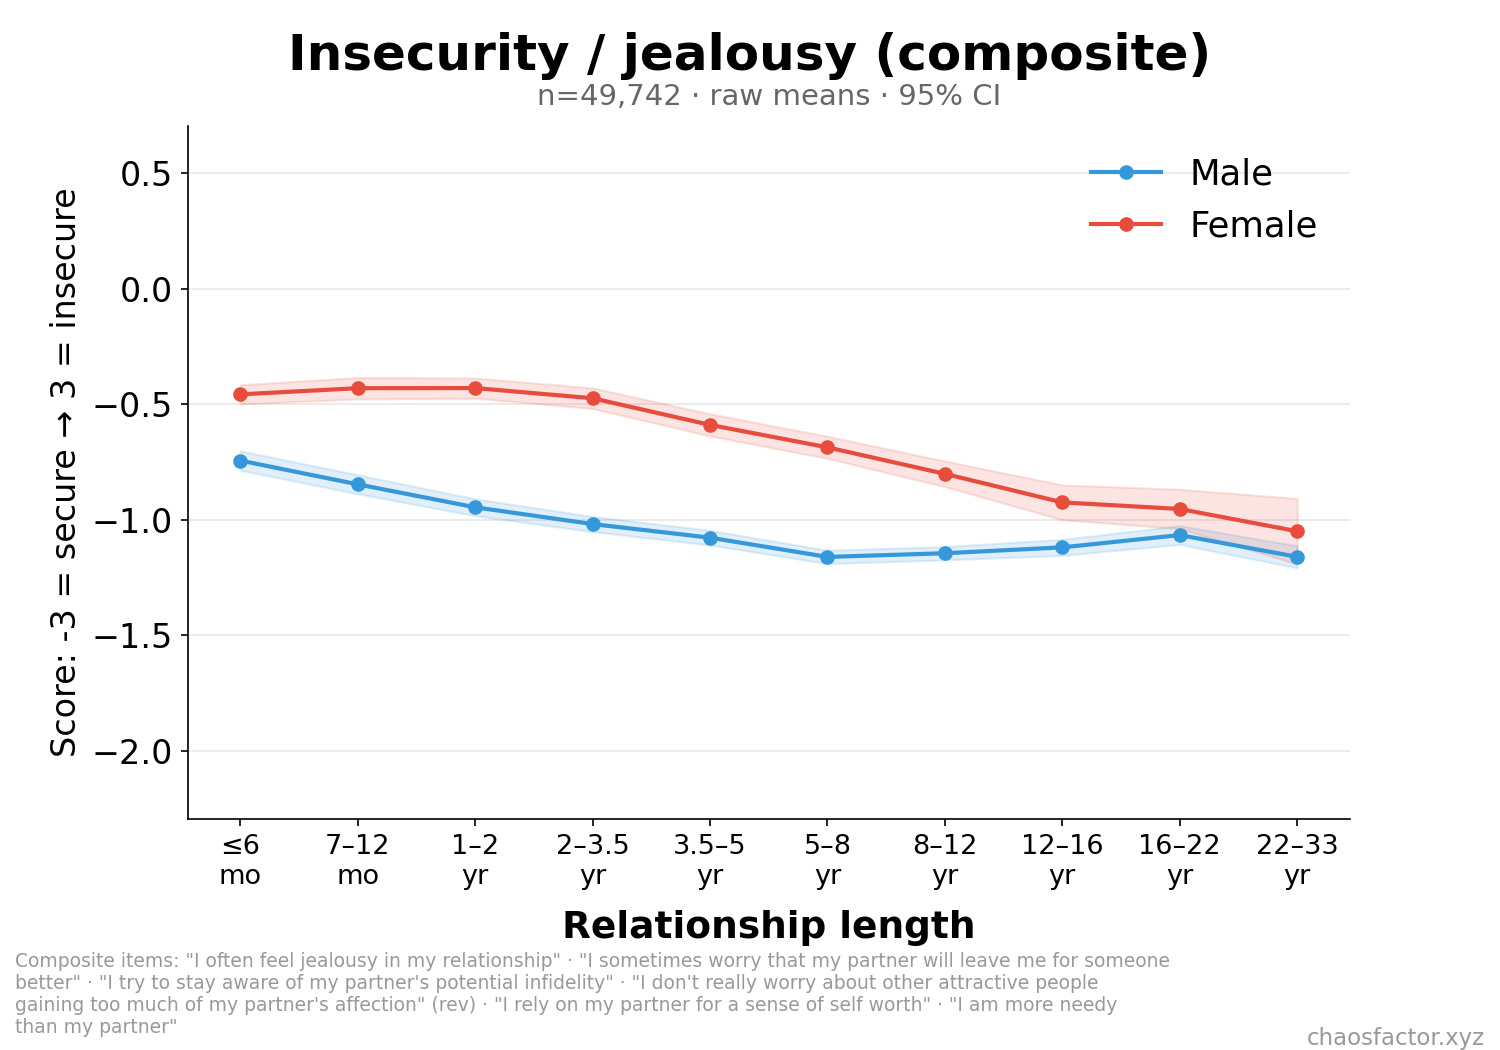
Insecurity — jealousy, fear of being left, monitoring for infidelity — declines with length, but on different schedules: men's decline starts immediately, while women stay elevated through roughly year three before theirs begins. Women are more insecure than men at every length, with the gap narrowing to almost nothing in the longest bins.
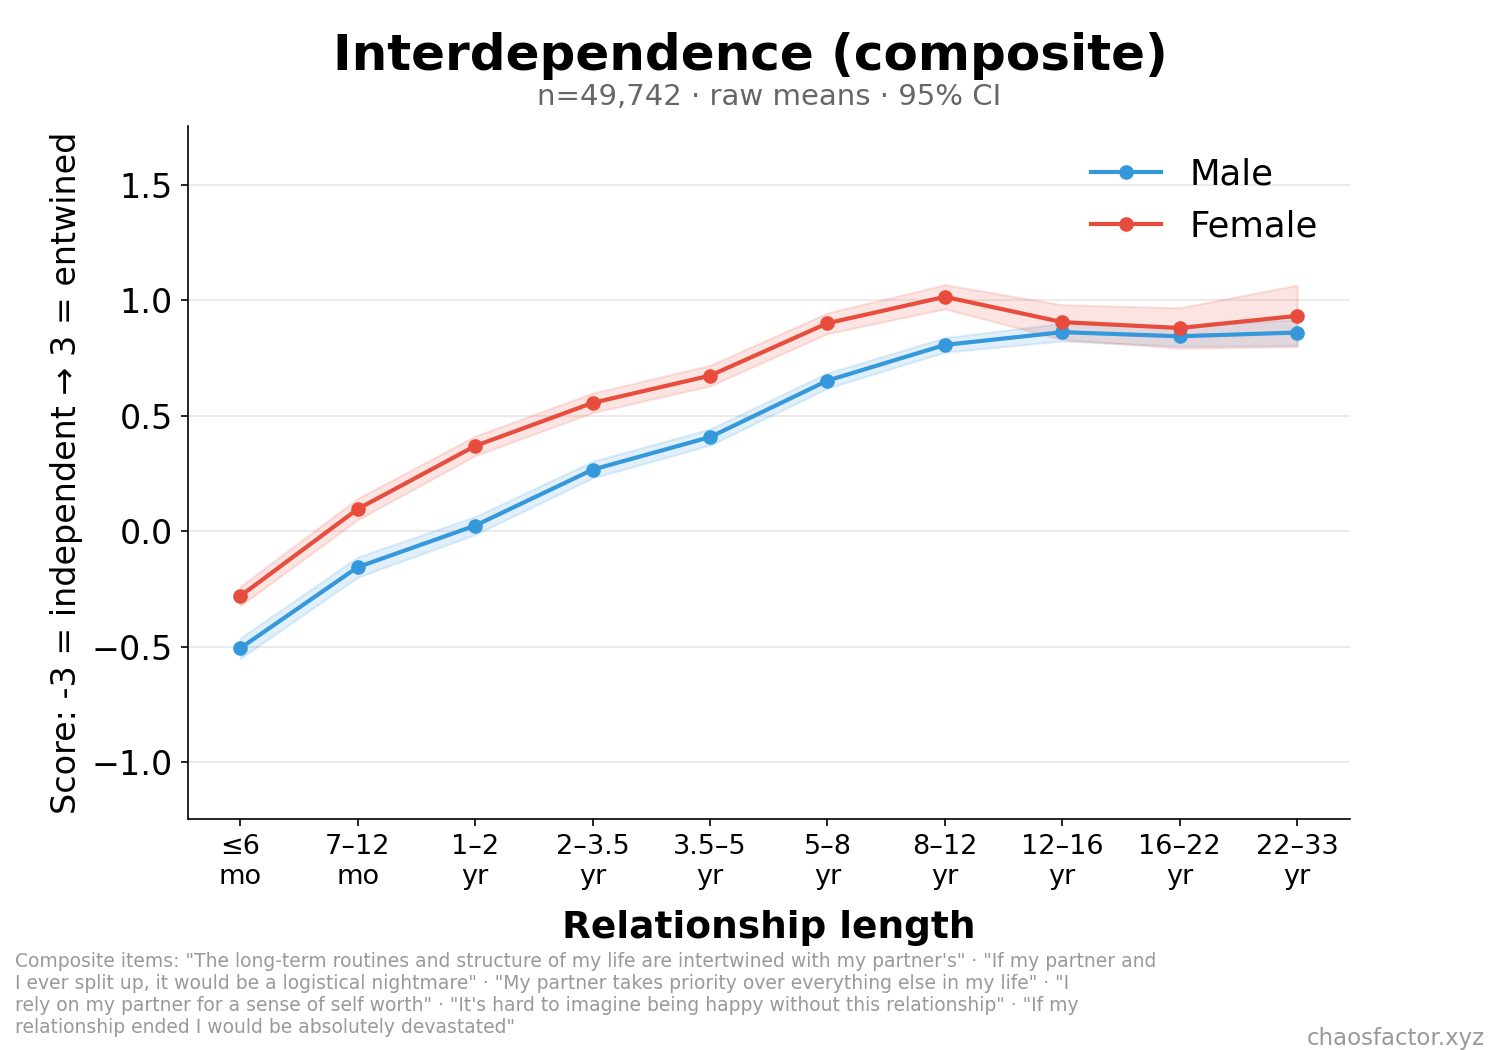
Interdependence is the steepest riser in the whole survey: from clearly-separate lives in new couples (−0.4) through a rapid climb that plateaus around year 8 (+0.87) — the curve of two lives being woven together, then staying woven.
Perceived mate-value mismatch ("if we broke up, I could date someone better than they could") also drains toward zero with time — whether because mismatched couples dissolve, or because long-partnered people stop ranking each other against the market, the data can't say.
05What erodes: transparency, friendship, conflict-handling
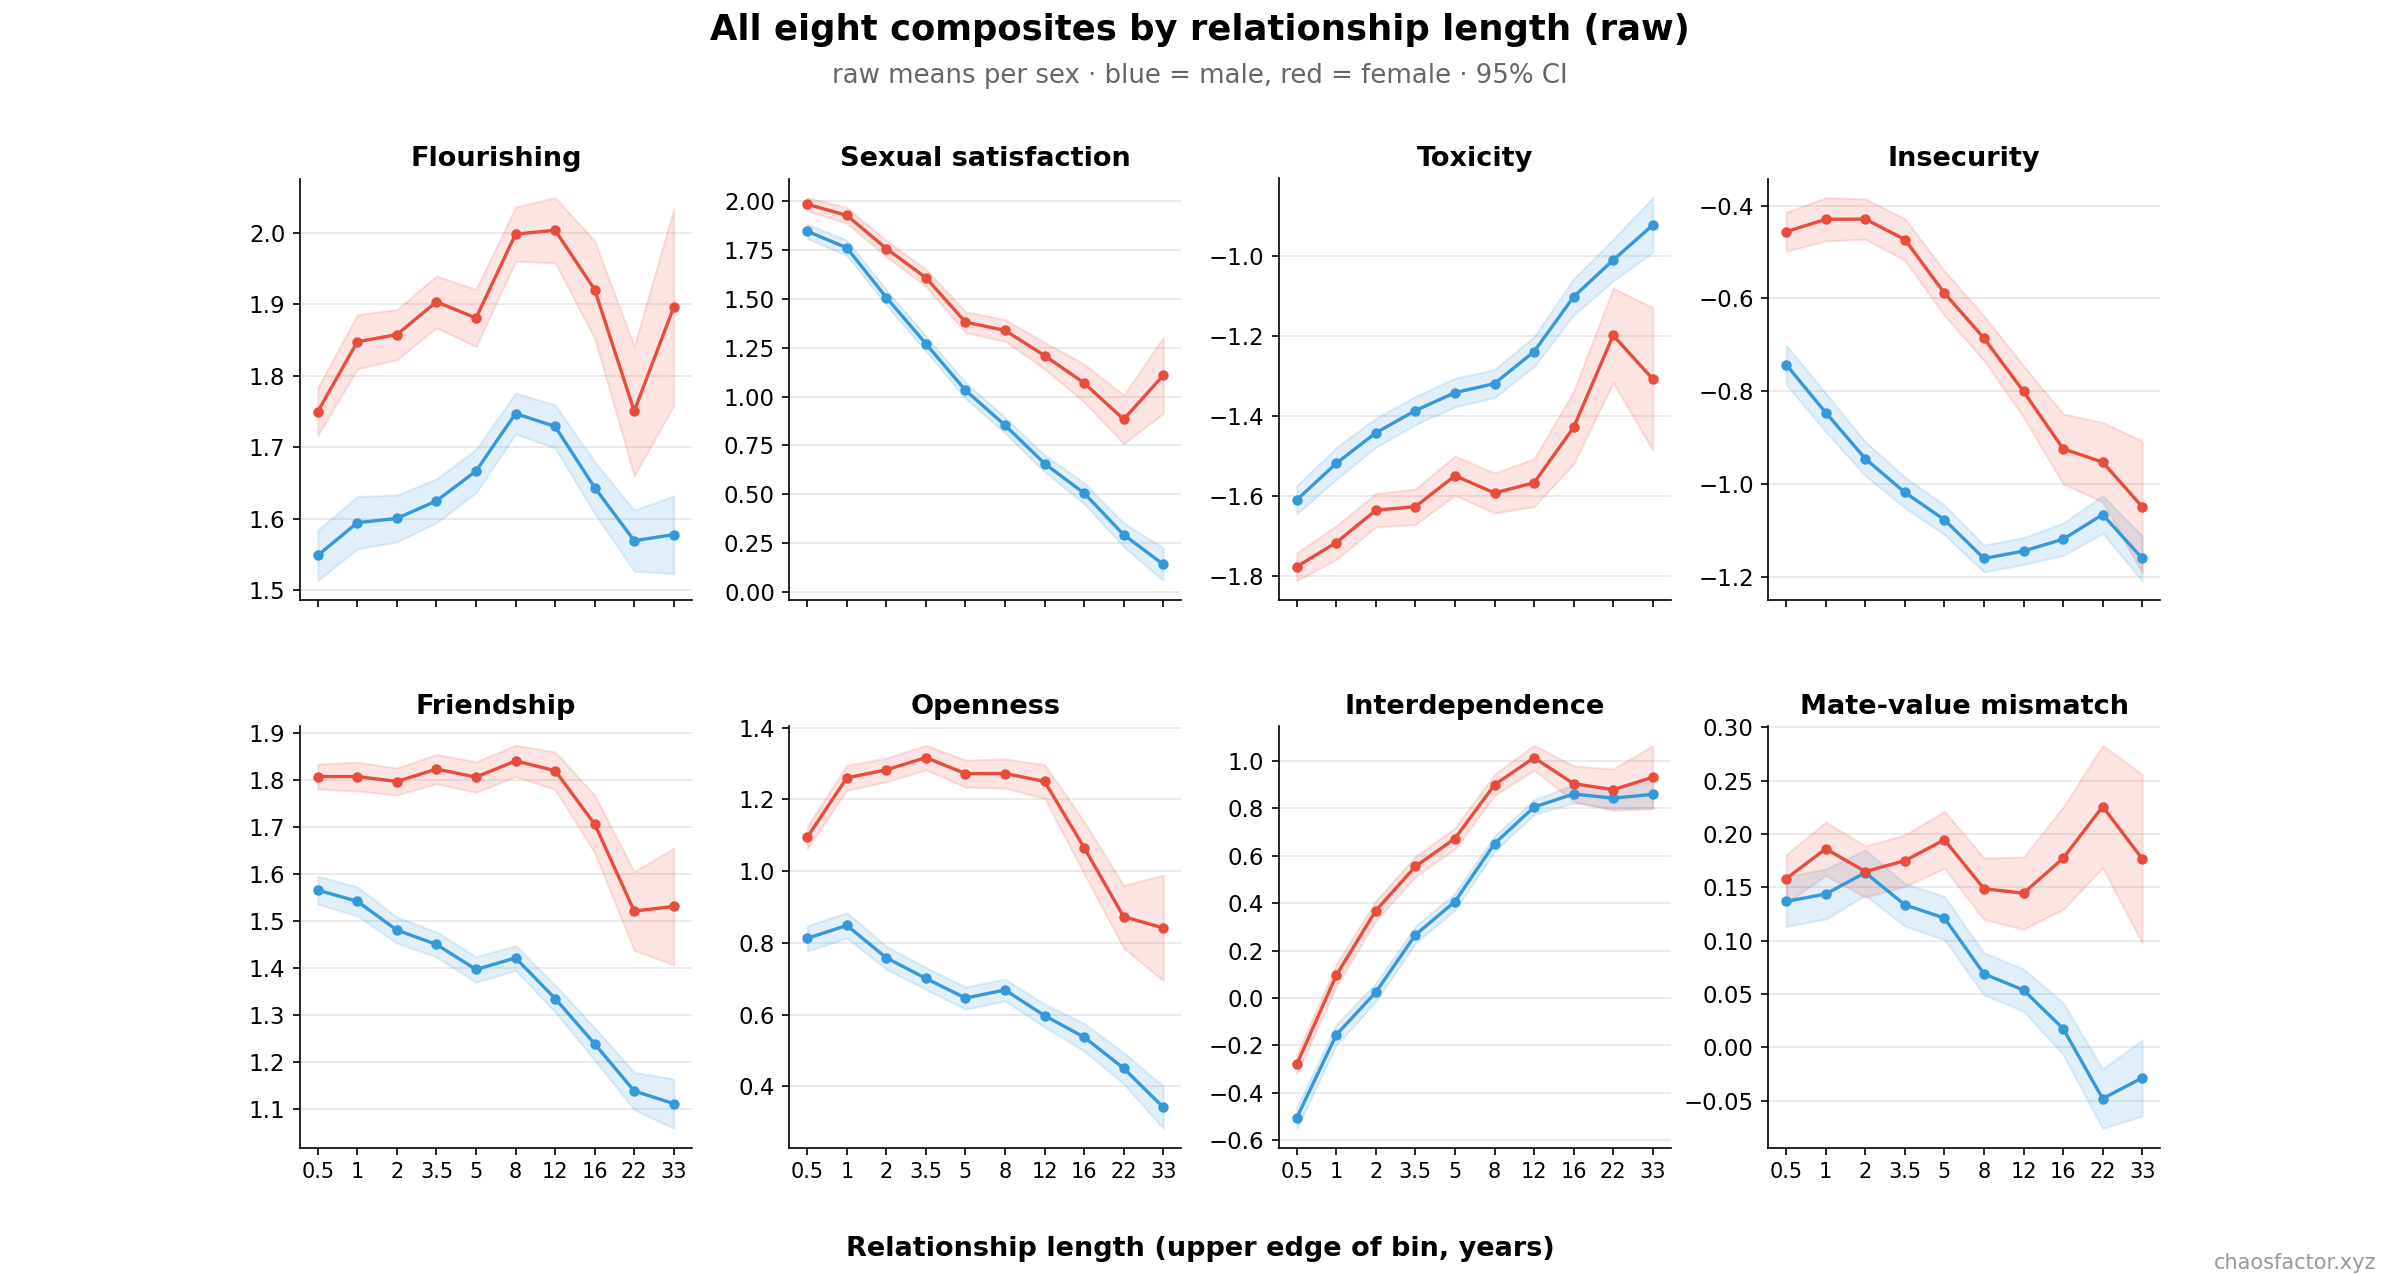
Under the flat flourishing line, three things slip slowly and steadily across the decades (all visible in the grid below): openness peaks around the one-year mark (1.04) and falls to 0.42 by 22–33 years — long-partnered people report more secrets and less meta-communication, not fewer. Friendship/similarity drifts from 1.69 to 1.17. And the toxicity composite (fear, judgment, grief, fights handled badly) creeps upward its entire range, from −1.70 to −0.98 — still net-low, but the direction is unflattering.
06And yet: flourishing stays flat
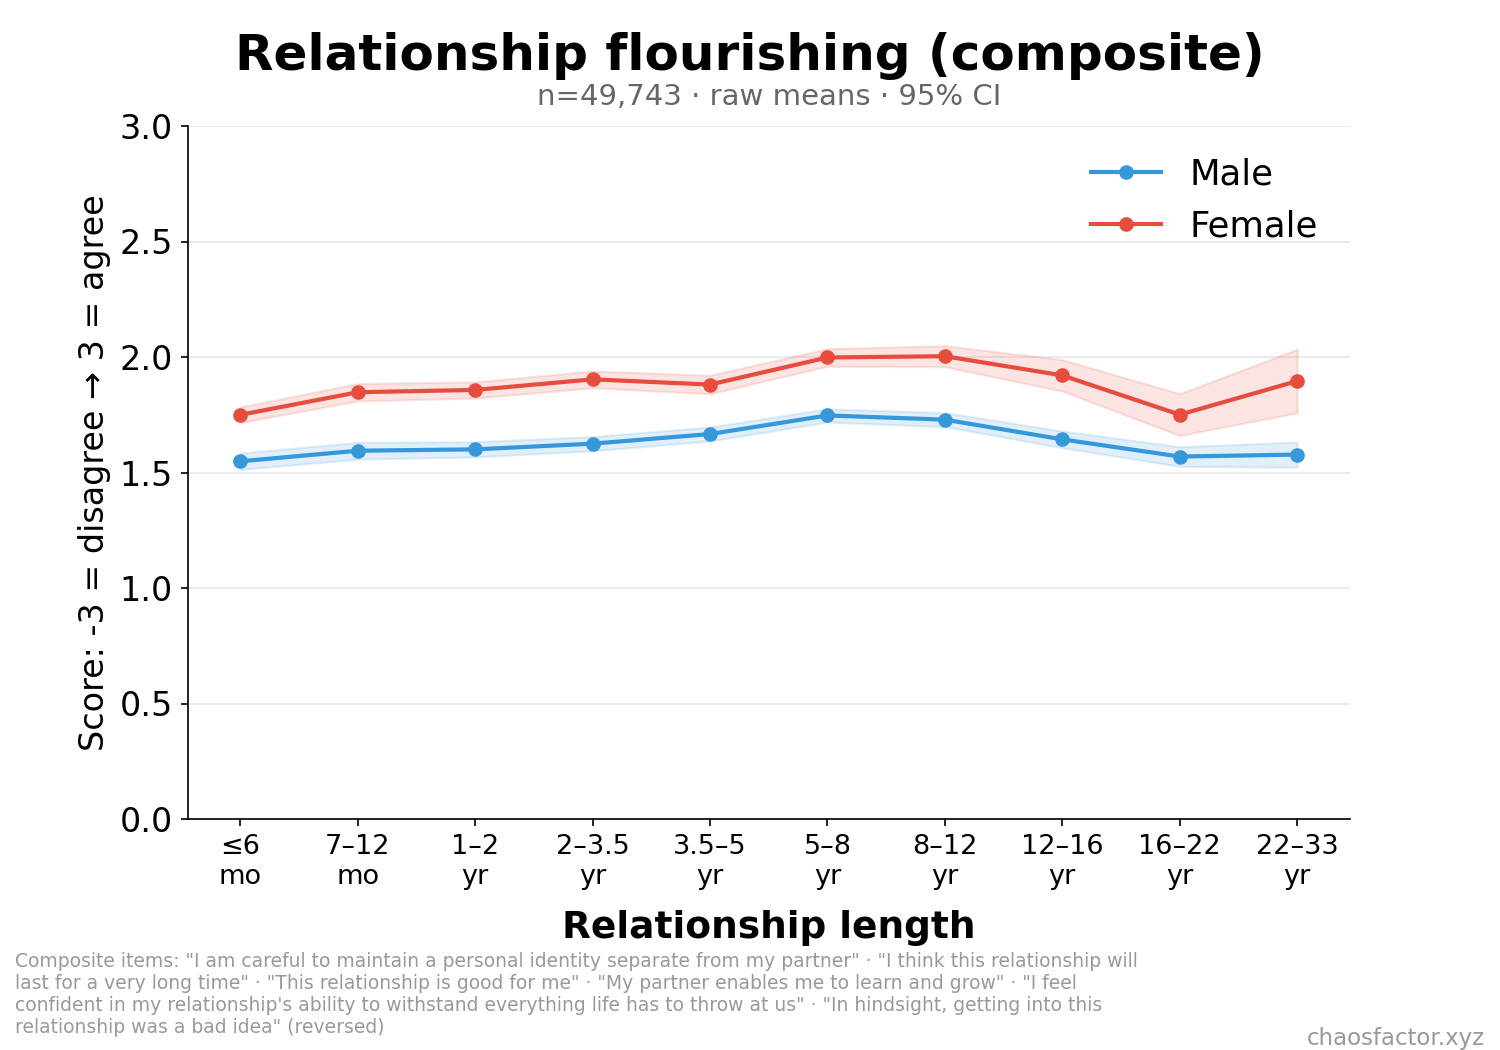
Given all that — passion gone, sex halved, transparency eroding — you might expect overall relationship quality to sag. It doesn't. Flourishing wobbles within a ~0.2 band for 33 years, with a mild peak around years 5–8 and its low points at the very start and the very end.
07Fighting and cheating
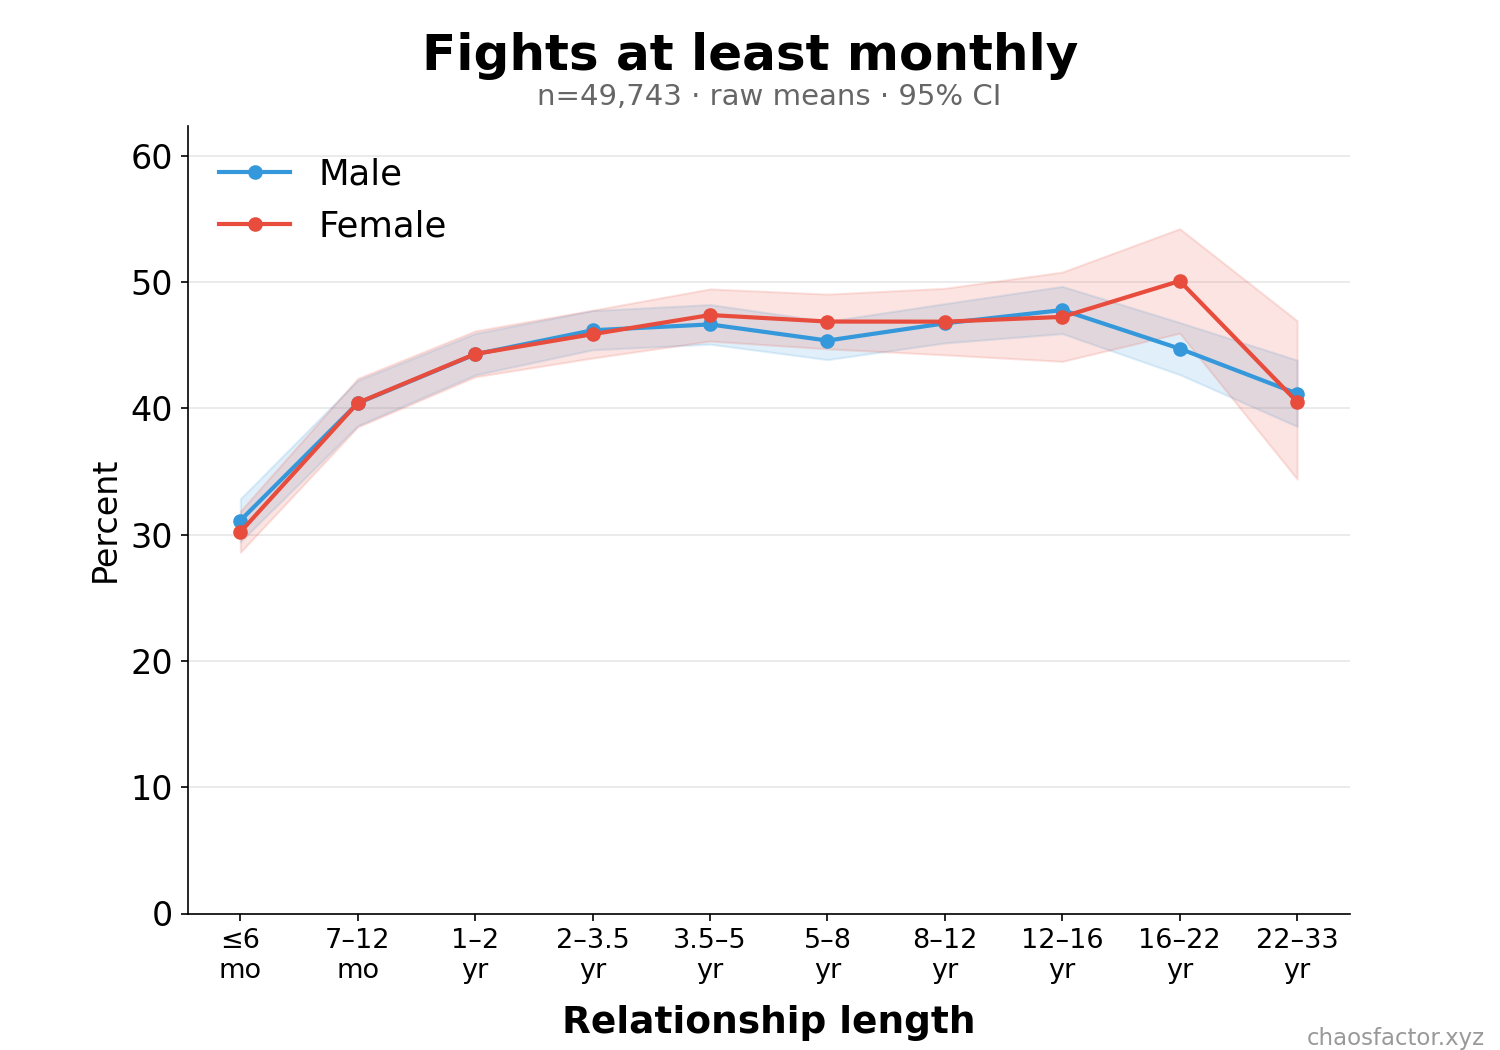
Brand-new couples barely fight (31% fight at least monthly in the first six months). That climbs to 40% in the second half of year one and ~44–47% from year one onward, where it sits for three decades, easing only slightly in the longest bins. The first year or so is when couples learn to fight; after that, the rate is a constant.
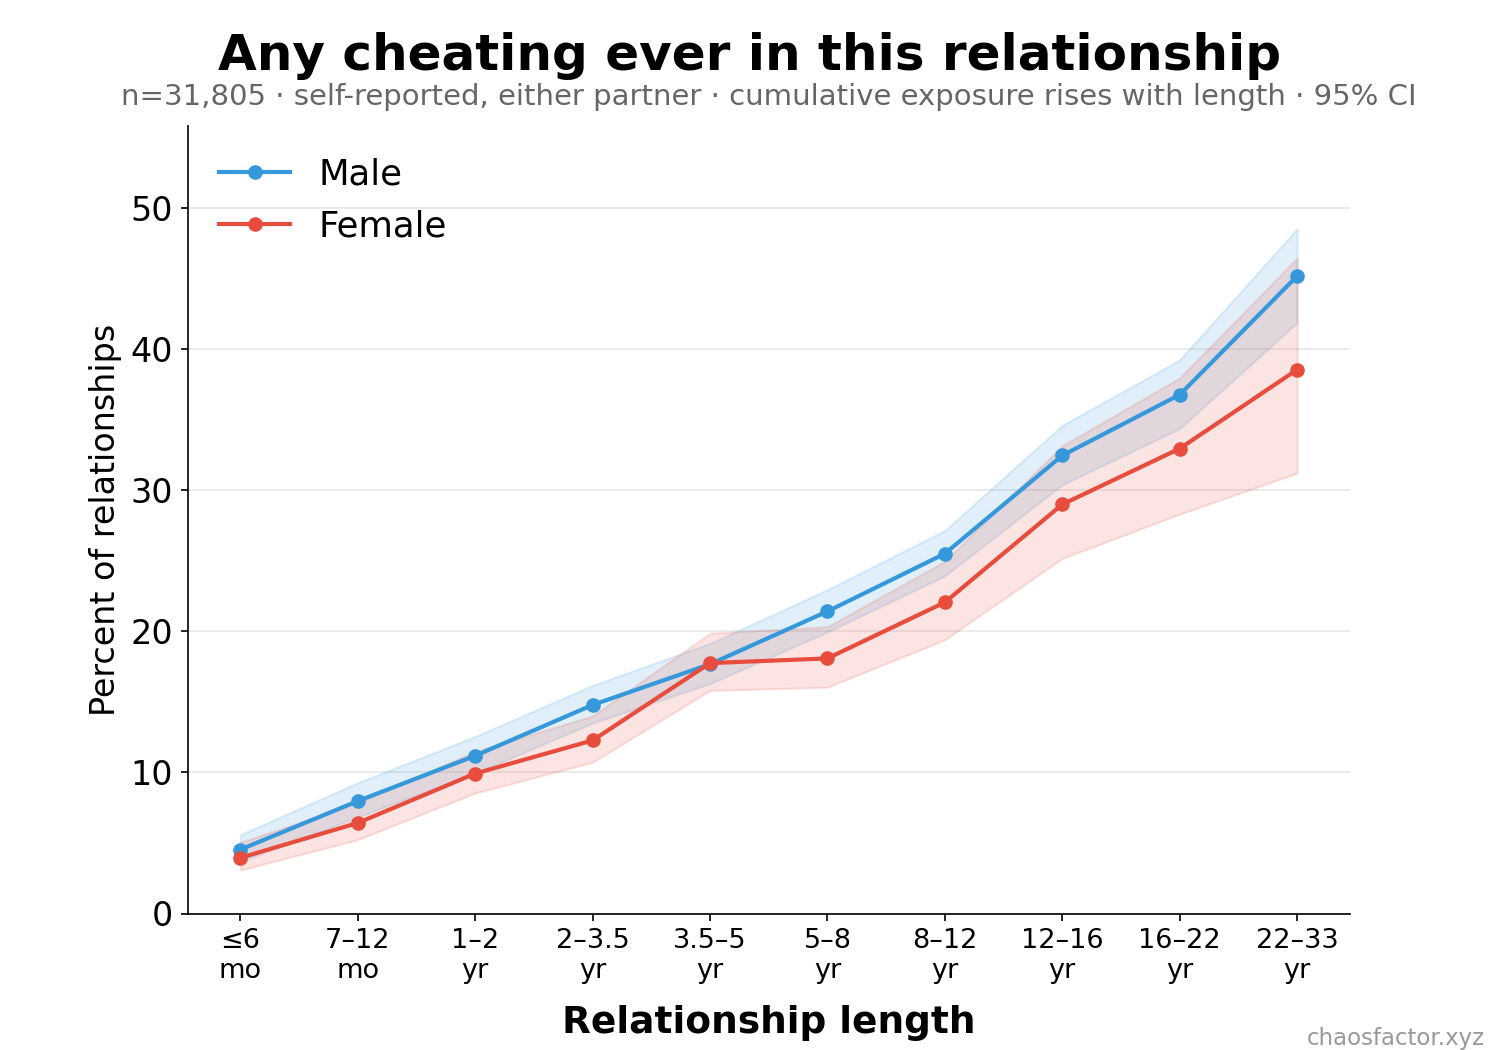
"Has either of you ever cheated?" climbs from 4% in new relationships to 44% at 22–33 years. Most of that is mechanical exposure — every year is another year in which cheating could have happened, and "ever" never resets. The notable part is that there's no safe plateau: the curve is still rising in the longest bins. (Roughly: a couple-decade relationship accumulates infidelity risk at a few percentage points every couple of years, and the suspicion item — "I suspect my partner might be cheating on me" — stays flat and very low at every length, so the discovered-cheating curve isn't driven by rising paranoia.)
08Do relationships drift mono → poly? No. Desire does.
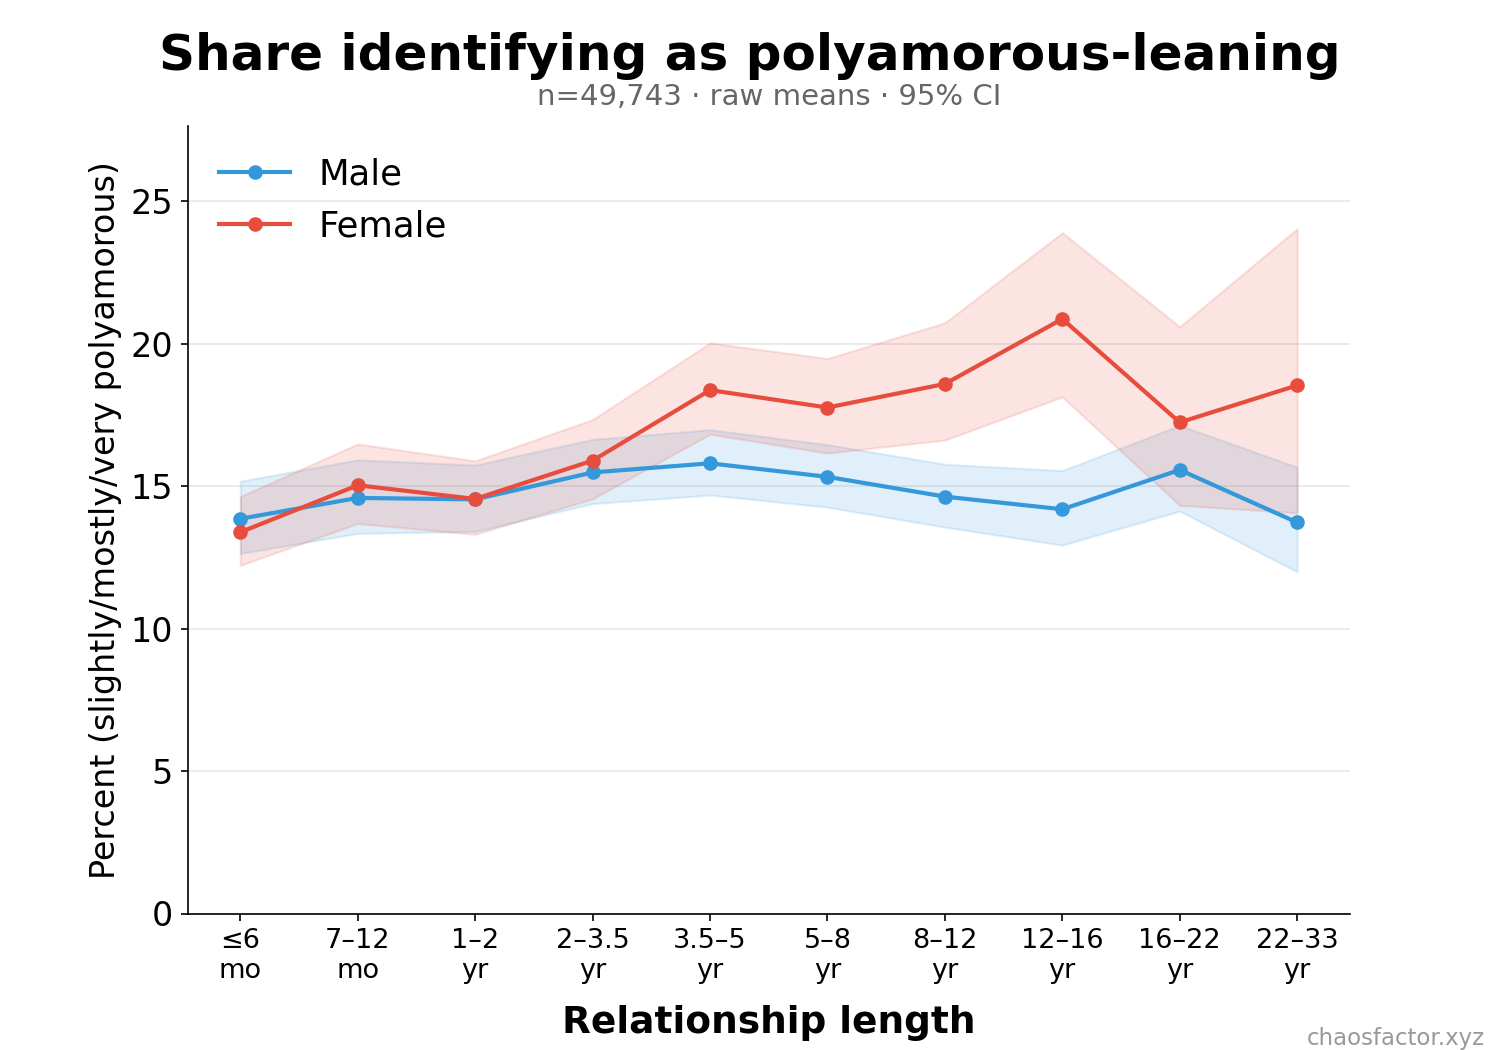
If couples commonly "opened up" as relationships aged, the share identifying as poly-leaning should rise with length. For men it doesn't budge: ~14–16% at every length from month one to year 33. Women show a modest real uptick — ~13–15% in the first few years, drifting to ~18–21% in relationships past 8 years — but nothing like a mass migration, and it could equally be selection (poly-identifying women may be likelier to keep long relationships intact, or to still be taking surveys about them) as drift.
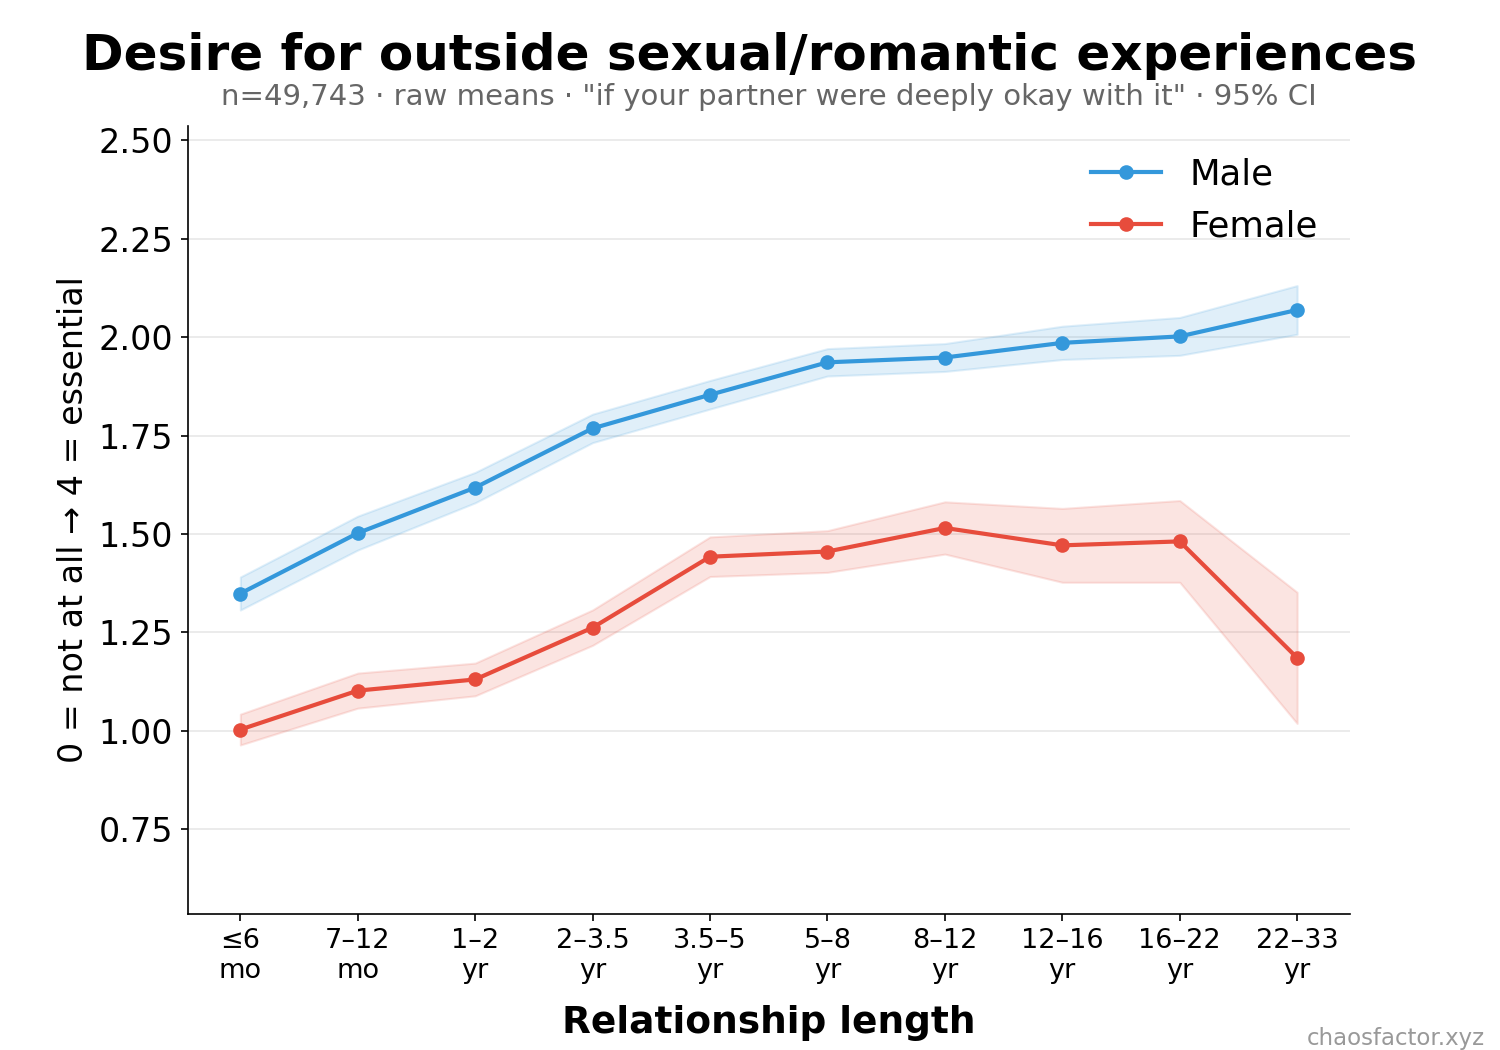
What does rise is the private appetite: "how interested would you be in outside experiences, if your partner were deeply okay with it" climbs from 1.17 to 1.94 (on 0–4) across the bins — roughly in mirror image to the passion decline. The gap between rising desire and flat practice is presumably absorbed by some combination of restraint, porn, fantasy… and the cheating curve above.
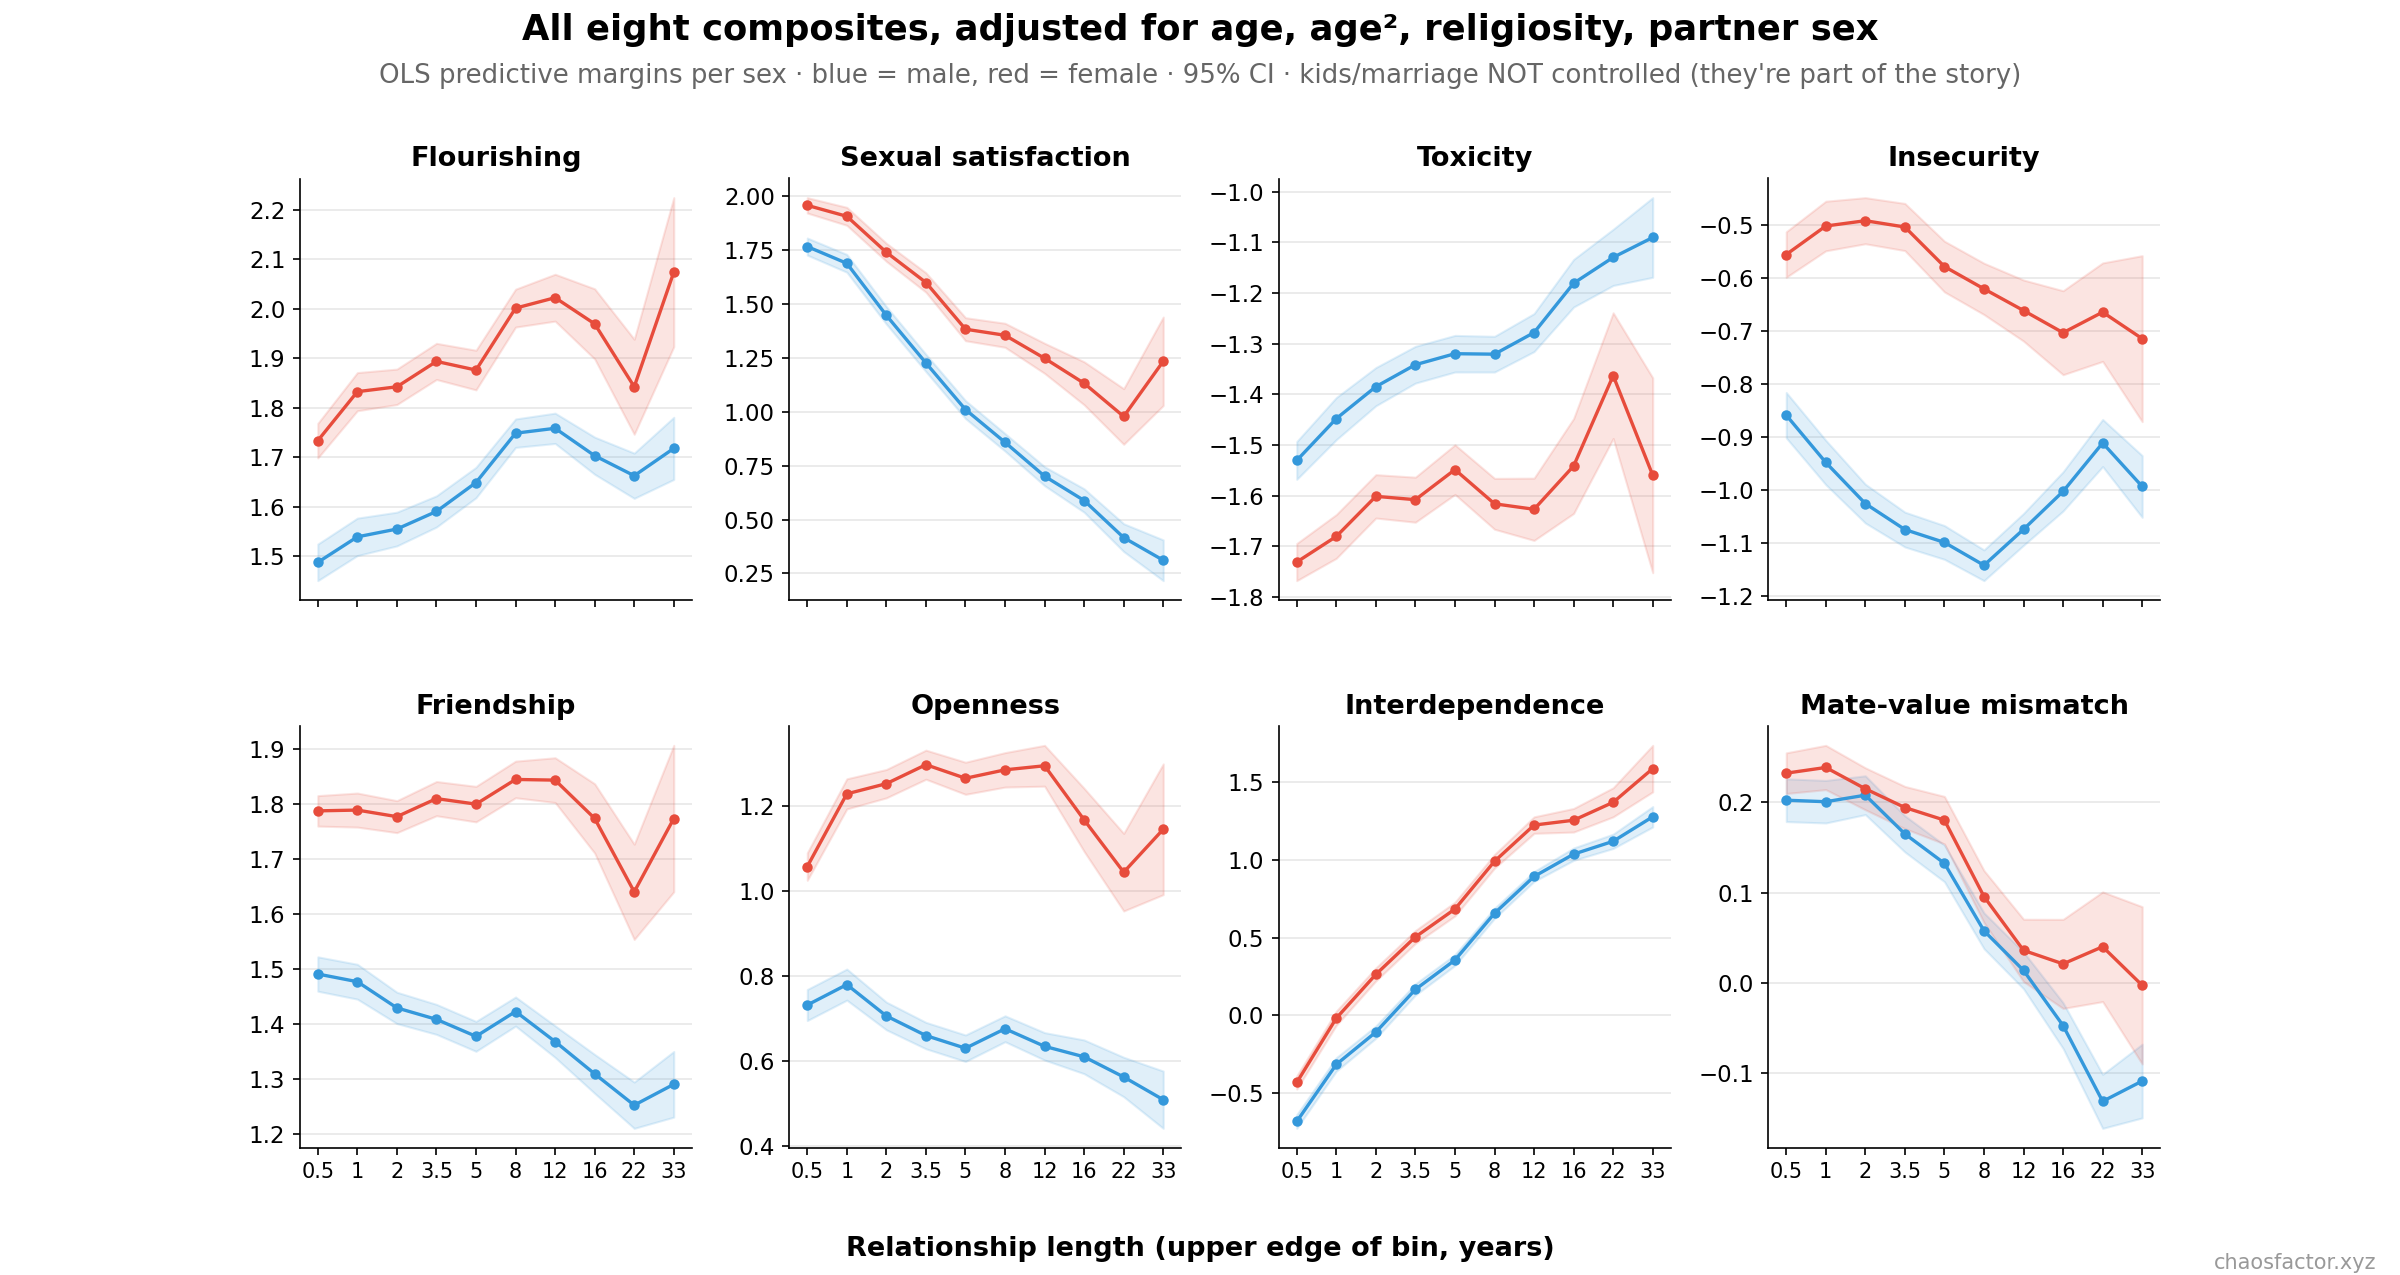
09Robustness
All composites re-estimated with controls for age, age², religiosity, and partner's sex (OLS predictive margins per sex). Kids and marriage are deliberately not controlled — they're part of what "time in a relationship" means, not confounds of it. The adjusted curves are nearly identical to the raw ones: the passion/satisfaction slide, the security rise, the openness erosion, and the flat flourishing line all survive. Since age and length are strongly correlated, the heatmap in §3 is the more transparent demonstration that length, not age, carries the sex decline.
10Methodology & limitations
Source, cleaning, and measures are identical to the Mono vs Poly report — see its methodology section for the full attrition table and composite definitions. Specific to this report:
- Length bins. The survey records length in coarse steps (months within year one, half-years to year five, years to 20, lumpy beyond). Bins were chosen to keep every cell above n≈1,500 pooled; the 33+ year tail (n=214) was dropped. Bin widths grow with length — the x-axis is labeled accordingly and is not linear in time.
- Survivorship / cross-section. Said above, repeated because it matters: these are different couples at different durations, not couples followed over time. Every "change over time" statement is shorthand for "difference across surviving relationships of different lengths."
- Cohort confounding. Long relationships belong to older cohorts. Age is controlled in the adjusted models; birth-cohort culture cannot be.
- Primary-partner framing. Multi-partner respondents answer about their longest/primary partner.
- Version-gated questions. Cohabitation/long-distance questions exist only in later survey versions (~65% of the cleaned sample); their charts use the available subset.
- "Ever cheated" accumulates exposure and never resets; its rise with length is partly mechanical.